. 2013 Mar;74(3):35-69.
doi: 10.1016/j.mser.2013.03.001.

Nanoparticles for Improving Cancer Diagnosis

Affiliations

Nanoparticles for Improving Cancer Diagnosis

Hongmin Chen et al. Mater Sci Eng R Rep. 2013 Mar.

Abstract

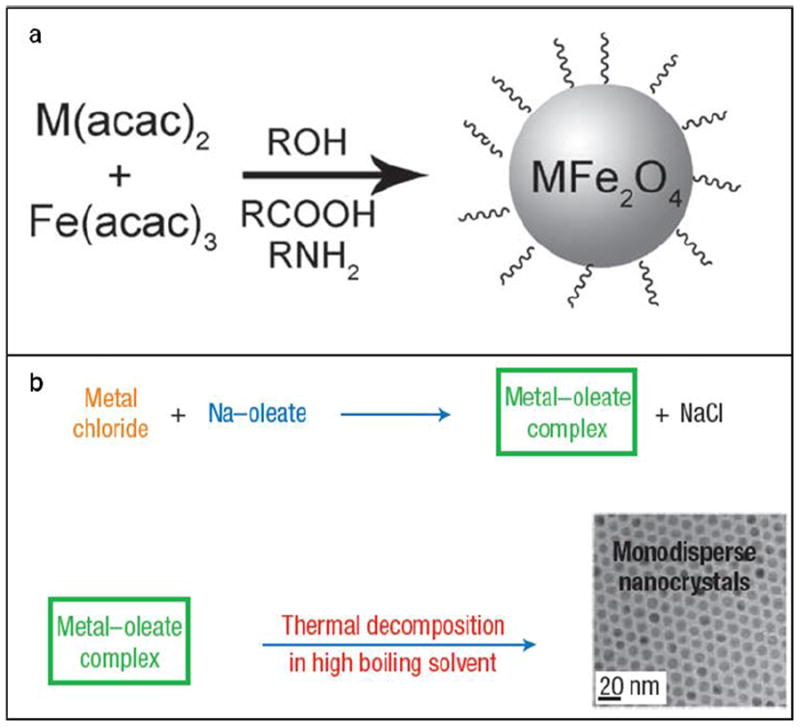
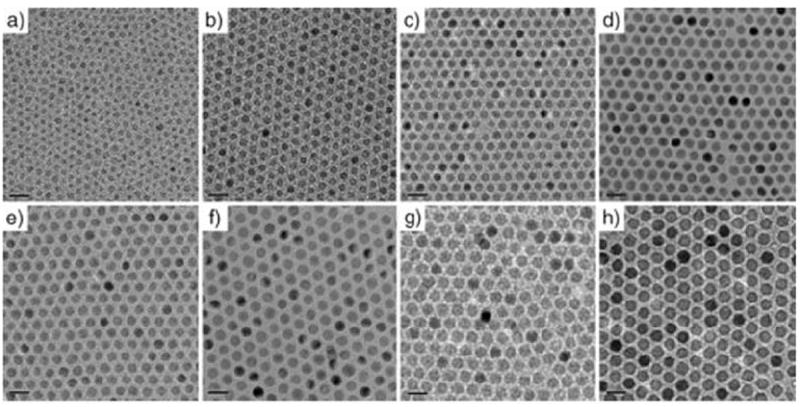
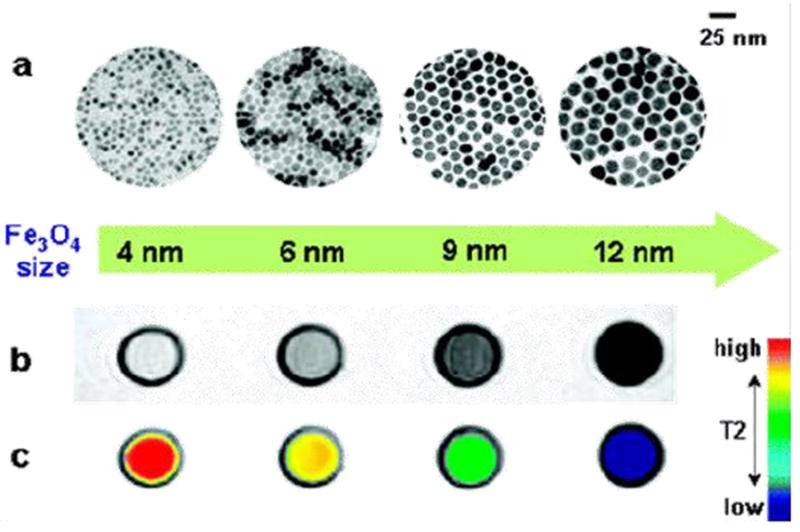
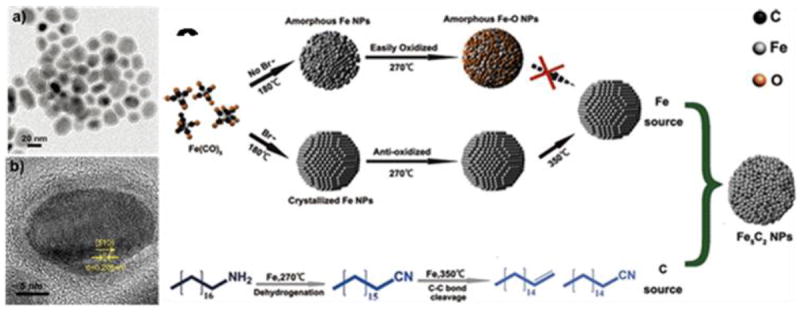
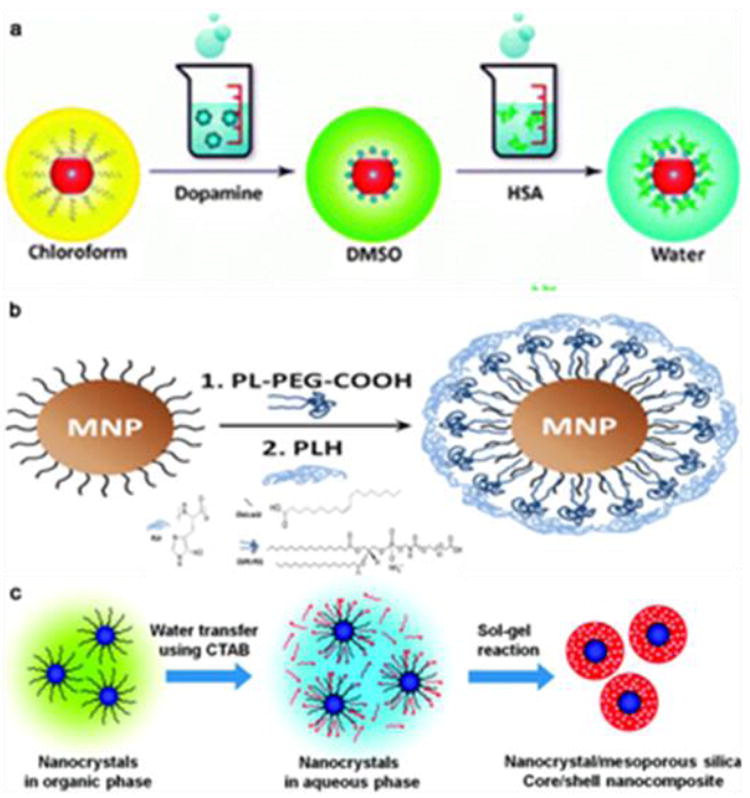
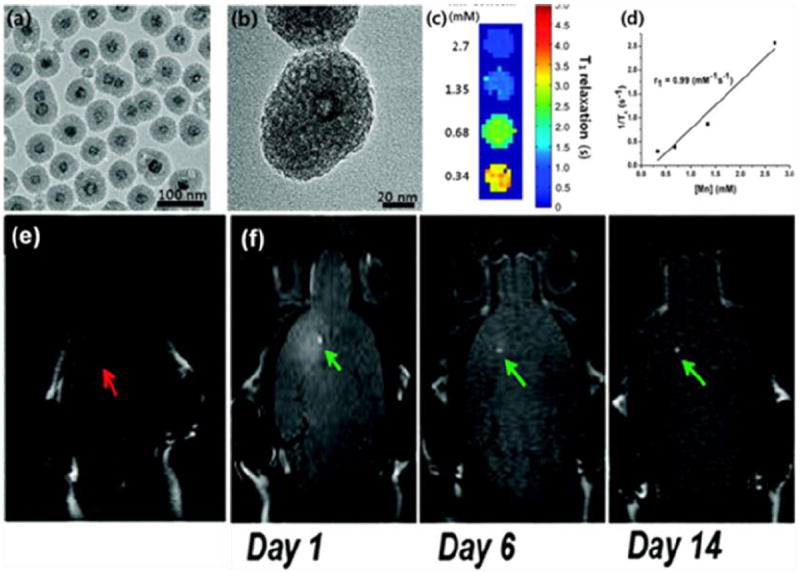
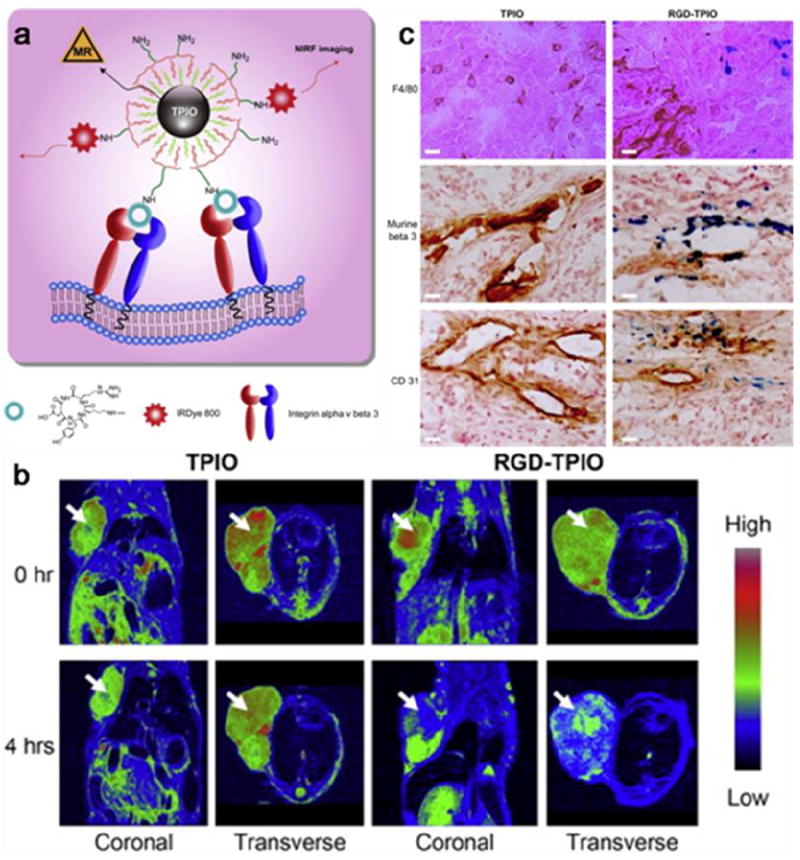
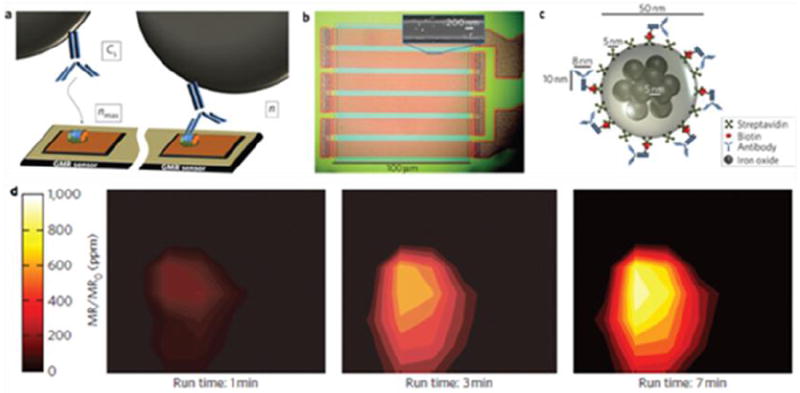
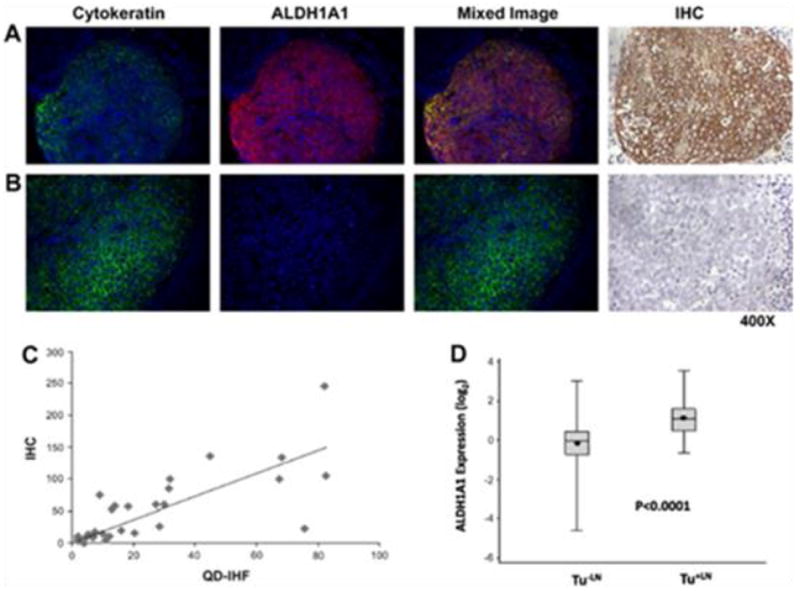
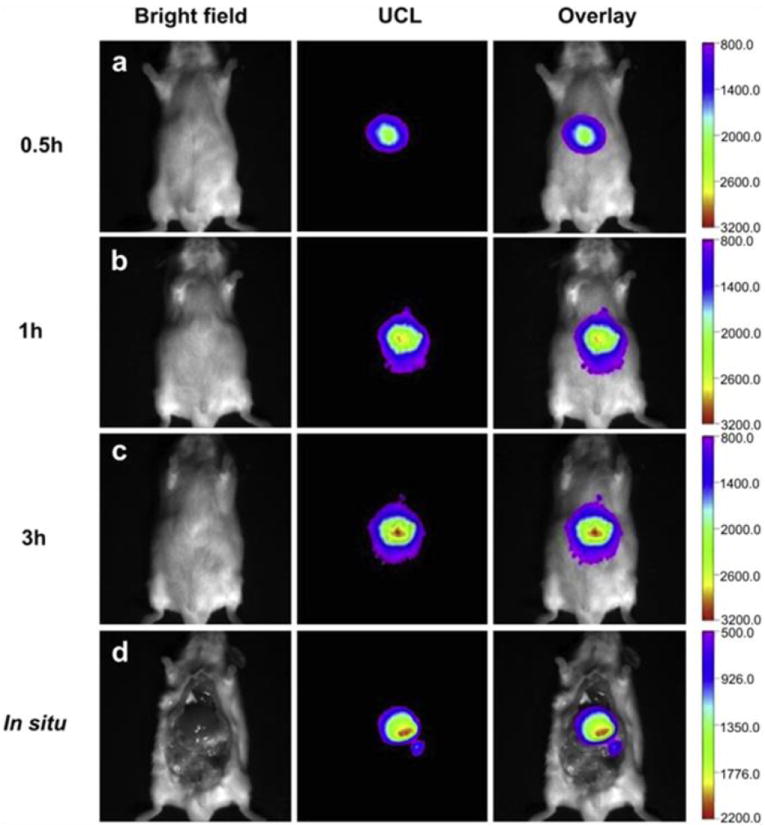
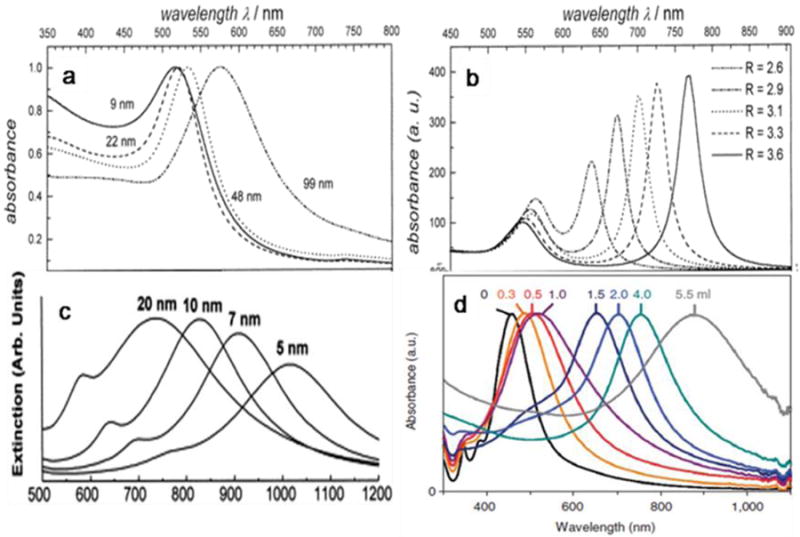
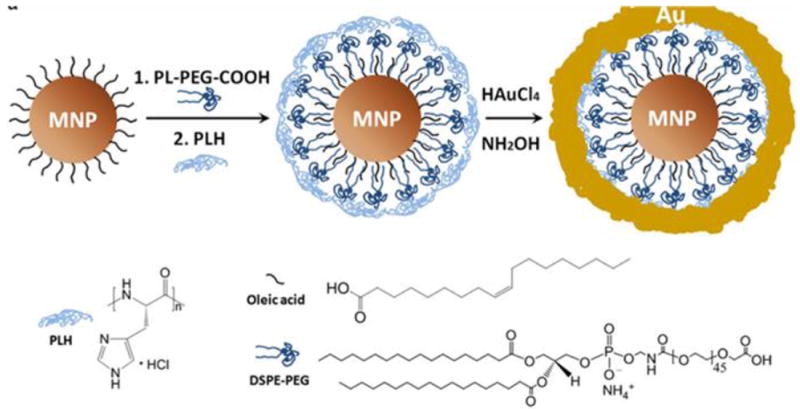
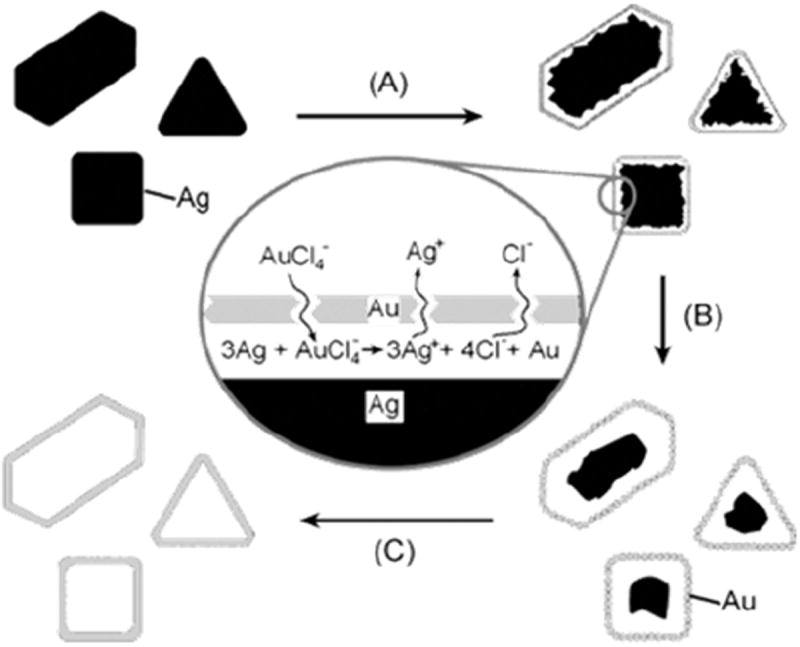
Despite the progress in developing new therapeutic modalities, cancer remains one of the leading diseases causing human mortality. This is mainly attributed to the inability to diagnose tumors in their early stage. By the time the tumor is confirmed, the cancer may have already metastasized, thereby making therapies challenging or even impossible. It is therefore crucial to develop new or to improve existing diagnostic tools to enable diagnosis of cancer in its early or even pre-syndrome stage. The emergence of nanotechnology has provided such a possibility. Unique physical and physiochemical properties allow nanoparticles to be utilized as tags with excellent sensitivity. When coupled with the appropriate targeting molecules, nanoparticle-based probes can interact with a biological system and sense biological changes on the molecular level with unprecedented accuracy. In the past several years, much progress has been made in applying nanotechnology to clinical imaging and diagnostics, and interdisciplinary efforts have made an impact on clinical cancer management. This article aims to review the progress in this exciting area with emphases on the preparation and engineering techniques that have been developed to assemble "smart" nanoprobes.

Keywords: bioconjugation; biomarkers; cancer diagnosis; imaging; nanomedicine; nanotechnology; surface modification.


Figures

Fig. 1
Fig. 1
Schematic illustration of the synthesis of monodisperse magnetic nanoparticles using different precursors: (a) metal acetylacetonates, (b) metal–oleate. Reprinted with permission from refs. [111] and [149].
Fig. 2
Fig. 2
TEM images of IONPs synthesized by a thermal decomposition route with precise control of their diameters. (a) 6 nm, (b) 7 nm, (c) 8 nm, (d) 9 nm, (e) 10 nm, (f) 11 nm, (g) 12 nm, (h) 13 nm. Reproduced with permission from [106].
Fig. 3
Fig. 3
Nanoscale size effect of IONPs on MR signals. (a) TEM images of nanoparticles of 4, 6, 9, and 12 nm. (b) Size-dependent T2-weighted MR images of IONPs at 1.5 T. (c) Size-dependent changes in color-coded MR images based on T2 values. Reprinted with permission from [113].
Fig. 4
Fig. 4
Fe5C2 nanopaticles synthesized by thermal decomposition. (a) TEM and (b) HRTEM images of 20 nm Fe5C2 nanopaticles. (c) schematic illustration of the formation mechanism of Fe5C2 nanopaticles. Reprinted with permission from [124].
Fig. 5
Fig. 5
Representative IONPs surface modification methods. (a) Ligand exchange; (b) ligand addition; (c) silica coating. Reproduced by permission from ref. [134], [140], and [145].
Fig. 6
Fig. 6
In vivo MRI tracking of transplanted adipose-derived MSCs bearing HMnO@mSiO2. (a) TEM and (b) HRTEM images of HMnO@mSiO2 nanoparticles. (c) T1 map of HMnO@mSiO2 nanoparticles of different concentrations at 11.7 T. (d) Plot of R1 versus Mn concentration. In vivo MRI results when (e) unlabeled MSCs and (f) HMnO@mSiO2-labeled MSCs were injected into small animal models. Reprinted with permission from [148].
Fig.7
Fig.7
Triblock copolymer coated IONPs (TPIONPs) conjugated with RGD peptides and dye molecules for tumor targeting. (a) Schematic illustration of the optical/MR dual-modal imaging probes. (b) MR imaging of U87MG tumor-bearing mice injected with RGD–TPIONPs or TPIONPs. (c) Prussian blue and CD31/murine β3/F4/80 double staining withthe tumor sections. Reprinted with permission from ref. [162].
Fig. 8
Fig. 8
Magnetic nanoparticle-based biosensors. (a) Schematic representation of antibody–antigen binding on the GMR sensor surface. (b) Optical micrograph showing the GMR sensor architecture. Inset: SEM image of one stripe of the GMR sensor that is bound with magnetic nanoparticle tags. (c) Schematic representation of a magnetically labeled antibody, drawn to scale. (d) Visualization of CEA protein surface concentration at different times using a high-density GMR sensor array. Reprinted with permission from ref. [184].
Fig. 9
Fig. 9
Photo-physical properties of QDs. (a) Size-dependent light emission. (b) Comparison of photostability between QDs and dye molecules. (c) Capability of absorbing high-energy (Uv-blue) light and emitting fluorescence with a large Stokes shift enables efficient separation of the QD signal over the fluorescent background. Reprinted with permission from ref. [202, 206].
Fig. 10
Fig. 10
Routes for water-solubilization of hydrophobic QDs. (a–f) Ligand-exchange; (g–h) encapsulation. Reprinted with permission from ref. [202].
Fig. 11
Fig. 11
Histological images from the major organs of the rhesus macaques three months after intravenous injection of the QD formulation. In each pair, the left image is from the control animal and the right image is from a treated animal. Tissues were collected from brain (a), heart (b), liver (c), spleen (d), lung (e), kidney (f), lymph (g), intestine (h) and skin (i). Images were taken at ×40 magnification. Reprinted with permission from ref. [259].
Fig. 12
Fig. 12
In vivo imaging of implanted QD-tagged tumor cells. (a) Bright QD tags enable visualization of tumor cells with a non-invasive whole-animal fluorescence imaging, whereas organic dye signal is indistinguishable from autofluorescence. (b) Imaging of subcutaneously implanted QD-loaded microbeads shows the potential for multiplexed in vivo cell detection and tracking. Reprinted with permission from ref. [244].
Fig. 13
Fig. 13
In vivo NIR fluorescence imaging results with QDs. (a) Structure and synthesis of QD710-Dendron-RGD2 conjugate. (b) Representative organ histology of PBS and QD710-Dendron treated animals. Scale bar, 100 μm. The dorsal images of SKOV3 tumor-bearing (arrows) mice (L, left side; R, right side) injected with (c) QD710-Dendorn-RGD2 (200 pmol) and (d) QD710-Dendron (200 pmol) at 0.5, 1, 4, 5, 5.5, 6, 8, 24, and 28 h p.i. Reprinted with permission from ref. [263].
Fig. 14
Fig. 14
Correlation between QD-based IHF and conventional IHC. (a) Aldehyde dehydrogenase 1 (ALDH1A1)-positive tumour; (b) ALDH1A1-negative tumour; (c) Correlation between ALDH1A1 expression levels measured by immunohistochemistry (IHC) and by QD-IHF. Calculated using Spearman’s rank correlation. (d) Box-Plot for ALDH1A1 in non-metastatic and metastatic groups. Reprinted with permission from ref. [272].
Fig. 15
Fig. 15
UCNP multicolor fine-tuning with dopants: (a) NaYF4:Yb3+/Er3+ (18/2 mol%), (b) NaYF4:Yb3+/Tm3+ (20/0.2 mol%), (c) NaYF4:Yb3+/Er3+ (25–60/2 mol%), and (d) NaYF4:Yb3+/Tm3+/Er3+ (20/0.2/0.2–1.5 mol %) (10 mM). Luminescent photos of (e) NaYF4:Yb/Tm (20/0.2 mol%), (f–j) NaYF4:Yb3+/Tm3+/Er3+ (20/0.2/0.2–1.5 mol%), and (k–n) NaYF4:Yb3+/Er3+ (18–60/2 mol%). Reprinted with permission from ref. [280].
Fig. 16
Fig. 16
Simultaneous phase and size control of UCNPs through lanthanide doping. (a–c), TEM images of NaYF4:Yb3+/Er3+ (18/2 mol%) products in the absence of Gd3+ dopant ions. (d) HRTEM image of UCNPs. (e) Selected area electron diffraction pattern of UCNPs in (a). (f-h) TEM images of the NaYF4:Yb3+/Er3+ (18/2 mol%) products. (i) HRTEM image of UCNPs in (h). (j) DFT calculation. Scale bars are 500 nm in (a–c), 200 nm in (f–h) and 5 nm in (d) and (i). Reprinted with permission from ref. [316].
Fig. 17
Fig. 17
Cell viability reults from MTT assays with UCNPs. KB cells were cultured in the presence of 100-500 μg/mL UCNPs for 4 h and 24 h. Reprinted with permission from ref. [339].
Fig. 18
Fig. 18
In vivo UCL images taken after injection of UCNP solutions into a mouse at (a) 0.5 h, (b) 1 h, and (c) 3 h. (d) In situ UCL imaging results taken 3 h after the particle injection. Reprinted with permission from ref. [368].
Fig. 19
Fig. 19
SPR absorption spectra of (a) spherical GNPs of different sizes, (b) GNRs of different length-to-diameter ratios, (c) GNSs of different thickness, and (d) GNCs. Reprinted with permission from ref. [369, 377, 410].
Fig. 20
Fig. 20
Schematic illustration of the formation of gold shells. Reprinted with permission from ref. [140].
Fig. 21
Fig. 21
Schematic illustration of the formation of GNCs. Reprinted with permission from ref. [406].
Fig. 22
Fig. 22
Representative OCT images from normal skin and muscle tissue areas of mice systemically injected with GNSs (A) or with PBS (B). Representative OCT images from tumors of mice systemically injected with GNSs (C) or with PBS (D). (E) Histogram graph of results from (A) to (D). Reprinted with permission from ref. [444].
Fig. 23
Fig. 23
A novel particle-based contrast probe for PA imaging. (a) Diagram depicting the dual-contrast agent concept. (b) Step-by-step diagram of remote activation of the particle probes. (c) PA images reconstructed using vaporization-based and thermal expansion-based signals captured at one location. (d) Magnitude of pressure transients. Reprinted with permission from ref. [454].
Fig. 24
Fig. 24
(a) SERS signals obtained from 4MBA-labeled GNRs and Au@Ag NRs; (b) SERS spectra of Au@Ag NR@4MBA@PAH and the targeting probe. Reprinted with permission from ref. [462].
Fig. 25
Fig. 25
(a) Two-dimensional axial MRI, PA and Raman images. The post-injection images of all three modalities showed clear tumor visualization (dashed boxes outline the imaged area). (b) A three-dimensional (3D) rendering of MR images with the tumor segmented (red; top), an overlay of the three-dimensional PA images (green) over the MRI (middle) and an overlay of MRI, the segmented tumor and the PA images (bottom) showing good colocalization of the PA signal with the tumor. (c) Quantification of the signals in the tumor showing a significant increase in the MRI, PA, and Raman signals after as compared to before the injection. Reprinted with permission from ref. [464].
Fig. 26
Fig. 26
In vivo CT volume-rendered images of (A) mouse before injection of GNPs, (B) mouse 6 hours p.i. of nonspecific immunoglobulin G conjugated GNPs as a passive targeting experiment, and (C) mouse 6 hours p.i. Reprinted with permission from ref. [470].
Fig. 27
Fig. 27
(A) Absorption profile variation of multifunctional oval-shaped GNPs due to the addition of different cancerous and noncancerous cells. (B) Photograph showing colorimetric change upon addition of different cancer cells (104 cells/mL). (C) Photograph demonstrating colorimetric change upon the addition of different numbers of SK-BR-3 cells. Reprinted with permission from ref. [479].

References

    1. Kochanek KD, Kirmeyer SE, Martin JA, Strobino DM, Guyer B. Pediatrics. 2012;129:338–348. - PMC - PubMed
    1. Jemal A, Siegel R, Xu J, Ward E. CA Cancer J Clin. 2010;60:277–300. - PubMed
    1. Jemal A, Siegel R, Ward E, Hao Y, Xu J, Murray T, Thun MJ. CA Cancer J Clin. 2008;58:71–96. - PubMed
    1. Jiang Y, Wang X. J Hematol Oncol. 2012;5:11. - PMC - PubMed
    1. Zhang S, Liu CC, Li W, Shen H, Laird PW, Zhou XJ. Nucleic Acids Res. 2012;40:9379–9391. - PMC - PubMed