

Generalization and dilution of association results from European GWAS in populations of non-European ancestry: the PAGE study
- PMID: 24068893
- PMCID: PMC3775722
- DOI: 10.1371/journal.pbio.1001661
Generalization and dilution of association results from European GWAS in populations of non-European ancestry: the PAGE study
Abstract
The vast majority of genome-wide association study (GWAS) findings reported to date are from populations with European Ancestry (EA), and it is not yet clear how broadly the genetic associations described will generalize to populations of diverse ancestry. The Population Architecture Using Genomics and Epidemiology (PAGE) study is a consortium of multi-ancestry, population-based studies formed with the objective of refining our understanding of the genetic architecture of common traits emerging from GWAS. In the present analysis of five common diseases and traits, including body mass index, type 2 diabetes, and lipid levels, we compare direction and magnitude of effects for GWAS-identified variants in multiple non-EA populations against EA findings. We demonstrate that, in all populations analyzed, a significant majority of GWAS-identified variants have allelic associations in the same direction as in EA, with none showing a statistically significant effect in the opposite direction, after adjustment for multiple testing. However, 25% of tagSNPs identified in EA GWAS have significantly different effect sizes in at least one non-EA population, and these differential effects were most frequent in African Americans where all differential effects were diluted toward the null. We demonstrate that differential LD between tagSNPs and functional variants within populations contributes significantly to dilute effect sizes in this population. Although most variants identified from GWAS in EA populations generalize to all non-EA populations assessed, genetic models derived from GWAS findings in EA may generate spurious results in non-EA populations due to differential effect sizes. Regardless of the origin of the differential effects, caution should be exercised in applying any genetic risk prediction model based on tagSNPs outside of the ancestry group in which it was derived. Models based directly on functional variation may generalize more robustly, but the identification of functional variants remains challenging.
Conflict of interest statement
The authors have declared that no competing interests exist. The contents of this paper are solely the responsibility of the authors and do not necessarily represent the official views of the NIH, the Centers for Disease Control, the Indian Health Service, or any other funding agency.
Figures
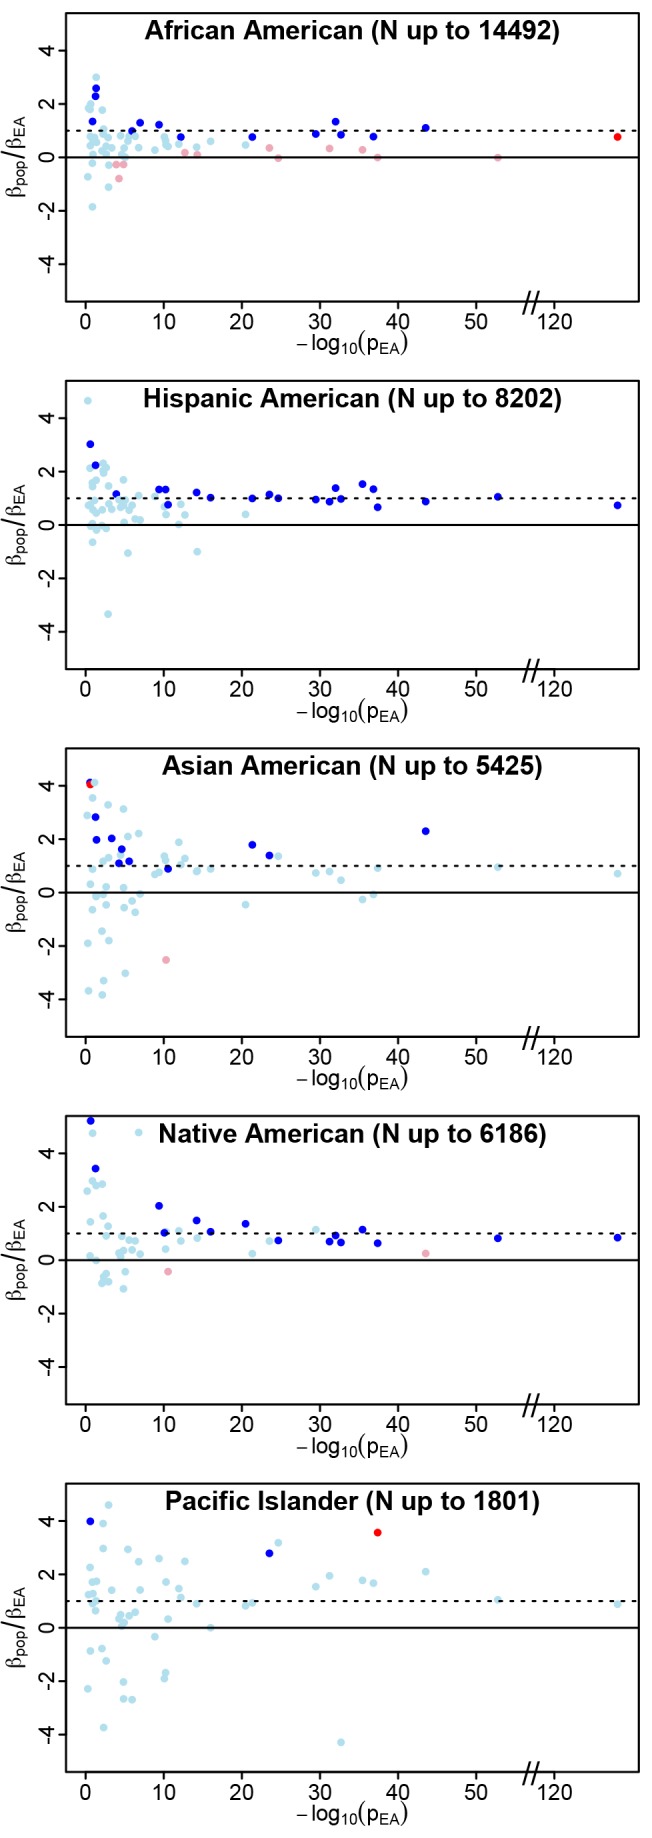
 on the y-axis as an indicator of both consistency of direction (positive values are consistent with effects in the same direction) and relative magnitude of effect (consistent but weaker effects in the non-EA will have ratios between 0 and 1). The p value for trait association in the PAGE European American population (pEA) is an indicator of the strength of the original association. For each index SNP, we plot
  against −log10(pEA). Data points are colored as follows: ambiguous SNPs are light blue (
 and
and  ), strictly generalized SNPs are dark blue (
 and
and  ), differentially generalized SNPs are dark red (
 and
and  ), and differential SNPs are pink (
 and
and  ). The y-axis has been constrained to (−4,4) for illustrative purposes; some loci yielded
  ratios outside this range, but pEA>0.05 for all of these. As expected, larger non-EA populations show less scatter in
  than the smaller non-EA populations (particularly Pacific Islanders), consistent with more precise estimates of
  in the larger non-EA populations. Two clear trends are apparent in these plots: first, a trend toward
  ratios greater than zero in all populations, especially for stronger effects in EA (−log10(pEA)>10), reflecting consistency of direction between EA and non-EA populations. Second, a trend toward ratios greater than zero but less than one is observed in African Americans, representing the trend toward dilution in this population, relative to EA. The second trend is not apparent in the other non-EA populations. Similar plots of
  against observed allele frequency in the non-EA populations demonstrate that the allele frequency distribution for differential observations in AA is not different from the distribution of either ambiguous or strictly generalized loci, so the significantly diluted effects are not attributable to variants with low allele frequency in this population (Figure S1).
Comment in
-
Deep genealogy and the dilution of risk.PLoS Biol. 2013 Sep;11(9):e1001660. doi: 10.1371/journal.pbio.1001660. Epub 2013 Sep 17. PLoS Biol. 2013. PMID: 24068892 Free PMC article. No abstract available.
References
-
- Need AC, Goldstein DB (2009) Next generation disparities in human genomics: concerns and remedies. Trends Genet 25 (11) 489–494. - PubMed
-
- Prasad P, et al. (2012) Caucasian and Asian specific rheumatoid arthritis risk loci reveal limited replication and apparent allelic heterogeneity in north Indians. PLoS ONE 7 (2) e31584 doi:10.1371/journal.pone.0031584 - DOI - PMC - PubMed
Publication types
MeSH terms
Substances
Grants and funding
- M01-RR00425/RR/NCRR NIH HHS/United States
- U01 HL041654/HL/NHLBI NIH HHS/United States
- N01 HC048049/HL/NHLBI NIH HHS/United States
- N01 HC055020/HL/NHLBI NIH HHS/United States
- HHSN268201200036C/HL/NHLBI NIH HHS/United States
- N01 HC095095/HL/NHLBI NIH HHS/United States
- N01-HC-45205/HC/NHLBI NIH HHS/United States
- N01 HC055016/HL/NHLBI NIH HHS/United States
- U01 HL041642/HL/NHLBI NIH HHS/United States
- N01-HC-05187/HC/NHLBI NIH HHS/United States
- U01CA98758/CA/NCI NIH HHS/United States
- U01 HL65520/HL/NHLBI NIH HHS/United States
- N01WH42129-32/WH/WHI NIH HHS/United States
- N01 HC055019/HL/NHLBI NIH HHS/United States
- N01 HC048048/HL/NHLBI NIH HHS/United States
- N01-HV-48195/HV/NHLBI NIH HHS/United States
- R01 AG015928/AG/NIA NIH HHS/United States
- U01 HL080295/HL/NHLBI NIH HHS/United States
- U01 HL65521/HL/NHLBI NIH HHS/United States
- U01 HG004790/HG/NHGRI NIH HHS/United States
- N01-HC-48047/HC/NHLBI NIH HHS/United States
- U01 HG007416/HG/NHGRI NIH HHS/United States
- U01 HL41642/HL/NHLBI NIH HHS/United States
- N01 HC055021/HL/NHLBI NIH HHS/United States
- N01-HC-55022/HC/NHLBI NIH HHS/United States
- U01 HG004802/HG/NHGRI NIH HHS/United States
- N01 HC015103/HC/NHLBI NIH HHS/United States
- N01 HC085086/HL/NHLBI NIH HHS/United States
- N01-HC-55016/HC/NHLBI NIH HHS/United States
- N01WH32100-2/WH/WHI NIH HHS/United States
- AG-15928/AG/NIA NIH HHS/United States
- R56 AG020098/AG/NIA NIH HHS/United States
- N01 WH022110/WH/WHI NIH HHS/United States
- U01CA136792/CA/NCI NIH HHS/United States
- N01WH32108-9/WH/WHI NIH HHS/United States
- N01 HC055015/HL/NHLBI NIH HHS/United States
- U01HG004803/HG/NHGRI NIH HHS/United States
- AG-20098/AG/NIA NIH HHS/United States
- N01-HC-95095/HC/NHLBI NIH HHS/United States
- N01-HC-55021/HC/NHLBI NIH HHS/United States
- U01 HL041652/HL/NHLBI NIH HHS/United States
- U01HG004802/HG/NHGRI NIH HHS/United States
- N01-HC-85086/HC/NHLBI NIH HHS/United States
- N01WH42107-26/WH/WHI NIH HHS/United States
- N01-HC-48050/HC/NHLBI NIH HHS/United States
- U01 HL41654/HL/NHLBI NIH HHS/United States
- N01 HC045205/HL/NHLBI NIH HHS/United States
- AG-027058/AG/NIA NIH HHS/United States
- P30 DK063491/DK/NIDDK NIH HHS/United States
- N01-HC-35129/HC/NHLBI NIH HHS/United States
- N01-HC-45134/HC/NHLBI NIH HHS/United States
- N01 HC-55222/HC/NHLBI NIH HHS/United States
- N01-HC-55019/HC/NHLBI NIH HHS/United States
- N01 HC055222/HL/NHLBI NIH HHS/United States
- N01WH32122/WH/WHI NIH HHS/United States
- U01 HG004803/HG/NHGRI NIH HHS/United States
- U01 HL41652/HL/NHLBI NIH HHS/United States
- N01-HC-55015/HC/NHLBI NIH HHS/United States
- P01 CA033619/CA/NCI NIH HHS/United States
- N01-HC-48049/HC/NHLBI NIH HHS/United States
- U01HG004798-01/HG/NHGRI NIH HHS/United States
- N01-HC-75150/HC/NHLBI NIH HHS/United States
- N01 HC045134/HC/NHLBI NIH HHS/United States
- N01-HC-55020/HC/NHLBI NIH HHS/United States
- N01 HC-15103/HC/NHLBI NIH HHS/United States
- N01 HC005187/HL/NHLBI NIH HHS/United States
- N01 HC085079/HL/NHLBI NIH HHS/United States
- R01 HL080295/HL/NHLBI NIH HHS/United States
- N01 HC048047/HL/NHLBI NIH HHS/United States
- N01WH32105-6/WH/WHI NIH HHS/United States
- N01 HV048195/HL/NHLBI NIH HHS/United States
- N01 HC055018/HL/NHLBI NIH HHS/United States
- M01 RR000425/RR/NCRR NIH HHS/United States
- N01WH32111-13/WH/WHI NIH HHS/United States
- R01 AG020098/AG/NIA NIH HHS/United States
- N01WH32118-32119/WH/WHI NIH HHS/United States
- R37CA54281/CA/NCI NIH HHS/United States
- N01 HC048050/HL/NHLBI NIH HHS/United States
- U01 CA098758/CA/NCI NIH HHS/United States
- U01 HL065521/HL/NHLBI NIH HHS/United States
- DK063491/DK/NIDDK NIH HHS/United States
- N01-HC-45133/HC/NHLBI NIH HHS/United States
- N01-HC-85079/HC/NHLBI NIH HHS/United States
- N01 HC055022/HL/NHLBI NIH HHS/United States
- U01HG004790/HG/NHGRI NIH HHS/United States
- U01 HG004798/HG/NHGRI NIH HHS/United States
- HL080295/HL/NHLBI NIH HHS/United States
- U01HG004801-01/HG/NHGRI NIH HHS/United States
- N01-HC-85239/HC/NHLBI NIH HHS/United States
- N01-HC-48048/HC/NHLBI NIH HHS/United States
- AG-023629/AG/NIA NIH HHS/United States
- N01 HC075150/HL/NHLBI NIH HHS/United States
- N01-HC-55018/HC/NHLBI NIH HHS/United States
- R01 AG023629/AG/NIA NIH HHS/United States
- R01 AG027058/AG/NIA NIH HHS/United States
- N01 HC045133/HC/NHLBI NIH HHS/United States
- U01 CA136792/CA/NCI NIH HHS/United States
- N01WH32115/WH/WHI NIH HHS/United States
- P30 CA071789/CA/NCI NIH HHS/United States
- R37 CA054281/CA/NCI NIH HHS/United States
- N01WH44221/WH/WHI NIH HHS/United States
- N01 HC035129/HC/NHLBI NIH HHS/United States
- R56 AG023629/AG/NIA NIH HHS/United States
- U01 HL065520/HL/NHLBI NIH HHS/United States
- P01CA33619/CA/NCI NIH HHS/United States
- N01WH24152/WH/WHI NIH HHS/United States
- U01 HG004801/HG/NHGRI NIH HHS/United States
LinkOut - more resources
Full Text Sources
Other Literature Sources
Molecular Biology Databases
Research Materials
