

Physician emigration from sub-Saharan Africa to the United States: analysis of the 2011 AMA physician masterfile
- PMID: 24068894
- PMCID: PMC3775724
- DOI: 10.1371/journal.pmed.1001513
Physician emigration from sub-Saharan Africa to the United States: analysis of the 2011 AMA physician masterfile
Erratum in
- PLoS Med. 2013 Dec;10(12). doi:10.1371/annotation/64ffd514-00bb-4a5e-9e2e-584763637d14
Abstract
Background: The large-scale emigration of physicians from sub-Saharan Africa (SSA) to high-income nations is a serious development concern. Our objective was to determine current emigration trends of SSA physicians found in the physician workforce of the United States.
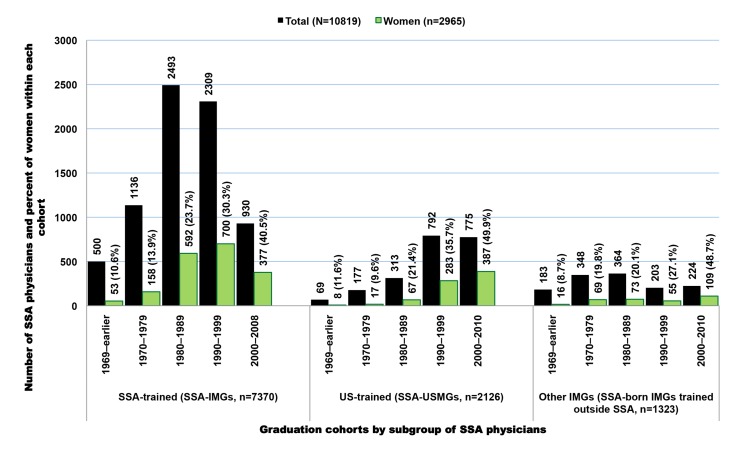
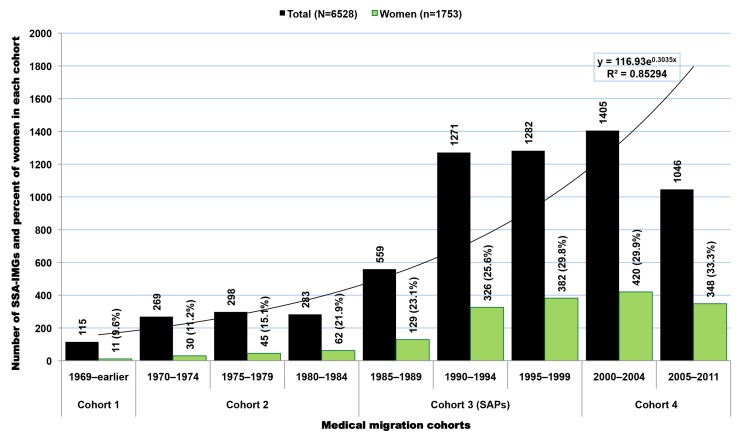
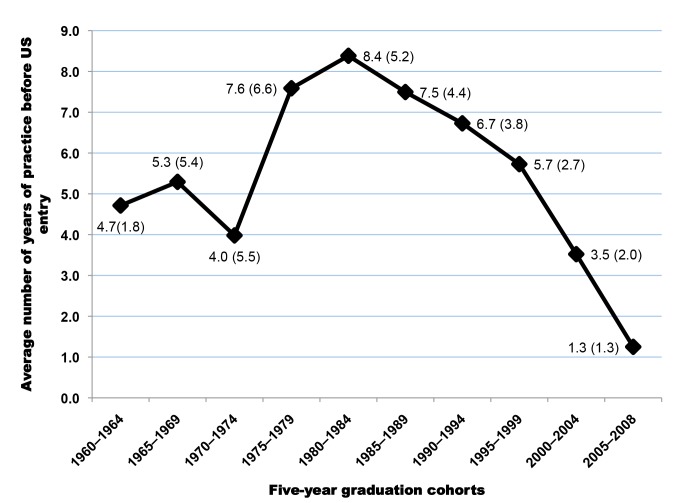
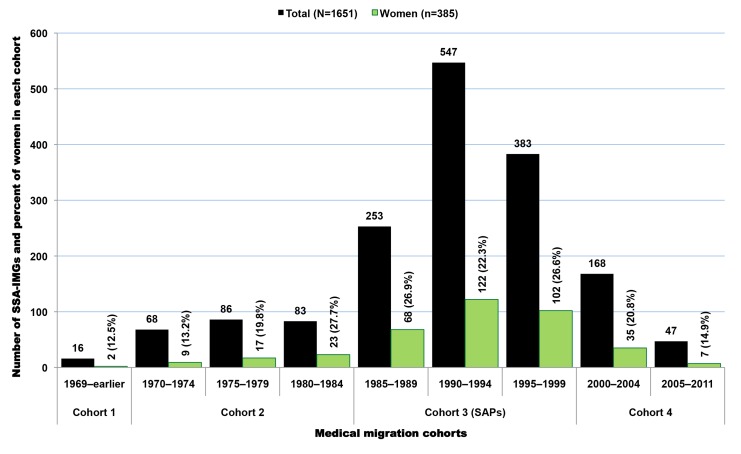
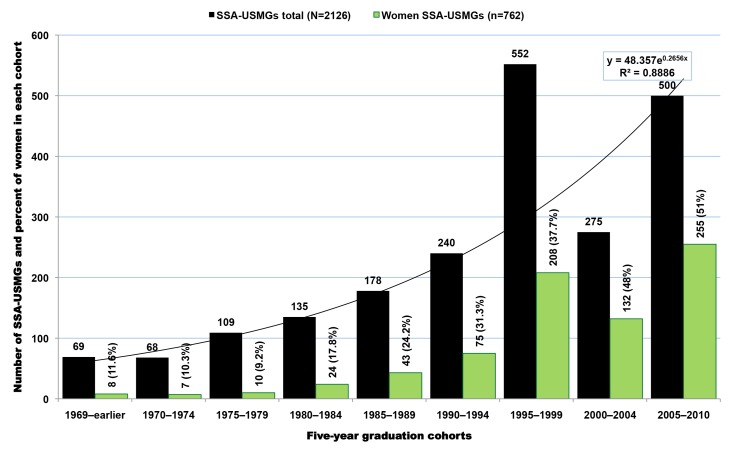
Methods and findings: We analyzed physician data from the World Health Organization (WHO) Global Health Workforce Statistics along with graduation and residency data from the 2011 American Medical Association Physician Masterfile (AMA-PM) on physicians trained or born in SSA countries who currently practice in the US. We estimated emigration proportions, year of US entry, years of practice before emigration, and length of time in the US. According to the 2011 AMA-PM, 10,819 physicians were born or trained in 28 SSA countries. Sixty-eight percent (n = 7,370) were SSA-trained, 20% (n = 2,126) were US-trained, and 12% (n = 1,323) were trained outside both SSA and the US. We estimated active physicians (age ≤ 70 years) to represent 96% (n = 10,377) of the total. Migration trends among SSA-trained physicians increased from 2002 to 2011 for all but one principal source country; the exception was South Africa whose physician migration to the US decreased by 8% (-156). The increase in last-decade migration was >50% in Nigeria (+1,113) and Ghana (+243), >100% in Ethiopia (+274), and >200% (+244) in Sudan. Liberia was the most affected by migration to the US with 77% (n = 175) of its estimated physicians in the 2011 AMA-PM. On average, SSA-trained physicians have been in the US for 18 years. They practiced for 6.5 years before US entry, and nearly half emigrated during the implementation years (1984-1999) of the structural adjustment programs.
Conclusion: Physician emigration from SSA to the US is increasing for most SSA source countries. Unless far-reaching policies are implemented by the US and SSA countries, the current emigration trends will persist, and the US will remain a leading destination for SSA physicians emigrating from the continent of greatest need. Please see later in the article for the Editors' Summary.
Conflict of interest statement
We have read the journal's policy and have the following conflict: SV is a current academic editor of
Figures
Comment in
-
Health workforce brain drain: from denouncing the challenge to solving the problem.PLoS Med. 2013;10(9):e1001514. doi: 10.1371/journal.pmed.1001514. Epub 2013 Sep 17. PLoS Med. 2013. PMID: 24068895 Free PMC article.
References
-
- World Health Organization (2003) The world health report 2003: shaping the future. Available: http://www.who.int/whr/2003/en/whr03_en.pdf. Accessed 14 February 2013.
-
- World Health Organization (2006) Working together for health: the world health report 2006. Available: http://whqlibdoc.who.int/publications/2006/9241563176_eng.pdf. Accessed 14 February 2013.
-
- World Health Organization (2010) The WHO global code of practice on the international recruitment of health personnel. Available: http://www.who.int/hrh/migration/code/code_en.pdf. Accessed 15 February 2013.
-
- Lee J-W (2006). Message from the Director-General. World Health Organization, editor. Working together for health: the world health report 2006. Geneva: World Health Organization. p. xiii.
-
- World Health Organization (2013) Global health workforce statistics. Available: http://www.who.int/hrh/statistics/hwfstats/en/ Accessed 30 July 2013.
Publication types
MeSH terms
LinkOut - more resources
Full Text Sources
Other Literature Sources
Research Materials
