. 2013;9(9):e1003184.
doi: 10.1371/journal.pcbi.1003184. Epub 2013 Sep 12.

Predicting odor perceptual similarity from odor structure

Affiliations

Predicting odor perceptual similarity from odor structure

Kobi Snitz et al. PLoS Comput Biol. 2013.

Abstract

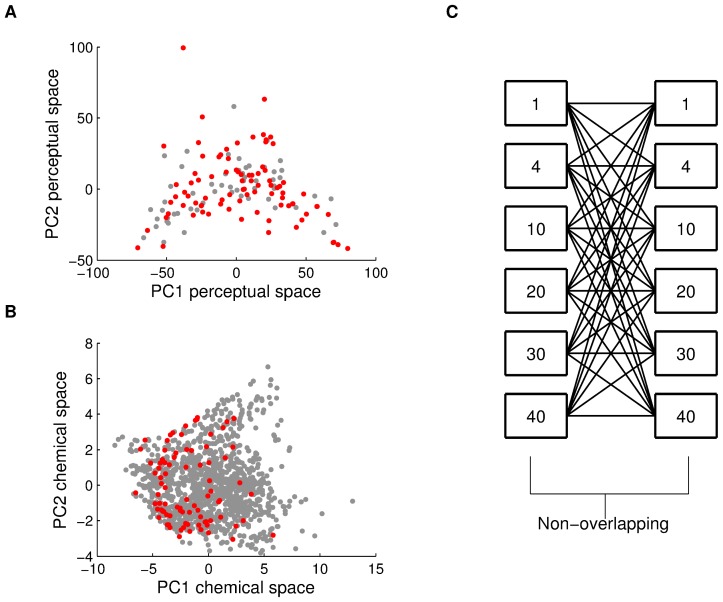
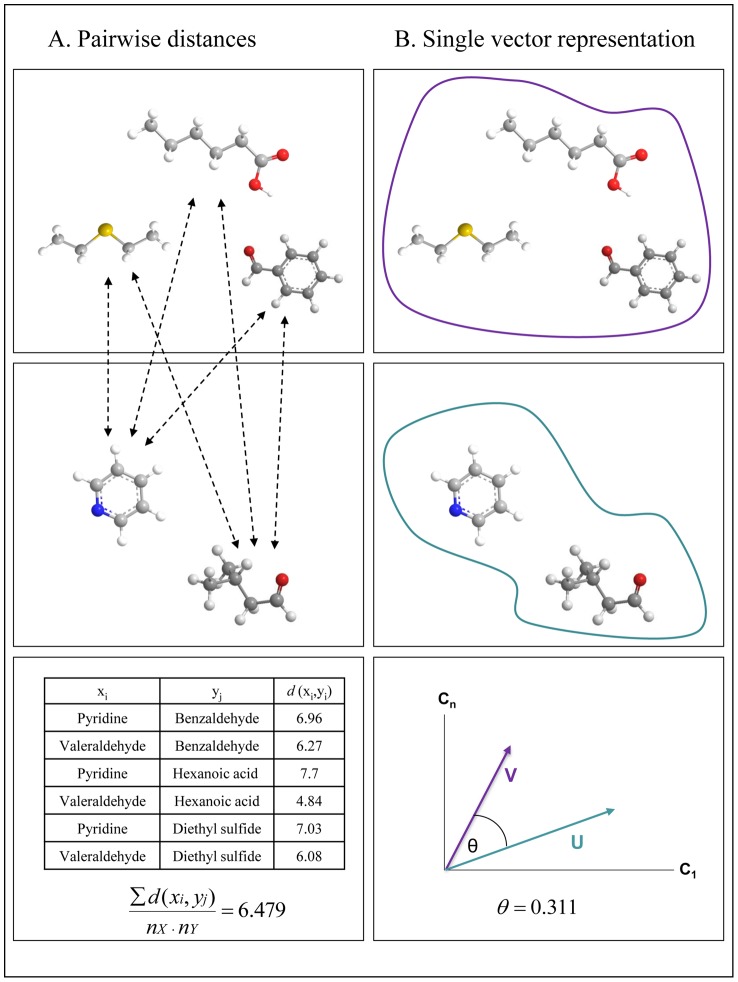
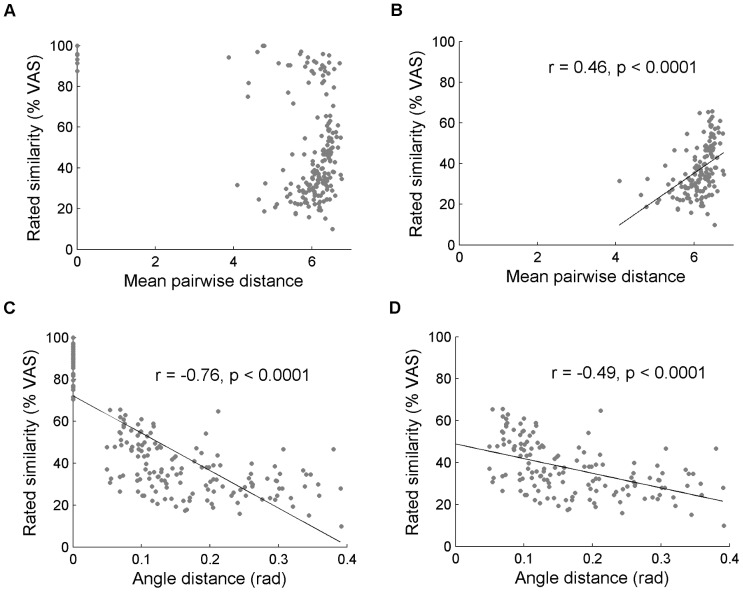
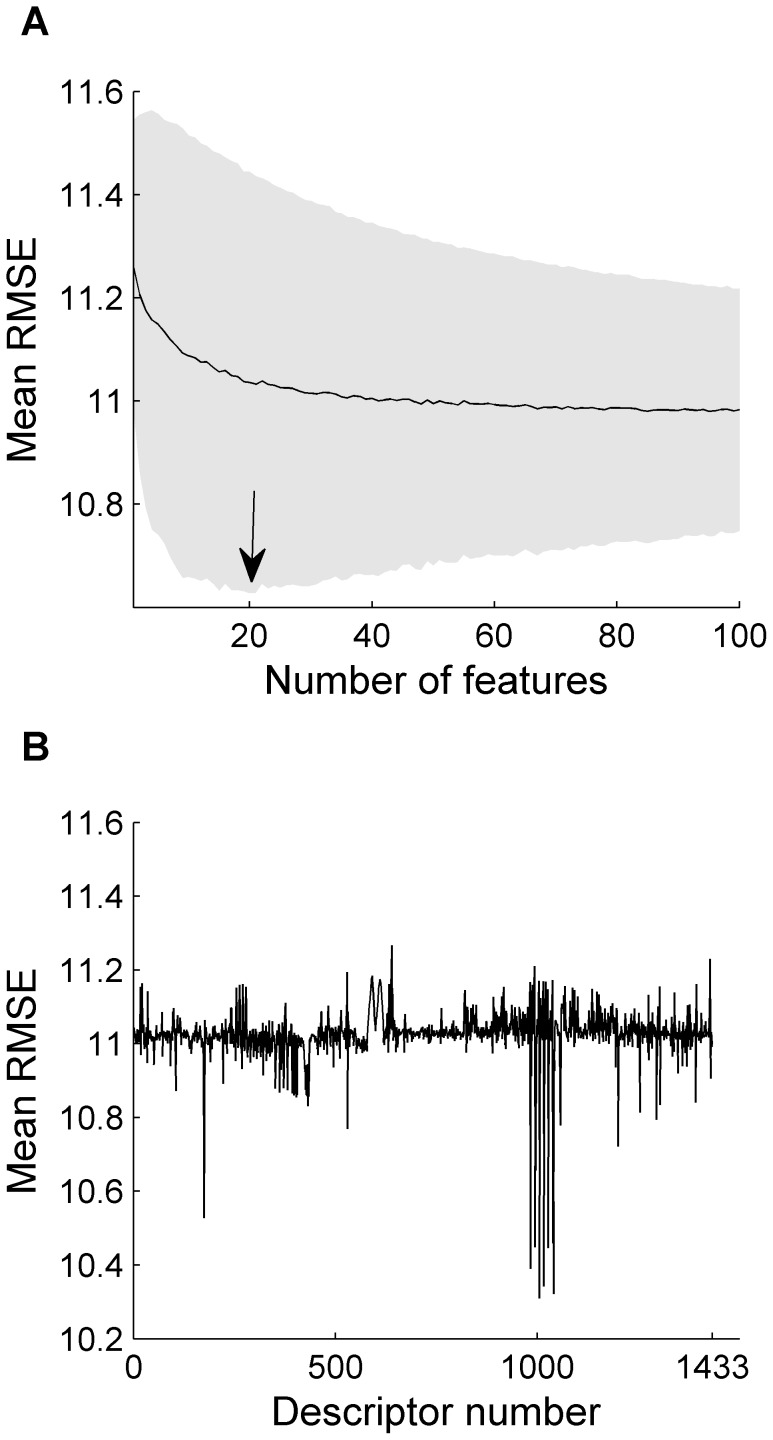
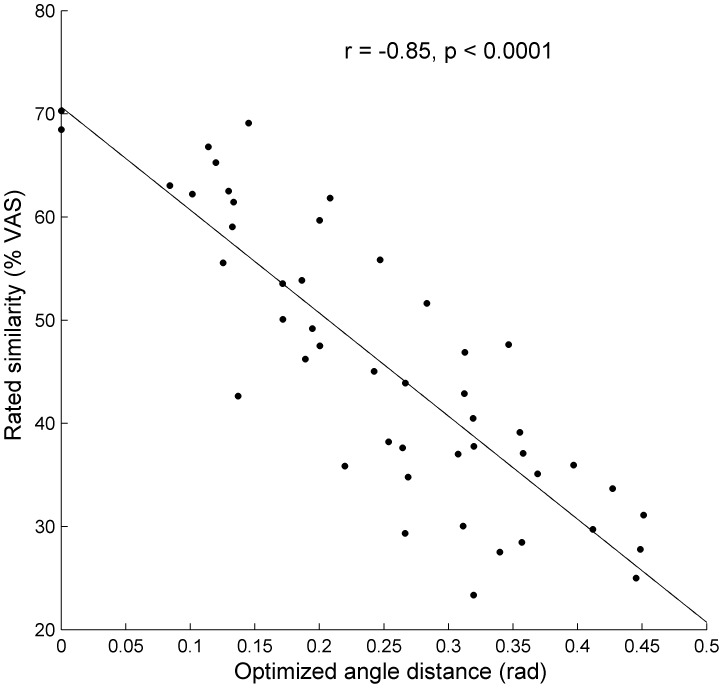
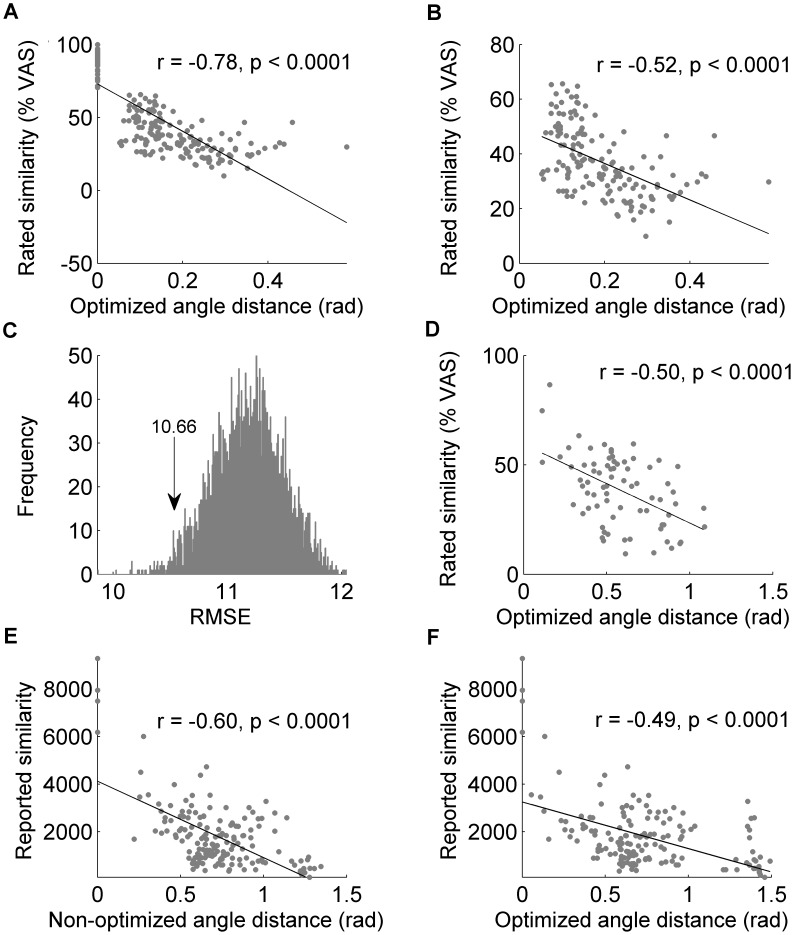
To understand the brain mechanisms of olfaction we must understand the rules that govern the link between odorant structure and odorant perception. Natural odors are in fact mixtures made of many molecules, and there is currently no method to look at the molecular structure of such odorant-mixtures and predict their smell. In three separate experiments, we asked 139 subjects to rate the pairwise perceptual similarity of 64 odorant-mixtures ranging in size from 4 to 43 mono-molecular components. We then tested alternative models to link odorant-mixture structure to odorant-mixture perceptual similarity. Whereas a model that considered each mono-molecular component of a mixture separately provided a poor prediction of mixture similarity, a model that represented the mixture as a single structural vector provided consistent correlations between predicted and actual perceptual similarity (r≥0.49, p<0.001). An optimized version of this model yielded a correlation of r = 0.85 (p<0.001) between predicted and actual mixture similarity. In other words, we developed an algorithm that can look at the molecular structure of two novel odorant-mixtures, and predict their ensuing perceptual similarity. That this goal was attained using a model that considers the mixtures as a single vector is consistent with a synthetic rather than analytical brain processing mechanism in olfaction.


Conflict of interest statement

The authors disclosed these findings to the Weizmann Institute Technology Licensing company (YEDA), and they have initiated application for patent on the described method and algorithm.

Figures

Figure 1
Figure 1. Odorant selection and comparison.
The odorants we used are plotted in red, presented within: (A) Perceptual space: 138 odorants commonly used in olfaction research, projected onto a two-dimensional space of PC1 (30.8% of the variance) and PC2 (12% of the variance) of perception. (B) Physicochemical space: 1358 odorants commonly modeled in olfaction research projected onto a two-dimensional space made of PC1 (37.7% of the variance) and PC2 (12.5% of the variance) of structure. (C) A schematic reflecting mixture comparisons in Dataset #1 in Table S2. Each mixture was compared to all other mixtures with zero overlap in component identity, and to itself. Note that this schematic reflects one quarter of the data, as we had eight versions of each mixture size.
Figure 2
Figure 2. Modeling odorant mixtures as singular objects rather than component amalgamations.
The top panels represent one mixture (Y) made of 3 mono-molecular components and the bottom panels represent a different mixture (X) made of 2 mono-molecular components. The distance between X and Y can be calculated as (A) The mean of all pairwise distances between all the components of X and Y. (B) Alternatively, one can represent both X and Y as single vectors reflecting the sum of their components, and define the distance between them as the angle between these two vectors within a physicochemical space of n dimensions.
Figure 3
Figure 3. Performance of the pairwise distance and angle distance models.
Each dot reflects a comparison between two odorant mixtures. (A) The pairwise distance model was not predictive of mixture similarity. (B) Removing comparisons of a mixture to itself, the pairwise distance model implies a non-logical point from which increases in structural similarity drive decreases in perceived similarity. (C) The angle distance model provides a strong prediction of perceived similarity. (D) The angle distance model continues to provide logical results after removing comparisons of mixtures to themselves.
Figure 4
Figure 4. Optimizing the angle distance model.
(A) Mean RMSE for varying number of features. Plotted in grey are the standard error values for each number of features. The lowest value was obtained at about 20. (B) Mean RMSE per descriptor. For each of the 1433 descriptors, the mean RMSE was calculated between the similarity ratings of mixture pairs and the angle distance model based on 2,000 selections of 25 random descriptors, one of which is the fixed descriptor in question. A score was given to each descriptor based on this mean RMSE for the next step.
Figure 5
Figure 5. Performance of the optimized angle distance model.
Each dot represents a comparison between two mixtures. The optimized model provided a strong prediction of mixture perceptual similarity from mixture structure alone.
Figure 6
Figure 6. Performance of the optimized angle distance model on independent data.
(A) Performance of the optimized model on complete Dataset #1 in Table S2. Each dot reflects a comparison between two mixtures. (B) The same as in panel A after omitting comparisons of mixtures to themselves. (C) RMSE histogram reflecting the performance of random selections of 21 descriptors. The optimized selection was at an RMSE of 10.66, which is better than 95.30% of the randomly selected sets. (D) Performance of the optimized angle distance model on mono-molecules (Dataset #3 in Table S2). (E) Performance of the angle distance model on mono-molecules tested 50 years ago independently by others . (F) Performance of the optimized angle distance model on the data in panel E. Each dot reflects a comparison between two mono-molecules.

References

    1. Bell A (1914) Discovery and Invention. National Geographic 649.
    1. Wise P, Olsson M, Cain W (2000) Quantification of odor quality. Chem Senses 25: 429–443. - PubMed
    1. Kaeppler K, Mueller F (2013) Odor classification: a review of factors influencing perception-based odor arrangements. Chem Senses 38: 189–209. - PubMed
    1. Amoore JE (1970) The molecular basis of odor. Springfield: Charles C Thomas.
    1. Amoore JE (1977) Specific anosmia and the concept of primary odors. Chemical Senses and Flavor 2: 267–281.

Publication types