

Computational optogenetics: empirically-derived voltage- and light-sensitive channelrhodopsin-2 model
- PMID: 24068903
- PMCID: PMC3772068
- DOI: 10.1371/journal.pcbi.1003220
Computational optogenetics: empirically-derived voltage- and light-sensitive channelrhodopsin-2 model
Abstract
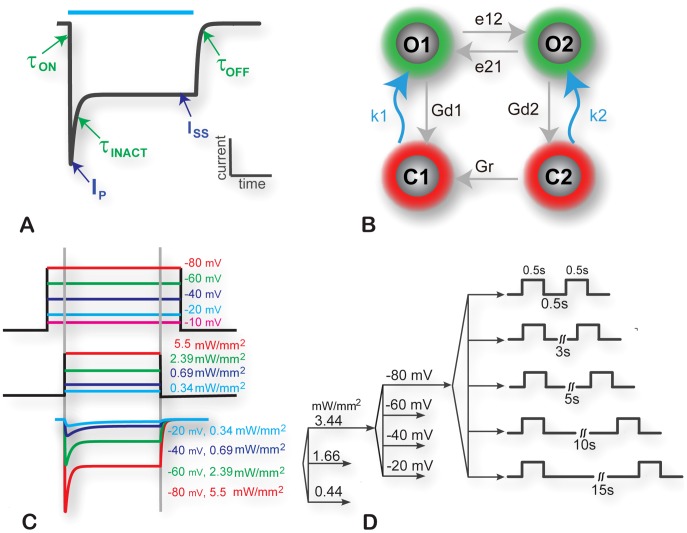
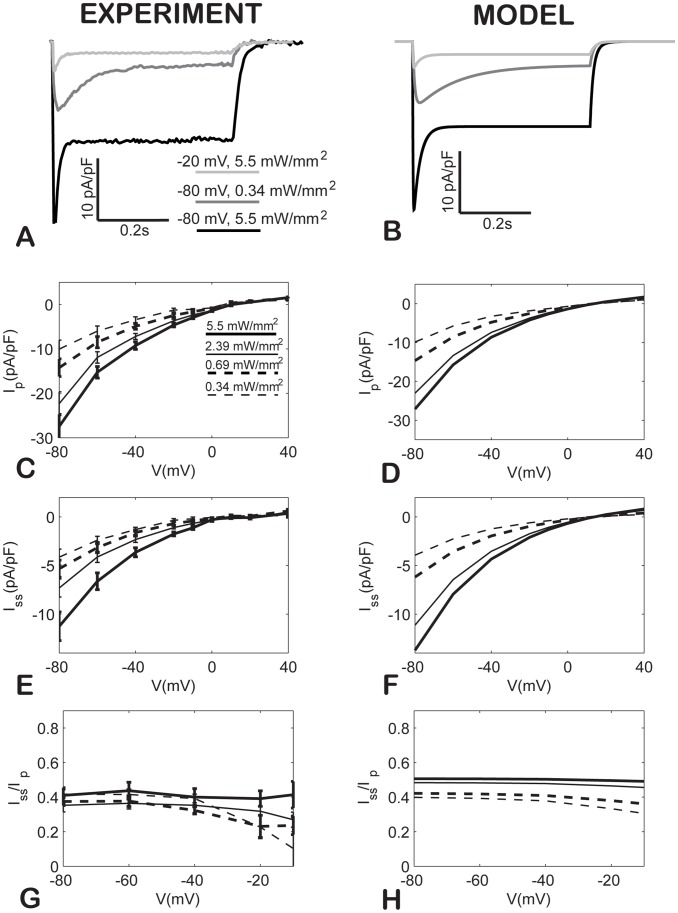
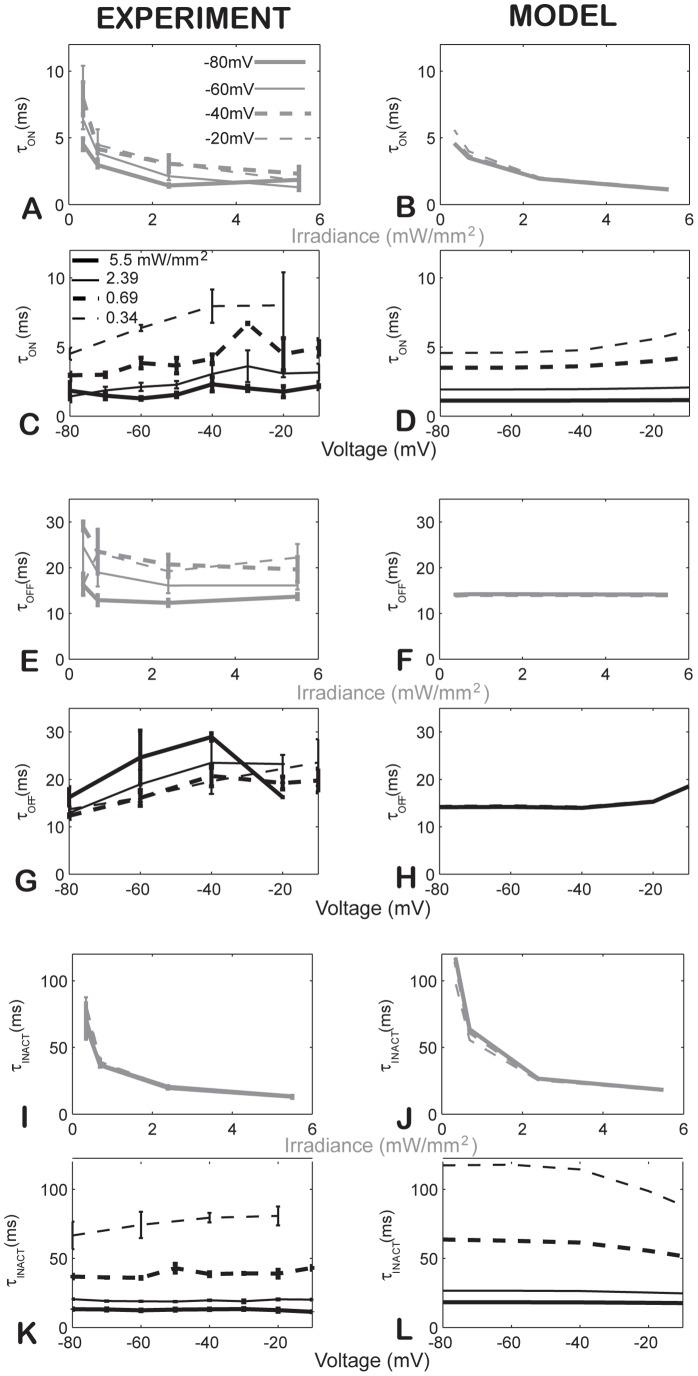
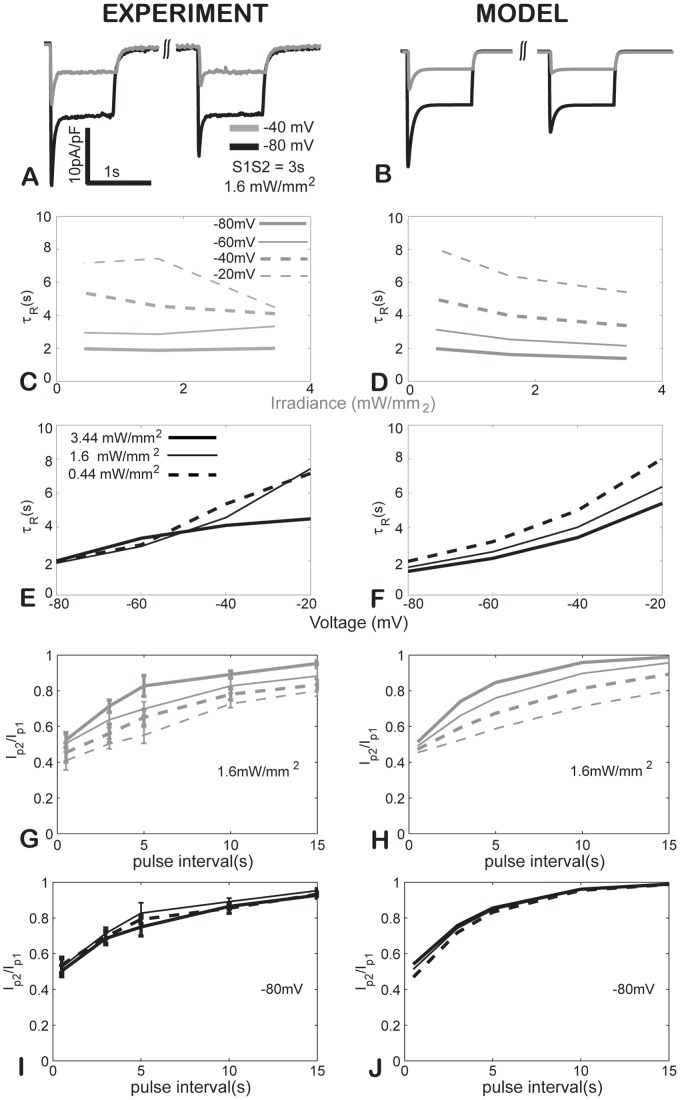
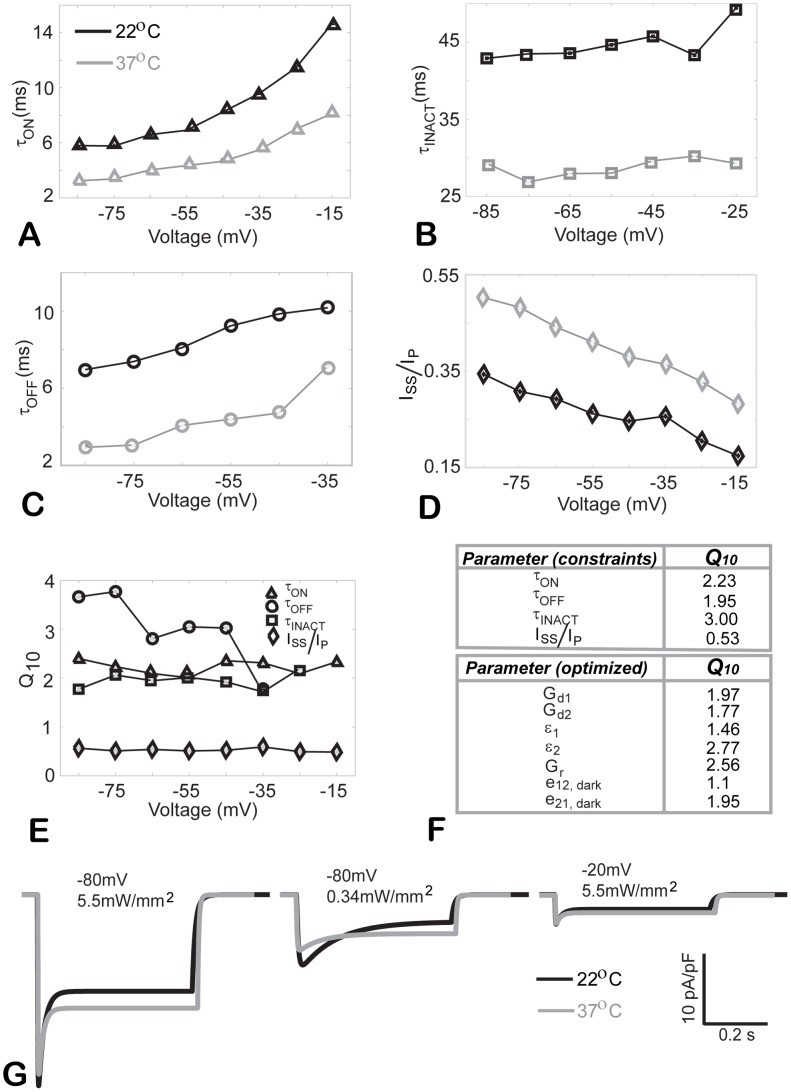
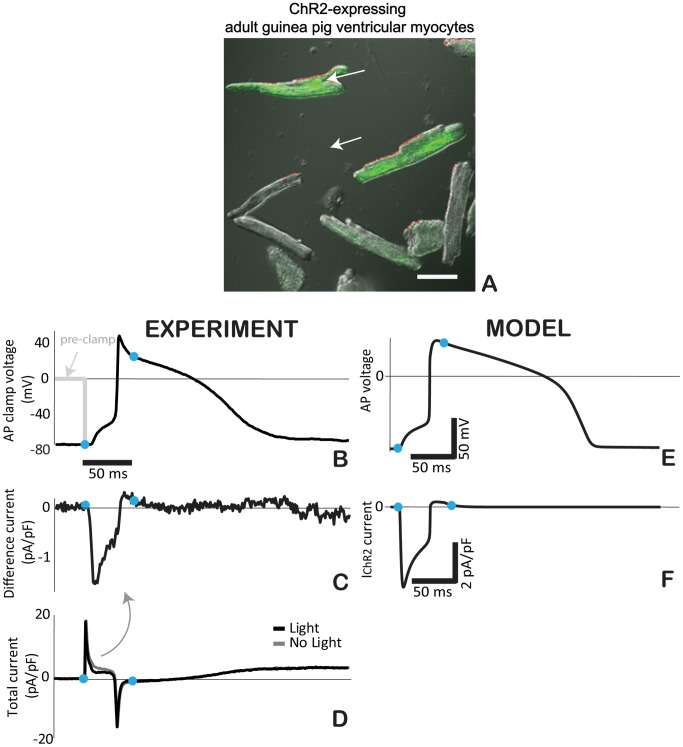
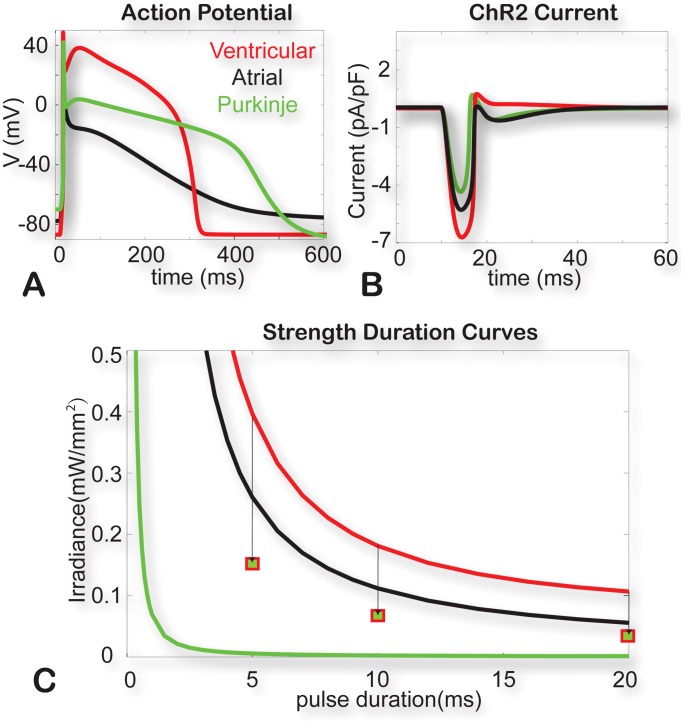
Channelrhodospin-2 (ChR2), a light-sensitive ion channel, and its variants have emerged as new excitatory optogenetic tools not only in neuroscience, but also in other areas, including cardiac electrophysiology. An accurate quantitative model of ChR2 is necessary for in silico prediction of the response to optical stimulation in realistic tissue/organ settings. Such a model can guide the rational design of new ion channel functionality tailored to different cell types/tissues. Focusing on one of the most widely used ChR2 mutants (H134R) with enhanced current, we collected a comprehensive experimental data set of the response of this ion channel to different irradiances and voltages, and used these data to develop a model of ChR2 with empirically-derived voltage- and irradiance- dependence, where parameters were fine-tuned via simulated annealing optimization. This ChR2 model offers: 1) accurate inward rectification in the current-voltage response across irradiances; 2) empirically-derived voltage- and light-dependent kinetics (activation, deactivation and recovery from inactivation); and 3) accurate amplitude and morphology of the response across voltage and irradiance settings. Temperature-scaling factors (Q10) were derived and model kinetics was adjusted to physiological temperatures. Using optical action potential clamp, we experimentally validated model-predicted ChR2 behavior in guinea pig ventricular myocytes. The model was then incorporated in a variety of cardiac myocytes, including human ventricular, atrial and Purkinje cell models. We demonstrate the ability of ChR2 to trigger action potentials in human cardiomyocytes at relatively low light levels, as well as the differential response of these cells to light, with the Purkinje cells being most easily excitable and ventricular cells requiring the highest irradiance at all pulse durations. This new experimentally-validated ChR2 model will facilitate virtual experimentation in neural and cardiac optogenetics at the cell and organ level and provide guidance for the development of in vivo tools.
Conflict of interest statement
The authors have declared that no competing interests exist.
Figures
Similar articles
-
Optogenetic versus Electrical Stimulation of Human Cardiomyocytes: Modeling Insights.Biophys J. 2015 Apr 21;108(8):1934-45. doi: 10.1016/j.bpj.2015.03.032. Biophys J. 2015. PMID: 25902433 Free PMC article.
-
Opsin spectral sensitivity determines the effectiveness of optogenetic termination of ventricular fibrillation in the human heart: a simulation study.J Physiol. 2016 Dec 1;594(23):6879-6891. doi: 10.1113/JP271739. Epub 2016 Apr 24. J Physiol. 2016. PMID: 26941055 Free PMC article.
-
Channelrhodopsin2 current during the action potential: "optical AP clamp" and approximation.Sci Rep. 2014 Jul 25;4:5838. doi: 10.1038/srep05838. Sci Rep. 2014. PMID: 25060859 Free PMC article.
-
Optogenetics: Illuminating the Future of Hearing Restoration and Understanding Auditory Perception.Curr Gene Ther. 2024;24(3):208-216. doi: 10.2174/0115665232269742231213110937. Curr Gene Ther. 2024. PMID: 38676313 Review.
-
Principles of Optogenetic Methods and Their Application to Cardiac Experimental Systems.Front Physiol. 2019 Sep 11;10:1096. doi: 10.3389/fphys.2019.01096. eCollection 2019. Front Physiol. 2019. PMID: 31572204 Free PMC article. Review.
Cited by
-
Non-invasive red-light optogenetic control of Drosophila cardiac function.Commun Biol. 2020 Jun 29;3(1):336. doi: 10.1038/s42003-020-1065-3. Commun Biol. 2020. PMID: 32601302 Free PMC article.
-
'Trapped re-entry' as source of acute focal atrial arrhythmias.Cardiovasc Res. 2024 Mar 14;120(3):249-261. doi: 10.1093/cvr/cvad179. Cardiovasc Res. 2024. PMID: 38048392 Free PMC article.
-
Toward microendoscopy-inspired cardiac optogenetics in vivo: technical overview and perspective.J Biomed Opt. 2014 Aug;19(8):080701. doi: 10.1117/1.JBO.19.8.080701. J Biomed Opt. 2014. PMID: 25117076 Free PMC article. Review.
-
A high-conductance chemo-optogenetic system based on the vertebrate channel Trpa1b.Sci Rep. 2017 Sep 19;7(1):11839. doi: 10.1038/s41598-017-11791-z. Sci Rep. 2017. PMID: 28928472 Free PMC article.
-
Measurement of phase resetting curves using optogenetic barrage stimuli.J Neurosci Methods. 2017 Sep 1;289:23-30. doi: 10.1016/j.jneumeth.2017.06.018. Epub 2017 Jun 28. J Neurosci Methods. 2017. PMID: 28668267 Free PMC article.
References
-
- Noble D (2002) Modeling the heart–from genes to cells to the whole organ. Science 295: 1678–1682. - PubMed
-
- Kleber AG, Rudy Y (2004) Basic mechanisms of cardiac impulse propagation and associated arrhythmias. Physiol Rev 84: 431–488. - PubMed
-
- Boyden ES, Zhang F, Bamberg E, Nagel G, Deisseroth K (2005) Millisecond-timescale, genetically targeted optical control of neural activity. Nat Neurosci 8: 1263–1268. - PubMed
Publication types
MeSH terms
Substances
Grants and funding
LinkOut - more resources
Full Text Sources
Other Literature Sources
Molecular Biology Databases
Research Materials
