Comparative Study
. 2013;9(9):e1003225.
doi: 10.1371/journal.pcbi.1003225. Epub 2013 Sep 12.

Trial-type dependent frames of reference for value comparison

Affiliations
Comparative Study

Trial-type dependent frames of reference for value comparison

Laurence T Hunt et al. PLoS Comput Biol. 2013.

Abstract

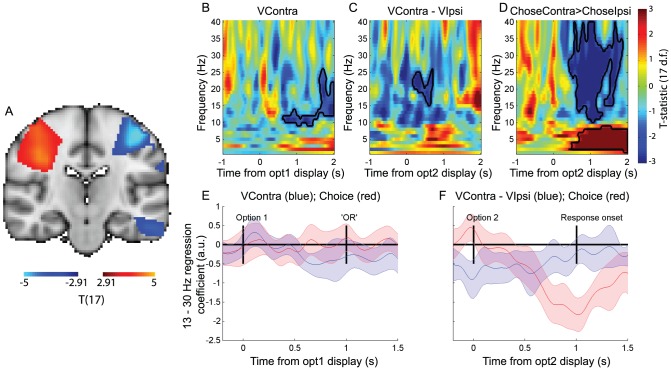
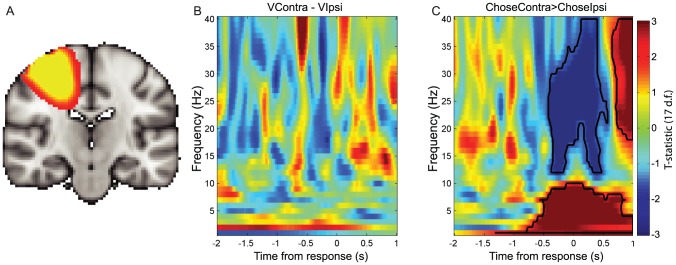
A central question in cognitive neuroscience regards the means by which options are compared and decisions are resolved during value-guided choice. It is clear that several component processes are needed; these include identifying options, a value-based comparison, and implementation of actions to execute the decision. What is less clear is the temporal precedence and functional organisation of these component processes in the brain. Competing models of decision making have proposed that value comparison may occur in the space of alternative actions, or in the space of abstract goods. We hypothesized that the signals observed might in fact depend upon the framing of the decision. We recorded magnetoencephalographic data from humans performing value-guided choices in which two closely related trial types were interleaved. In the first trial type, each option was revealed separately, potentially causing subjects to estimate each action's value as it was revealed and perform comparison in action-space. In the second trial type, both options were presented simultaneously, potentially leading to comparison in abstract goods-space prior to commitment to a specific action. Distinct activity patterns (in distinct brain regions) on the two trial types demonstrated that the observed frame of reference used for decision making indeed differed, despite the information presented being formally identical, between the two trial types. This provides a potential reconciliation of conflicting accounts of value-guided choice.


Conflict of interest statement

The authors have declared that no competing interests exist.

Figures

Figure 1
Figure 1. Experimental design and behavioural results.
(A) Experimental timeline. The experiment contained two types of trial in which subjects chose between two risky prospects associated with differing reward magnitudes (bar widths) and reward probabilities (percentages). In ‘comparison’ trials, both options were presented simultaneously and subjects were free to respond as soon as they had made their decision. In ‘sequential’ trials, options were presented one after the other and subjects were free to respond once a question-mark appeared in the centre of the screen. (B) Logistic regression weights (mean +/− s.e.m.) of explanatory variables on choice behaviour on comparison trials (left) and sequential trials (right). (C) Prospect theory utility function parameters on comparison trials (ordinate) and sequential trials (abscissa); each datapoint represents the fit for an individual subject. Line shows least-squares fit to data (correlations reported in main text). (D) As (C), for softmax function parameters. (E) As (C), for probability weighting function parameters.
Figure 2
Figure 2. Motor cortex beta desynchronisation represents progression from value representation to choice on ‘sequential’ trials.
(A) Statistical parametric map for contrast of beta band (13–30 Hz) activity for right buttonpresses>left buttonpresses, 500 ms–1000 ms after option 2 presentation (thresholded at T(17)>2.91, p<0.005 uncorrected, for display purposes). Warm colors reflect decreased beta desynchronisation in right hemisphere (ipsilateral to movement), cool colors reflect increased beta desynchronisation in left hemisphere (contralateral to movement). (B) Correlates of the value of option 1 at time of option 1 presentation, in hemisphere contralateral to option presentation. Color represents T-statistic; bordered areas reflect significant clusters (cluster-corrected p<0.05; permutation test). (C) Correlates of the value difference between the options contralateral and ipsilateral to the hemisphere, at the time of option 2 presentation. (D) Contrast of trials on which the chosen option is contralateral vs. ipsilateral to the hemisphere, at the time of option 2 presentation. (E) Timecourse of beta band correlates of value of contralateral option (blue and choice (red) at time of option 1 presentation. Lines represent mean +/− 95% confidence intervals across subjects. (Note that as 95% confidence intervals are plotted, rather than standard error of the mean (s.e.m.), error bars are ∼1.96 times wider than when plotting s.e.m.). (F) Timecourse of beta band correlates of value difference (blue) and choice (red) between options contralateral vs. ipsilateral to the hemisphere at time of option 2 presentation.
Figure 3
Figure 3. Relative latency of ‘action value difference’ and ‘choice’ effects (both in motor cortex beta desynchronisation) after stimulus 2 presentation on ‘sequential’ trials.
(A) Comparison of the latency of the peak correlate of ‘value difference’ regressor in motor cortex beta desynchronisation (blue) against the latency of the peak correlate of the ‘categorical choice’ regressor in motor cortex beta desynchronisation (red). * denotes p<0.05, paired T-test across 18 subjects. (B) Histogram of individual subjects' latency differences between ‘value difference’ peak latency and ‘categorical choice’ peak latency; red line denotes median latency across subjects.
Figure 4
Figure 4. Motor cortex beta band desynchronisation reflects choice, but not value, on ‘comparison’ trials.
(A) Statistical parametric map for contrast of beta band (13–30 Hz) activity for right buttonpresses>left buttonpresses, 500 ms–1000 ms after decision presentation (thresholded at T(17)>2.91, p<0.005 uncorrected, for display purposes). Warm colors reflect decreased beta desynchronisation in right hemisphere (ipsilateral to movement). (B) Correlates of value difference between the options contralateral and ipsilateral to the hemisphere, timelocked to the response. Color represents T-statistic; the absence of any bordered region reflects the absence of any significant clusters surviving multiple comparisons correction. (C) Contrast of trials on which chosen option was contralateral vs. ipsilateral to the hemisphere. Bordered areas reflect significant clusters (cluster-corrected P<0.05; permutation test).
Figure 5
Figure 5. Lateral premotor cortex, similar to primary motor cortex, shows ‘action-space’ value followed by choice signals during sequential trials (A–E), and choice signal but no value signal during comparison trials (F–G).
Parts A–E are equivalent to parts B–F of figure 2 . (A) Correlates of the value of option 1 at time of option 1 presentation, in hemisphere contralateral to option presentation. Color represents T-statistic; bordered areas reflect significant clusters (cluster-corrected P<0.05; permutation test). (B) Correlates of the value difference between the options contralateral and ipsilateral to the hemisphere, at the time of option 2 presentation. (C) Contrast of trials on which the chosen option is contralateral vs. ipsilateral to the hemisphere, at the time of option 2 presentation. (D) Timecourse of beta band correlates of value of contralateral option (blue and choice (red) at time of option 1 presentation. Lines represent mean +/− 95% confidence intervals across subjects. (Note that as 95% confidence intervals are plotted, rather than standard error of the mean (s.e.m.), error bars are ∼1.96 times wider than when plotting s.e.m.). (E) Timecourse of beta band correlates of value difference (blue) and choice (red) between options contralateral vs. ipsilateral to the hemisphere at time of option 2 presentation. Parts F–G are equivalent to parts B–C of figure 4 . (F) Correlates of value difference between the options contralateral and ipsilateral to the hemisphere, timelocked to the response. (G) Contrast of trials on which chosen option was contralateral vs. ipsilateral to the hemisphere.
Figure 6
Figure 6. Ventromedial prefrontal cortex (VMPFC) beta band synchronisation reflects value difference on harder ‘comparison’ trials, but not on ‘sequential’ trials.
(A) Correlates of the value difference between chosen and unchosen options, timelocked to the response, on harder comparison trials. Color represents T-statistic; bordered areas reflect significant clusters (cluster-corrected P<0.05; permutation test). (B) As (A), but for ‘nobrainer’ trials in which probability and magnitude advocated the same response. (C) Correlates of the value difference between chosen and unchosen options, timelocked to option 2 presentation, on harder sequential trials. (D) Separating the VMPFC beta band response on harder comparison trials reveals a positive correlate of the value of the chosen option (blue) and a negative correlate of the value of the unchosen option (red) prior to the response. Bars represent mean +/− 95% confidence intervals across subjects. (E) As (D), but for ‘nobrainer’ trials. (F) Separating the beta band response on harder sequential trials reveals no correlate of either chosen or unchosen value in VMPFC at the time of option 2 presentation.
Figure 7
Figure 7. Relative latency of ‘goods value difference’ effect (in VMPFC beta synchronisation) and ‘choice’ effect (in motor cortex beta desynchronisation), timelocked to response on ‘comparison’ trials.
(A) Comparison of the latency of the peak correlate of ‘value difference’ regressor in VMPFC beta synchronisation (blue) against the latency of the peak correlate of the ‘categorical choice’ regressor in motor cortex beta desynchronisation (red). * denotes p<0.05, paired T-test across 18 subjects. (B) Histogram of individual subjects' latency differences between ‘value difference’ peak latency and ‘categorical choice’ peak latency; red line denotes median latency across subjects.
Figure 8
Figure 8. Right posterior superior parietal lobule, identified in our previous study of reward-guided decision making , shows beta correlates of chosen-unchosen value on both ‘harder’ and ‘nobrainer’ comparison trials, but not on harder sequential trials.
Parts A–F are equivalent to parts A–F of figure 6 . (A) Correlates of the value difference between chosen and unchosen options, timelocked to the response, on harder comparison trials. Color represents T-statistic; bordered areas reflect significant clusters (cluster-corrected P<0.05; permutation test). (B) As (A), but for ‘nobrainer’ trials in which probability and magnitude advocated the same response. (C) Correlates of the value difference between chosen and unchosen options, timelocked to option 2 presentation, on harder sequential trials. (D) Separating the pSPL beta band response on harder comparison trials reveals a positive correlate of the value of the chosen option (blue) and a negative correlate of the value of the unchosen option (red) prior to the response. Bars represent mean +/− 95% confidence intervals across subjects. (E) As (D), but for ‘nobrainer’ trials. (F) Separating the beta band response on harder sequential trials reveals no correlate of either chosen or unchosen value in pSPL at the time of option 2 presentation.

References

    1. Rushworth MF, Kolling N, Sallet J, Mars RB (2012) Valuation and decision-making in frontal cortex: one or many serial or parallel systems? Curr Opin Neurobiol 22: 946–955. - PubMed
    1. Platt ML, Padoa-Schioppa C (2008) Neuronal representations of value. In: Glimcher P, Camerer C, Poldrack RA, Fehr E, editors. Neuroeconomics: decision making and the brain. San Diego, CA: Academic Press. pp. 439–460.
    1. Rangel A, Hare T (2010) Neural computations associated with goal-directed choice. Curr Opin Neurobiol 20: 262–270. - PubMed
    1. Cai X, Padoa-Schioppa C (2012) Neuronal encoding of subjective value in dorsal and ventral anterior cingulate cortex. J Neurosci 32: 3791–3808. - PMC - PubMed
    1. Hunt LT, Kolling N, Soltani A, Woolrich MW, Rushworth MF, et al. (2012) Mechanisms underlying cortical activity during value-guided choice. Nat Neurosci 15: 470–476. - PMC - PubMed

Publication types

LinkOut - more resources