. 2013;9(9):e1003226.
doi: 10.1371/journal.pcbi.1003226. Epub 2013 Sep 12.

Target inhibition networks: predicting selective combinations of druggable targets to block cancer survival pathways

Affiliations

Target inhibition networks: predicting selective combinations of druggable targets to block cancer survival pathways

Jing Tang et al. PLoS Comput Biol. 2013.

Abstract

A recent trend in drug development is to identify drug combinations or multi-target agents that effectively modify multiple nodes of disease-associated networks. Such polypharmacological effects may reduce the risk of emerging drug resistance by means of attacking the disease networks through synergistic and synthetic lethal interactions. However, due to the exponentially increasing number of potential drug and target combinations, systematic approaches are needed for prioritizing the most potent multi-target alternatives on a global network level. We took a functional systems pharmacology approach toward the identification of selective target combinations for specific cancer cells by combining large-scale screening data on drug treatment efficacies and drug-target binding affinities. Our model-based prediction approach, named TIMMA, takes advantage of the polypharmacological effects of drugs and infers combinatorial drug efficacies through system-level target inhibition networks. Case studies in MCF-7 and MDA-MB-231 breast cancer and BxPC-3 pancreatic cancer cells demonstrated how the target inhibition modeling allows systematic exploration of functional interactions between drugs and their targets to maximally inhibit multiple survival pathways in a given cancer type. The TIMMA prediction results were experimentally validated by means of systematic siRNA-mediated silencing of the selected targets and their pairwise combinations, showing increased ability to identify not only such druggable kinase targets that are essential for cancer survival either individually or in combination, but also synergistic interactions indicative of non-additive drug efficacies. These system-level analyses were enabled by a novel model construction method utilizing maximization and minimization rules, as well as a model selection algorithm based on sequential forward floating search. Compared with an existing computational solution, TIMMA showed both enhanced prediction accuracies in cross validation as well as significant reduction in computation times. Such cost-effective computational-experimental design strategies have the potential to greatly speed-up the drug testing efforts by prioritizing those interventions and interactions warranting further study in individual cancer cases.


Conflict of interest statement

The authors have declared that no competing interests exist.

Figures

Figure 1
Figure 1. TIMMA model construction and prediction pipeline, with an illustrative toy example case.
(A) The input data consist of the drug-target interaction profiles and the single-drug treatment efficacies. The targets that are inhibited by at least one drug in the given data matrix are considered as potential targets relevant for the survival of the particular cancer cell type. TIMMA first applies a model selection procedure to identify a panel of such targets that in combination explain the observed drug efficacies. (B) The identified subset of targets and the drug efficacy patterns in the given cancer type. In the next step, a model construction algorithm is applied on the reduced data matrix to predict the combinatorial efficacies of multiple target inhibitions. (C) The predicted efficacy matrix for the cancer cell-specific target set. (D) Based on the predicted efficacies, synergy scores are calculated for pairs of targets and the corresponding drug pairs. NA entries indicate those drug pairs that are non-identifiable by the model. (E) A visualization of the target inhibition network.
Figure 2
Figure 2. Prediction accuracy and drug promiscuity as a function of binding affinity threshold on simulated datasets.
(A) The relative improvement of the LOO prediction accuracy when comparing the TIMMA and PKIM models. The 95% confidence interval for the average percentage improvement relative to PKIM was derived empirically by repeating the data simulation 100 times. (B) The average number of targets per drug and its standard deviation interval when applying different cut-off formula image 
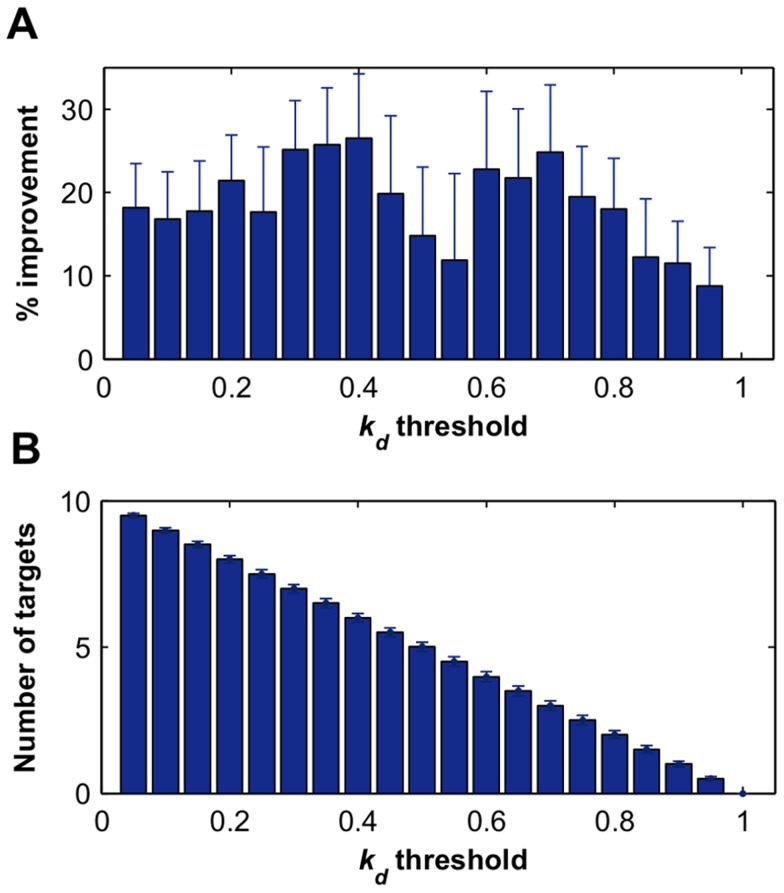
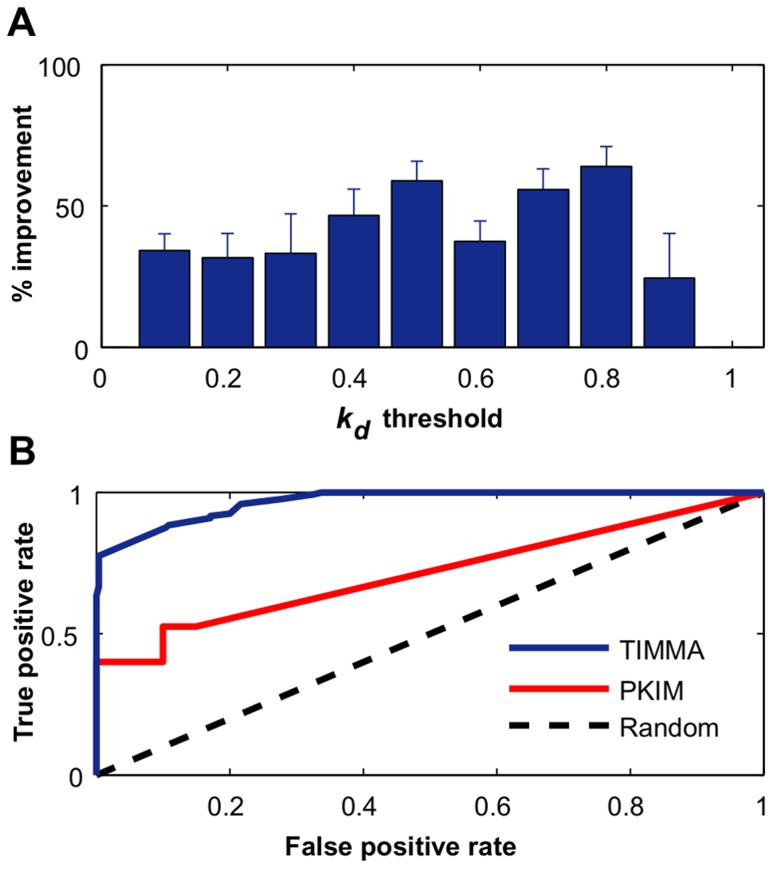
thresholds to binarize the simulated binding affinity data.
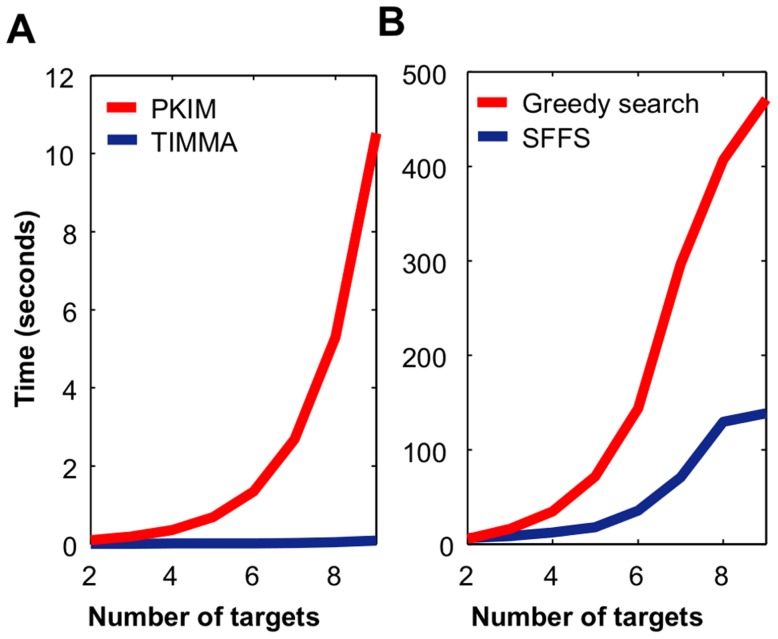
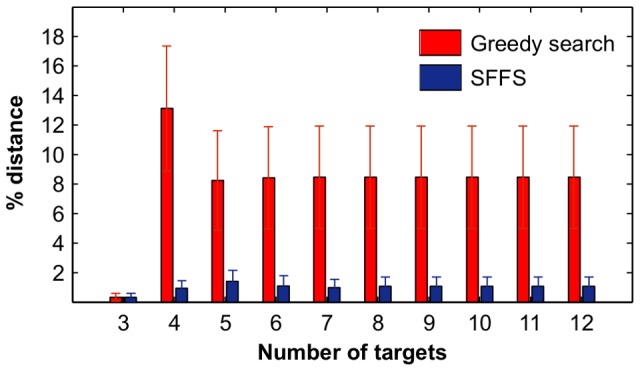
Figure 3
Figure 3. Computation times on simulated datasets with a varying number of targets.
(A) Running time of PKIM and TIMMA model construction algorithms given a target set that contains formula image targets, formula image. (B) Running time of the greedy search and the sequential forward floating search (SFFS) algorithms when reaching an optimal cancer-specific target set of size formula image.
Figure 4
Figure 4. Prediction accuracy of TIMMA and PKIM on the CanOS1224 data.
(A) Relative increase of average LOO prediction accuracy for TIMMA compared to PKIM. The drug-target data was binarized at various binding affinity thresholds, ranging from 0 to 1, with a step of 0.01. For each of the binarized drug-target data, the optimal cancer-cell specific target sets identified by TIMMA and PKIM were compared in terms of prediction accuracy. The 95% confidence interval for the relative increase was derived empirically using 50 random starting points in the model selection algorithms. (B) The receiver operating characteristic (ROC) curves for classifying sensitive drugs. Model predictions given the binarized drug-target data were pooled together for evaluation of the classification performance on the set of 36 drugs, where drugs with positive scaled IC50 efficacies are labeled as sensitive.
Figure 5
Figure 5. Optimality of the model search algorithms as compared to the global optima on the CanOS1224 data.
The optimality of a search algorithm was evaluated by the relative distance in average LOO prediction error between the algorithm solution and the global optimum determined by an exhaustive search. The 95% confidence intervals were derived based on a 100 times sampling of k kinases from the 317 kinases, k = 2,…,12.
Figure 6
Figure 6. Kinases selected by TIMMA on the MCF7 cancer cell line.
(A) Histogram of average siRNA Z-scores for a set of 12 kinases selected randomly, as compared to the average Z-score (0.926) for the TIMMA-selected optimal target set (marked on the right tail with its empirical p-value). (B) Scatter plot between the predicted treatment efficacy and the siRNA Z-score for the selected 12 kinases. The average Z-score (0.349) for the kinome-wide siRNA data is plotted as the dotted horizontal line.
Figure 7
Figure 7. The MCF-7 breast cancer target inhibition network annotated with drugs inhibiting its target nodes.
The target inhibition network was derived from the predicted efficacy matrix for the 12 kinase targets selected by TIMMA. Target pairs with predicted efficacy higher than 0.31 were considered as effective. Potential drug combinations can be inferred from the network by checking whether their targets are blocking the two parallel cancer survival pathways. Blue circle, target node; red square, available drugs that inhibit the target node; “/”, those targets that are inhibited by the same set of drugs and thus are indistinguishable by the model. The predicted efficacy matrix is provided in Dataset S5.
Figure 8
Figure 8. Kinase targets indicative of sensitizing BxPC-3 pancreatic cancer cells to Aurora kinase inhibitors.
The TIMMA model identified 19 kinases that, when combined with AURKB, showed higher synthetic lethality scores than using AURKB alone. Among these targets, PDGFRA and MET (marked with red arrows) were experimentally validated in the original work . Dashed line: the baseline synthetic lethality score when AURKB is combined with itself.
Figure 9
Figure 9. The MDA-MB-231 breast cancer target inhibition network annotated with inhibiting drugs.
Blue circles represent kinase target nodes. A target node may contain multiple kinases that are inhibited by the same set of drugs; in such cases, the kinase with the minimal binding affinity formula image 
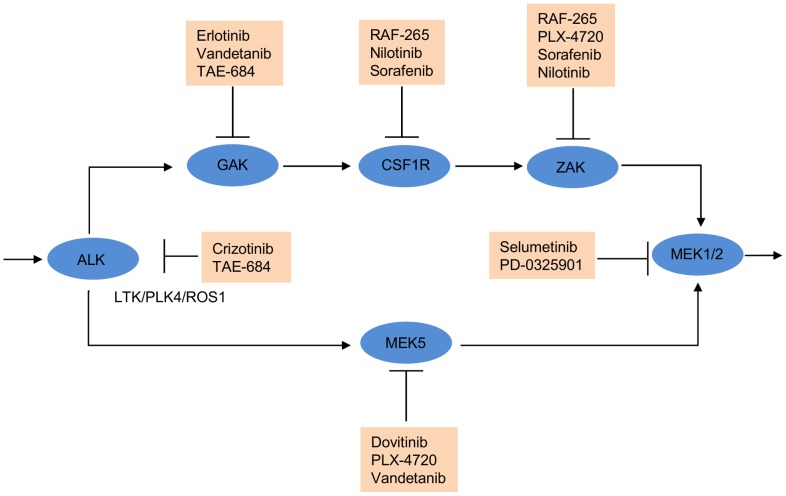
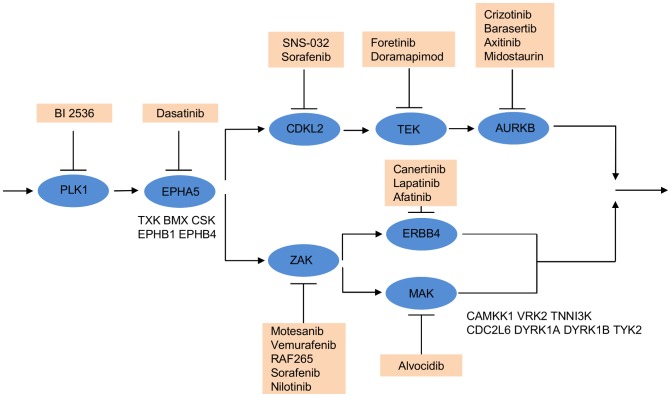
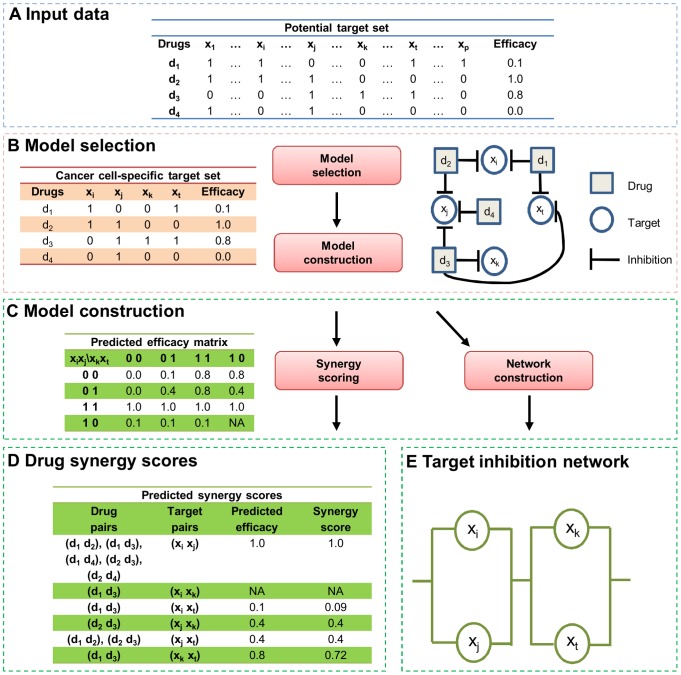
is shown inside the node, while the other equivalent kinase targets are shown beside the meta-target node. Red squares list available drugs that inhibit the corresponding target nodes. Data and detailed results are provided in Dataset S7.
Figure 10
Figure 10. Experimental validation of the model predictions on the MDA-MB-231 cell line.
(A) Distributions of cell growth inhibition percentages in single and pairwise siRNA screens targeting different groups of kinase targets. TIMMA identified eight target nodes, with a total of 20 kinase targets, the essentiality of which was evaluated both individually (n = 18) as well as in combination (n = 153) in the siRNA screens. Kinase target pairs with the predicted efficacy values higher or lower than the average (0.594) were further classified as high or low sensitivity groups, respectively. The kinome-wide single siRNA screen included a total of 704 kinases as a background reference distribution. (B) Scatterplot of synergy scores derived from the TIMMA model prediction versus synergy scores derived from the pairwise siRNA screen for a total of 68 drug pairs. A jitter function was applied for distinguishing the different drug pairs having the same synergy scores. The red dashed line indicates an empirical cut-off of predicted synergy score of 0.36 for the classification of highly synergistic drug pairs, for which the corresponding siRNA-measured synergy scores are higher than 37% (green dashed line). The blue curve is the logistic growth function fit formula image 
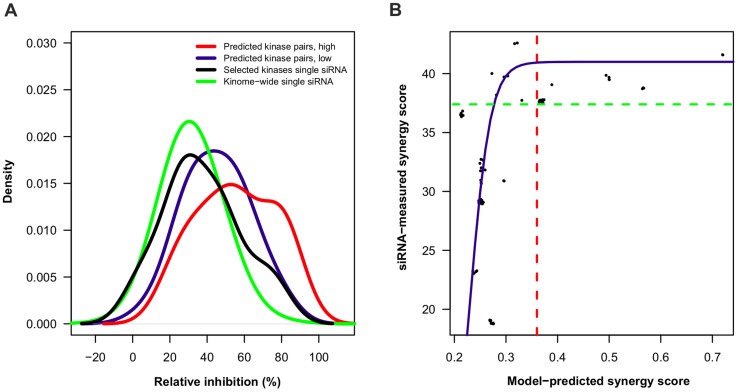
where a = 41, b = 0.23, c = 0.02.

Similar articles

Cited by

References

    1. Pammolli F, Magazzini L, Riccaboni M (2011) The productivity crisis in pharmaceutical R&D. Nature Reviews Drug Discovery 10: 428–438 doi:10.1038/nrd3405 - DOI - PubMed
    1. Hutchinson L, Kirk R (2011) High drug attrition rates—where are we going wrong? Nature Reviews Clinical Oncology 8: 189–190 doi:10.1038/nrclinonc.2011.34 - DOI - PubMed
    1. Hopkins AL (2008) Network pharmacology: the next paradigm in drug discovery. Nat Chem Biol 4: 682–690 doi:10.1038/nchembio.118 - DOI - PubMed
    1. Jia J, Zhu F, Ma X, Cao Z, Cao ZW, et al. (2009) Mechanisms of drug combinations: interaction and network perspectives. Nat Rev Drug Discov 8: 111–128 doi:10.1038/nrd2683 - DOI - PubMed
    1. Al-Lazikani B, Banerji U, Workman P (2012) Combinatorial drug therapy for cancer in the post-genomic era. Nat Biotechnol 30: 679–692 doi:10.1038/nbt.2284 - DOI - PubMed

Publication types

Substances