. 2013;9(9):e1003237.
doi: 10.1371/journal.pcbi.1003237. Epub 2013 Sep 19.

Network signatures of survival in glioblastoma multiforme

Affiliations

Network signatures of survival in glioblastoma multiforme

Vishal N Patel et al. PLoS Comput Biol. 2013.

Abstract

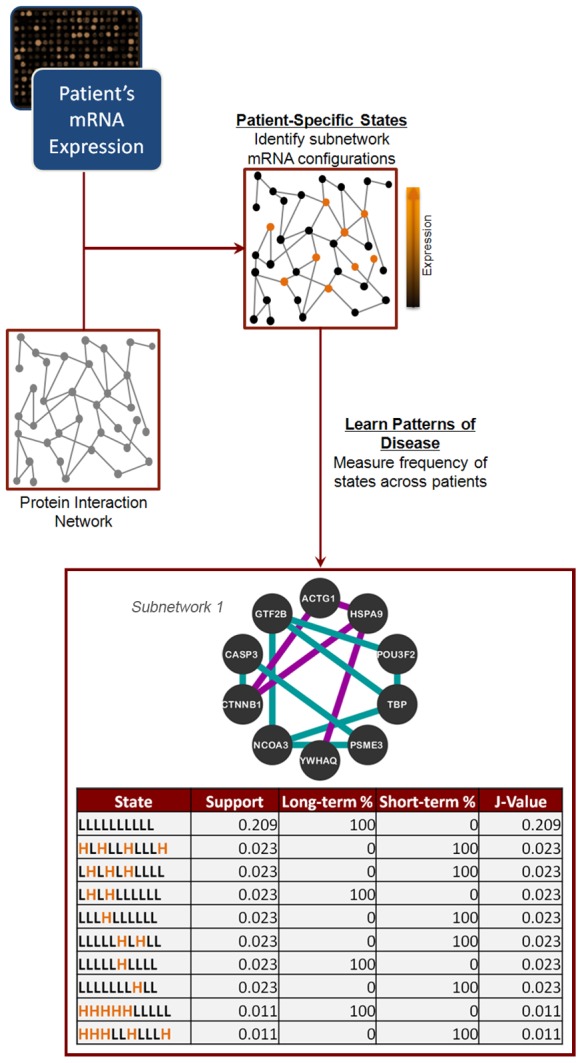
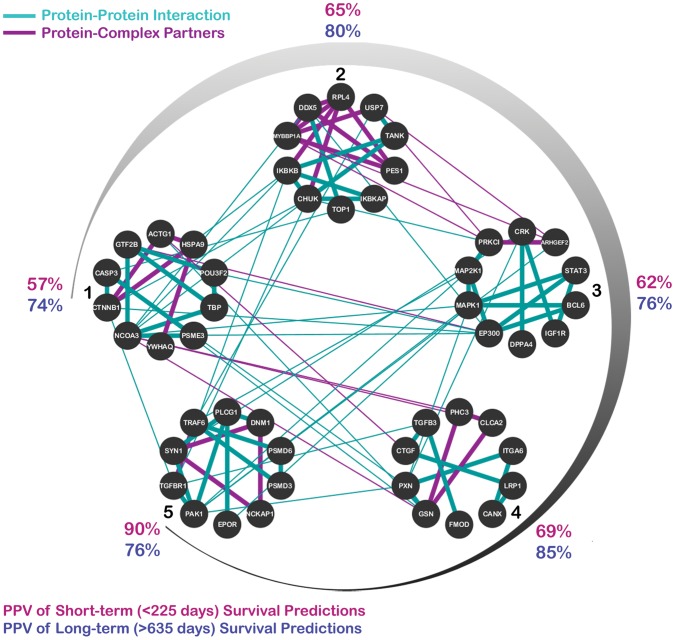
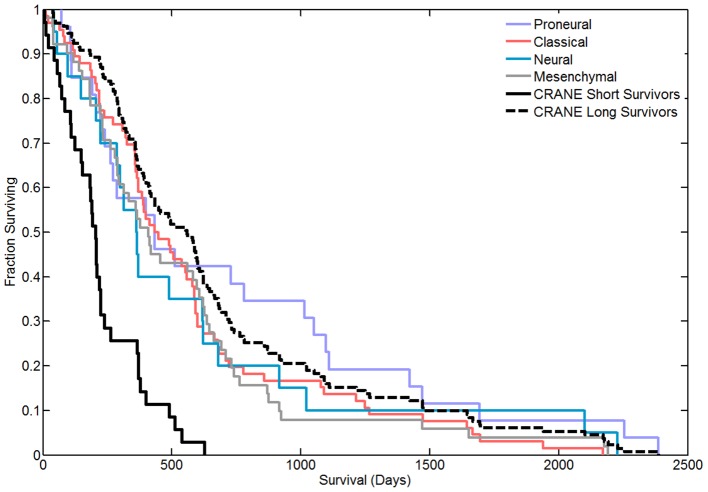
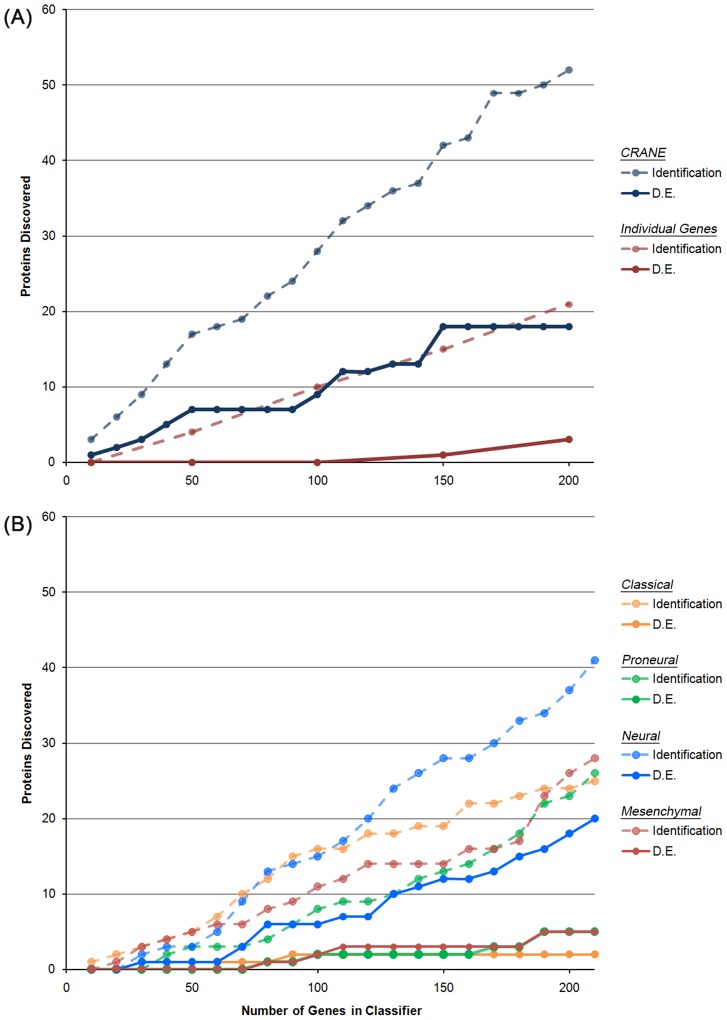
To determine a molecular basis for prognostic differences in glioblastoma multiforme (GBM), we employed a combinatorial network analysis framework to exhaustively search for molecular patterns in protein-protein interaction (PPI) networks. We identified a dysregulated molecular signature distinguishing short-term (survival<225 days) from long-term (survival>635 days) survivors of GBM using whole genome expression data from The Cancer Genome Atlas (TCGA). A 50-gene subnetwork signature achieved 80% prediction accuracy when tested against an independent gene expression dataset. Functional annotations for the subnetwork signature included "protein kinase cascade," "IκB kinase/NFκB cascade," and "regulation of programmed cell death" - all of which were not significant in signatures of existing subtypes. Finally, we used label-free proteomics to examine how our subnetwork signature predicted protein level expression differences in an independent GBM cohort of 16 patients. We found that the genes discovered using network biology had a higher probability of dysregulated protein expression than either genes exhibiting individual differential expression or genes derived from known GBM subtypes. In particular, the long-term survivor subtype was characterized by increased protein expression of DNM1 and MAPK1 and decreased expression of HSPA9, PSMD3, and CANX. Overall, we demonstrate that the combinatorial analysis of gene expression data constrained by PPIs outlines an approach for the discovery of robust and translatable molecular signatures in GBM.


Conflict of interest statement

MRC, SAC, and MK have competing interests in the software CRANE.

Figures

Figure 1
Figure 1. Workflow of the CRANE algorithm for detecting combinatorially dysregulated subnetworks.
We begin by mapping patient-specific, binarized mRNA expression data onto a protein interaction network. Then, we identify subnetworks whose pattern of expression – the subnetwork state function – can separate short-term and long-term survivors. Measures of separation are the support (the fraction of samples containing a particular subnetwork state), the fraction of long/short-term survivors, and the J-value (see text for description). In the table (bottom), the top ten states of the first TCGA subnetwork are shown. Each row represents a different state of the subnetwork. Each character in the state function (first column) represents the expression state of a particular gene in the subnetwork, where “L” and “H” stand for “low” and “high” expression, respectively.
Figure 2
Figure 2. The top five CRANE subnetworks representing a signature of survival in glioblastoma.
Gene names are indicated within the nodes; edges represent either protein-protein interactions (turquoise), or proteins found together as partners within a complex (violet). Subnetworks are added into the classifier in clockwise fashion (from 1 to 5); after the addition of each subnetwork, an updated positive predictive value (PPV) is calculated, as shown along the periphery for prediction of both short-term (pink) and long-term (purple) survival.
Figure 3
Figure 3. Survival curves comparing various classifiers when tested on the dataset of Lee et al.
(GEO ID: GSE13041). While the Verhaak subtypes – Proneural, Classical, Neural, and Mesenchymal – do not show statistically significant differences in survival, the top 5 CRANE subnetworks clearly distinguish short-term from long-term survivor groups.
Figure 4
Figure 4. Proteomic detection and dysregulation of biomarkers discovered using various pipelines.
(A) Comparison of the number of proteomic targets identified using a network-based algorithm for identifying combinatorial gene markers (“CRANE”) versus one using individual differentially expressed genes (“Individual Gene Markers”). (B) Comparison of the number of proteomic targets identified using the subtypes identified by Verhaak et al. We plot the total number of classifier targets detected in the proteomic experiment (“Identification”), as well as the subset of classifier genes showing evidence for differential expression (p-value≤0.05) at the protein level (“D.E.”).

References

    1. Li A, Walling J, Ahn S, Kotliarov Y, Su Q, et al. (2009) Unsupervised analysis of transcriptomic profiles reveals six glioma subtypes. Cancer Res 69: 2091–2099. - PMC - PubMed
    1. Rich JN, Hans C, Jones B, Iversen ES, McLendon RE, et al. (2005) Gene expression profiling and genetic markers in glioblastoma survival. Cancer Res 65: 4051–4058. - PubMed
    1. Ein-Dor L, Zuk O, Domany E (2006) Thousands of samples are needed to generate a robust gene list for predicting outcome in cancer. Proc Natl Acad Sci U S A 103: 5923–5928. - PMC - PubMed
    1. Zhang J, Liu B, Jiang X, Zhao H, Fan M, et al. (2009) A systems biology-based gene expression classifier of glioblastoma predicts survival with solid tumors. PLoS One 4: e6274. - PMC - PubMed
    1. Chowdhury SA, Nibbe RK, Chance MR, Koyuturk M (2011) Subnetwork state functions define dysregulated subnetworks in cancer. J Comput Biol 18: 263–281. - PMC - PubMed

Publication types

Substances