. 2013 Sep;9(9):e1003630.
doi: 10.1371/journal.ppat.1003630. Epub 2013 Sep 19.

HTLV-1 bZIP factor induces inflammation through labile Foxp3 expression

Affiliations

HTLV-1 bZIP factor induces inflammation through labile Foxp3 expression

Nanae Yamamoto-Taguchi et al. PLoS Pathog. 2013 Sep.

Abstract

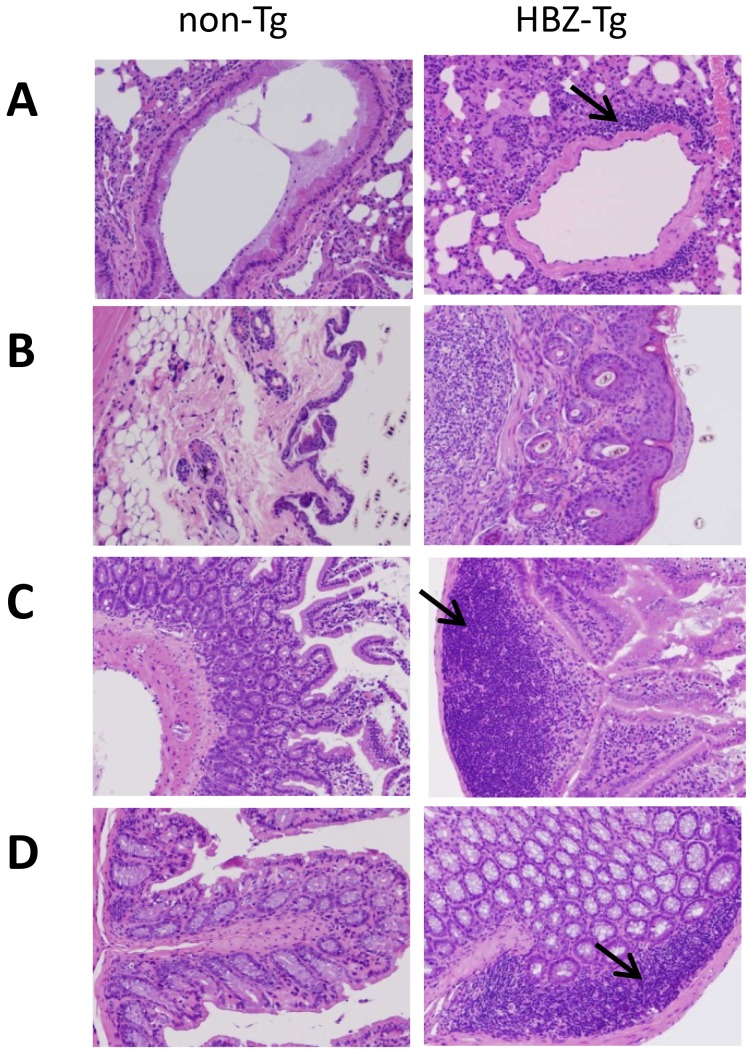
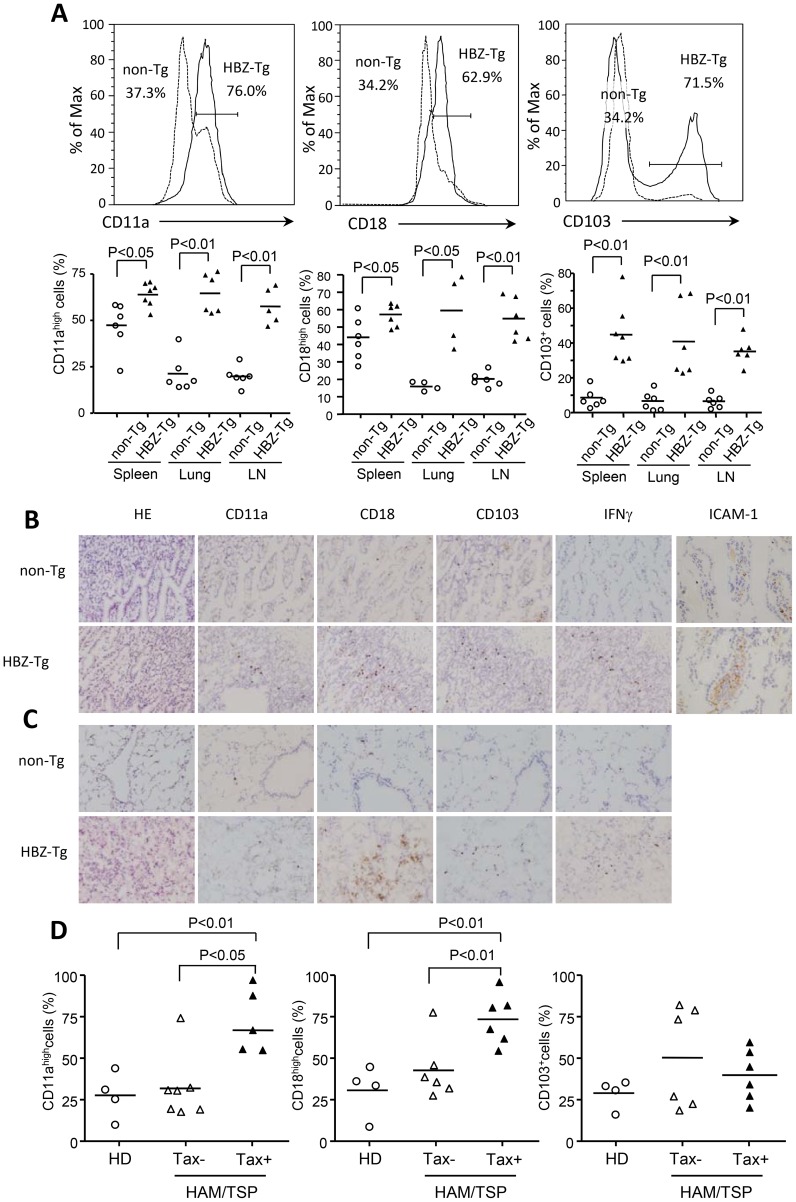
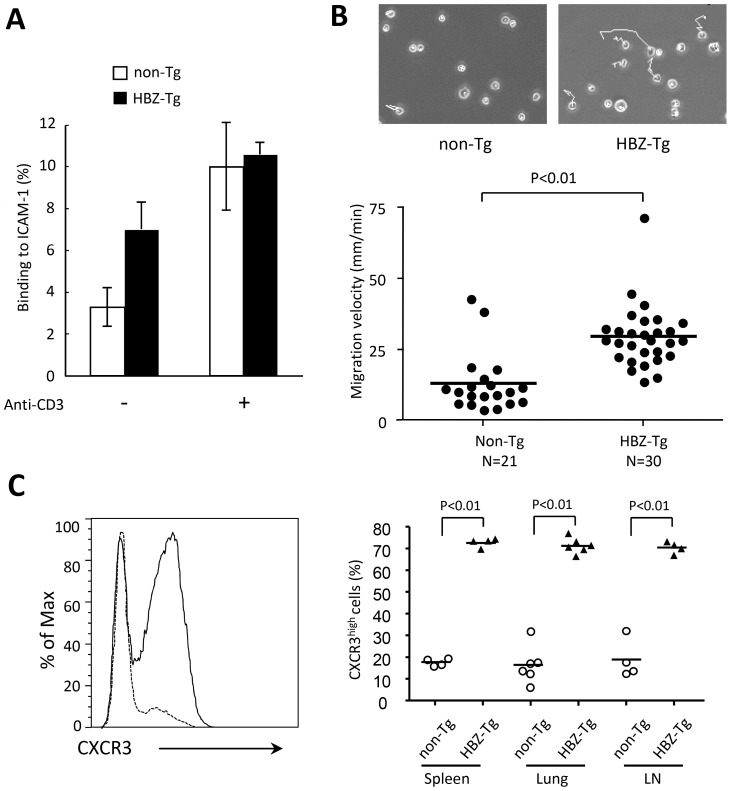
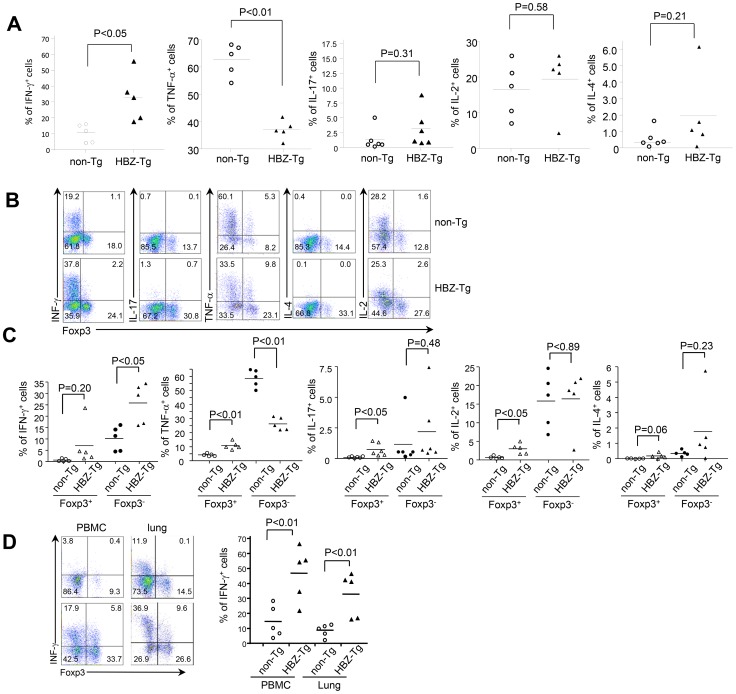
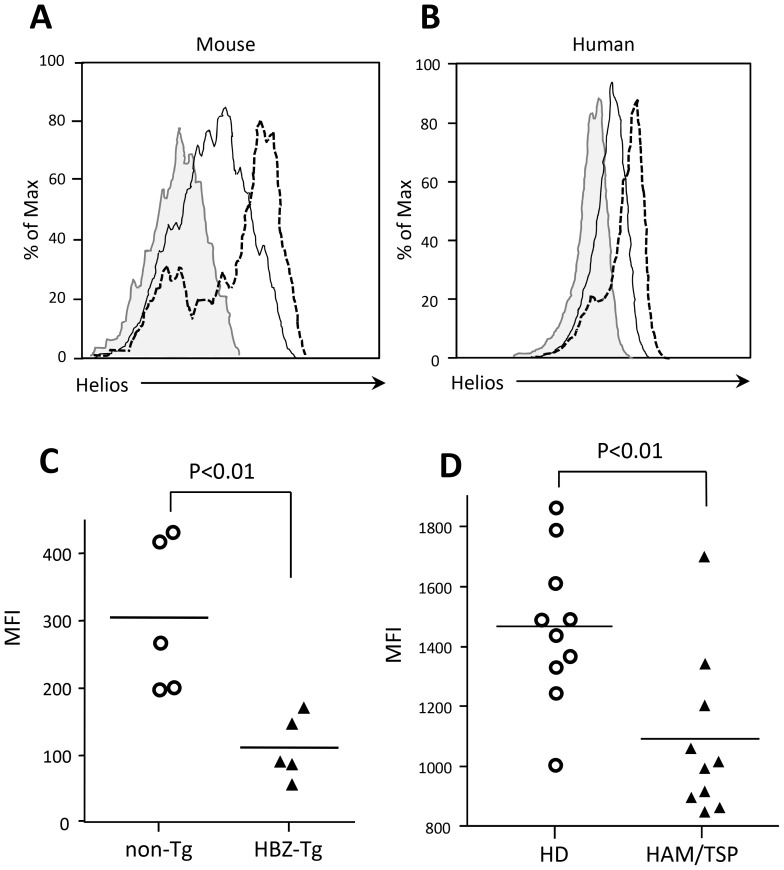
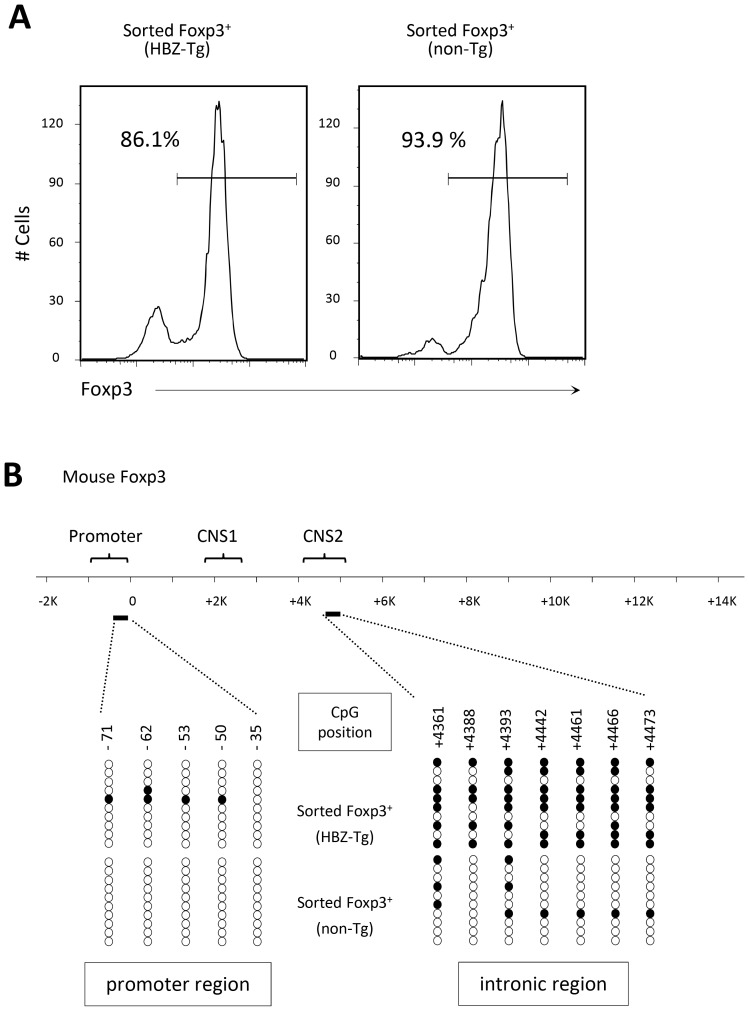
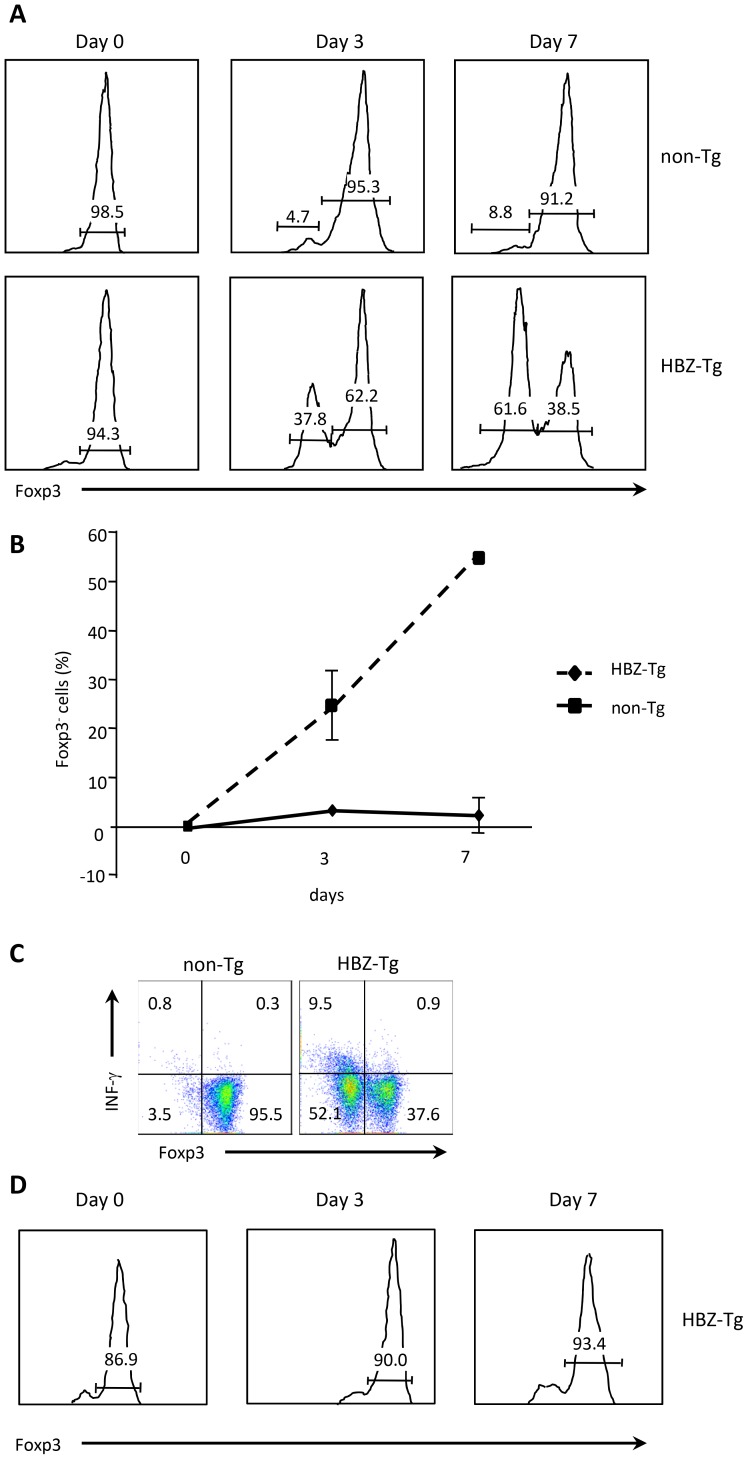
Human T-cell leukemia virus type 1 (HTLV-1) causes both a neoplastic disease and inflammatory diseases, including HTLV-1-associated myelopathy/tropical spastic paraparesis (HAM/TSP). The HTLV-1 basic leucine zipper factor (HBZ) gene is encoded in the minus strand of the proviral DNA and is constitutively expressed in infected cells and ATL cells. HBZ increases the number of regulatory T (Treg) cells by inducing the Foxp3 gene transcription. Recent studies have revealed that some CD4⁺Foxp3⁺ T cells are not terminally differentiated but have a plasticity to convert to other T-cell subsets. Induced Treg (iTreg) cells tend to lose Foxp3 expression, and may acquire an effector phenotype accompanied by the production of inflammatory cytokines, such as interferon-γ (IFN-γ). In this study, we analyzed a pathogenic mechanism of chronic inflammation related with HTLV-1 infection via focusing on HBZ and Foxp3. Infiltration of lymphocytes was observed in the skin, lung and intestine of HBZ-Tg mice. As mechanisms, adhesion and migration of HBZ-expressing CD4⁺ T cells were enhanced in these mice. Foxp3⁻CD4⁺ T cells produced higher amounts of IFN-γ compared to those from non-Tg mice. Expression of Helios was reduced in Treg cells from HBZ-Tg mice and HAM/TSP patients, indicating that iTreg cells are predominant. Consistent with this finding, the conserved non-coding sequence 2 region of the Foxp3 gene was hypermethylated in Treg cells of HBZ-Tg mice, which is a characteristic of iTreg cells. Furthermore, Treg cells in the spleen of HBZ-transgenic mice tended to lose Foxp3 expression and produced an excessive amount of IFN-γ, while Foxp3 expression was stable in natural Treg cells of the thymus. HBZ enhances the generation of iTreg cells, which likely convert to Foxp3⁻T cells producing IFN-γ. The HBZ-mediated proinflammatory phenotype of CD4⁺ T cells is implicated in the pathogenesis of HTLV-1-associated inflammation.


Conflict of interest statement

The authors have declared that no competing interests exist.

Figures

Figure 1
Figure 1. Histopathology of mouse inflammatory tissue.
Hematoxylin and eosin staining of lung (A), skin (B), small intestine (C) and large intestine (D) from non-Tg littermate mice (left) or HBZ-Tg mice (right). Original magnification, ×10. Arrows indicate massive infiltration of lymphocytes.
Figure 2
Figure 2. Expression of CD11a, CD18 and CD103 in CD4+T cells from spleen, lung and LN cells isolated from HBZ-Tg mice.
(A) The expression of CD11a, CD18 and CD103 in CD4+ T cells from non-Tg (dashed line) and HBZ-Tg (solid line) mice was analyzed by flow cytometry. Histograms from one representative mouse splenocytes of each group are shown (top panels). The bottom panel shows the results of 4 or 6 mice in each group, each symbol representing an individual mouse. The small horizontal lines indicate the mean. Frozen sections of intestine (B) and lung (C) of non-Tg and HBZ-Tg mice were stained with HE and the indicated antibodies. Original magnification is ×20. Results from one representative mouse of each group are shown. (D) CD11a, CD18 and CD103 expressions are shown on CD4+ cells from HDs, CD4+Tax and CD4+Tax+ cells from HAM/TSP patients.
Figure 3
Figure 3. Enhanced capacity for cell adhesion and migration of CD4+splenocytes isolated from HBZ-Tg mice.
(A) Assays of cell adhesion to mouse ICAM-1 were performed using purified mouse CD4+splenocytes of HBZ-Tg or non-Tg mice. Results shown are means ± s.d. of triplicate wells. (B) Random CD4+ mouse splenocyte migration was recorded at 37°C with a culture dish system for live-cell microscopy. Phase-contrast images were taken every 15 seconds for 10 min. The cells were traced and migration velocity was calculated. Each dot represents the velocity of an individual cell, and bars indicate the mean (n = 21 for non-Tg, n = 30 for HBZ-Tg). Statistical analyses were performed using an unpaired, two-tailed Student t-test. (C) Representative histograms of CXCR3 expression in CD4+ T cells from non-Tg (dashed line) and HBZ-Tg (solid line) mice (left) and cumulative results from 4 or 6 mice are shown in the graph (right) for spleen, lung and lymph node. Each symbol represents an individual mouse; small horizontal lines indicate the mean.
Figure 4
Figure 4. Production of cytokines in HBZ-Tg mice.
(A) Splenocytes of HBZ-Tg mice or non-Tg mice were stimulated with PMA/ionomycin and protein transport inhibitor for 4 h. IFN-γ, IL-17, TNF-α, IL-4 or IL-2 production was analyzed in CD4+ T cells by flow cytometry. (B) Cytokine production was analyzed along with Foxp3 expression. (C) Production of cytokines was shown in CD4+Foxp3+ T cells and CD4+Foxp3 T cells. (D) IFN-γ and Foxp3 expression gated on CD4+ T cells from PBMC or cells isolated from the lungs were analyzed by flow cytometry. Percentage of IFN-γ+ cells in CD4+ splenocytes, PBMC and lung cells. Each symbol represents an individual mouse; small horizontal lines indicate the mean.
Figure 5
Figure 5. Helios expression in HBZ-Tg mice and HAM/TSP patients.
(A) Expression of Helios in CD4+Foxp3+ cells of HBZ-Tg mice (solid line), non-Tg mice (dashed line) and isotype control (filled histogram). (B) Intracellular Helios expression in gated CD4+ T cells from HAM/TSP patients (solid line), healthy donors (dashed line), or isotype control (filled histogram). One representative histogram for each group is shown. (C) Results from 5 non-Tg and 5 HBZ-Tg mice are shown. (D) Comparison of Helios expression in CD4+FoxP3+PBMC's from 10 HAM/TSP patients and 10 healthy donors. Each symbol represents the value for an individual subject. Statistical analyses were performed using an unpaired, two-tailed Student t-test.
Figure 6
Figure 6. DNA methylation status in the promoter and intronic CpG island region of the Foxp3 gene.
(A) The purity of the isolated Treg cells, sorted from the spleens of male mice, was confirmed by staining the intracellular expression of Foxp3 and analysis by flow cytometry. (B) DNA methylation status in the indicated regions was determined by bisulfite sequencing. Each line represents one analyzed clone; open circles, unmethylated CpGs and filled circles, methylated CpGs.
Figure 7
Figure 7. Stability of Foxp3 expression during ex vivo culture.
(A) Treg cells, sorted from HBZ-Tg or non-Tg mice, were cultured in the presence of IL-2 for 3 or 7 days. The expression of Foxp3 was analyzed by flow cytometry. (B) Sequential changes of the Foxp3 population are shown. (C) IFN-γ production of ex vivo cultured Foxp3+ cells was evaluated by intracellular staining. Sorted Treg cells were cultured for 7 days, and then stimulated for 4 h with PMA/ionomycin and protein transport inhibitor. (D) Foxp3 expression of sorted CD4+CD25+GITRhighthymocytes from HBZ-Tg mice.

References

    1. Matsuoka M, Jeang KT (2007) Human T-cell leukaemia virus type 1 (HTLV-1) infectivity and cellular transformation. Nat Rev Cancer 7: 270–280. - PubMed
    1. Gessain A, Jouannelle A, Escarmant P, Calender A, Schaffar-Deshayes L, et al. (1984) HTLV antibodies in patients with non-Hodgkin lymphomas in Martinique. Lancet 1: 1183–1184. - PubMed
    1. Osame M, Usuku K, Izumo S, Ijichi N, Amitani H, et al. (1986) HTLV-I associated myelopathy, a new clinical entity. Lancet 1: 1031–1032. - PubMed
    1. Nakao K, Ohba N, Matsumoto M (1989) Noninfectious anterior uveitis in patients infected with human T-lymphotropic virus type I. Jpn J Ophthalmol 33: 472–481. - PubMed
    1. Mochizuki M, Yamaguchi K, Takatsuki K, Watanabe T, Mori S, et al. (1992) HTLV-I and uveitis. Lancet 339: 1110. - PubMed

MeSH terms

Substances