. 2013;9(9):e1003820.
doi: 10.1371/journal.pgen.1003820. Epub 2013 Sep 19.

The genome and development-dependent transcriptomes of Pyronema confluens: a window into fungal evolution

Affiliations

The genome and development-dependent transcriptomes of Pyronema confluens: a window into fungal evolution

Stefanie Traeger et al. PLoS Genet. 2013.

Abstract

Fungi are a large group of eukaryotes found in nearly all ecosystems. More than 250 fungal genomes have already been sequenced, greatly improving our understanding of fungal evolution, physiology, and development. However, for the Pezizomycetes, an early-diverging lineage of filamentous ascomycetes, there is so far only one genome available, namely that of the black truffle, Tuber melanosporum, a mycorrhizal species with unusual subterranean fruiting bodies. To help close the sequence gap among basal filamentous ascomycetes, and to allow conclusions about the evolution of fungal development, we sequenced the genome and assayed transcriptomes during development of Pyronema confluens, a saprobic Pezizomycete with a typical apothecium as fruiting body. With a size of 50 Mb and ~13,400 protein-coding genes, the genome is more characteristic of higher filamentous ascomycetes than the large, repeat-rich truffle genome; however, some typical features are different in the P. confluens lineage, e.g. the genomic environment of the mating type genes that is conserved in higher filamentous ascomycetes, but only partly conserved in P. confluens. On the other hand, P. confluens has a full complement of fungal photoreceptors, and expression studies indicate that light perception might be similar to distantly related ascomycetes and, thus, represent a basic feature of filamentous ascomycetes. Analysis of spliced RNA-seq sequence reads allowed the detection of natural antisense transcripts for 281 genes. The P. confluens genome contains an unusually high number of predicted orphan genes, many of which are upregulated during sexual development, consistent with the idea of rapid evolution of sex-associated genes. Comparative transcriptomics identified the transcription factor gene pro44 that is upregulated during development in P. confluens and the Sordariomycete Sordaria macrospora. The P. confluens pro44 gene (PCON_06721) was used to complement the S. macrospora pro44 deletion mutant, showing functional conservation of this developmental regulator.


Conflict of interest statement

The authors have declared that no competing interests exist.

Figures

Figure 1
Figure 1. Life cycle of P. confluens under continuous illumination and laboratory conditions.
Non-pigmented, regularly septated mycelium germinates from haploid ascospores after a few hours. First orange structures of sexual organs can be observed after two days, they consists of ascogonia (enlarged, cytoplasm-rich female structures) and antheridia (male organs). Cytoplasmic fusion and transfer of nuclei are realized by a trichogyne that grows from an ascogonium towards an antheridium; the formation of dikaryotic ascogenous hyphae begins after plasmogamy and is followed by karyogamy and meiosis (not shown). After the fourth day of incubation, young pigmented apothecia can be observed; these contain many thin paraphyses, but no mature asci yet. By the sixth to seventh day, apothecia are mature and contain numerous asci (shown in top and side view to the left and right, the middle panel shows a flattened apothecium to visualize the ascus rosette). Each ascus contains eight hyaline ascospores. With the exception of the ascogenous hyphae in which karyogamy occurs leading to a diploid nucleus (which directly undergoes meiosis to yield haploid ascospores), all hyphae, both in vegetative or sexual structures, contain haploid nuclei.
Figure 2
Figure 2. Species tree of 18 fungal species based on phylome reconstruction.
The species tree was built using PhyML based on 426 single-copy, widespread genes (see Materials and Methods for details). A bootstrap of 100 repetitions was also reconstructed, bootstrap values for all branches were 100%. A species tree constructed with the super-tree reconstruction program DupTree based on all 6,949 trees reconstructed in the phylome had the same topology. The divergence time of the Pyronema and Tuber lineages was estimated at 260 or 413 Mya using r8s calibrated with divergence times of 723.86 Mya and 1147.78 Mya, respectively, for Schizosaccharomyces pombe and the remaining ascomycetes (see Materials and Methods).
Figure 3
Figure 3. Intron content of protein-coding genes from P. confluens and 10 other filamentous fungi.
Putative orthologs to P. confluens genes were identified by reciprocal BLASTP analysis, and 747 genes with orthologs across all fungal genomes used were analyzed for intron content (analysis of CDSs only, because UTRs are not annotated in all cases). Blue bars give the percentage of genes without introns (left y-axis), red diamonds give the average number of genes per kb (right y-axis). Data from genome projects for the following species were used for the analysis: Bd, Batrachochytrium dendrobatidis (http://genome.jgi-psf.org/Batde5/Batde5.home.html); Ro, Rhizopus oryzae ; Pc, Pyronema confluens (this study); Tm, Tuber melanosporum ; An, Aspergillus nidulans ; Pn, Phaesphaeria nodorum ; Nc, Neurospora crassa ; Sm, Sordaria macrospora ; Ss, Sclerotinia sclerotiorum ; Pp, Postia placenta ; Cc, Coprinopsis cinerea .
Figure 4
Figure 4. Synteny analysis with other fungi.
A–B. Regions of sequence identity between the in silico-translated genomic sequences of the pairs T. melanosporum/P. confluens and S. macrospora/N. crassa (for comparison) were determined with the PROmer algorithm from the MUMmer package . The percent identity plot (A) was plotted with gnuplot, green indicates sequences on the forward strand, blue on the reverse strand of the reference. The PROmer analysis shows a much higher percentage of regions of similarity/identity between S. macrospora and N. crassa than between T. melanosporum and P. confluens. C. The number of pairs or triplets of orthologous genes within a 20 kb (pairs) or 40 kb (triplets) region was determined for P. confluens and 10 other fungi. For comparison, the number of syntenic pairs or triplets was also determined for S. macrospora and N. crassa (bars at the right). Note that the y-axis is interrupted in two places for better visualization. Data used for this analysis are from the genome projects as indicated in the legend of Figure 3.
Figure 5
Figure 5. Organization of the mating type loci.
The predicted mating type genes MAT-1-1-1 and MAT-1-2-1 on scaffolds 329 and 381, respectively, are shown together with adjacent genes. The gap in scaffold 381 was introduced for better visibility and contains the predicted genes PCON_08386 and PCON_08387.
Figure 6
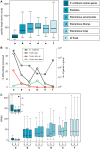
Figure 6. Lineage-specific peptide lengths and gene expression.
Peptide lengths and expression of P. confluens genes from groups of genes with different levels of evolutionary conservation as indicated. A. Boxplot showing the distribution of peptide lengths (outliers left out for better visibility) with the median value as a horizontal line in the box between the first and third quartiles. Peptide length of predicted P. confluens orphan genes are smaller than those for the other groups, and from groups a to d, median peptide lengths increase with increasing conservation of genes. B. The number of genes in each group are indicated on the logarithmic y-axis to the right, and percentage of genes that are differentially regulated under any condition, and up- or down-regulated during sexual development (up or down in sex/DD and sex/vegmix, data shown for stringent expression analysis) are indicated on the y-axis to the left. The orphan genes have the highest percentage of differentially expressed genes, most of which are upregulated during sexual development. In the other groups, the portion of differentially regulated genes is smaller, and the percentage of genes upregulated during sexual development is similar or smaller than that of downregulated genes. C. Overall expression levels given in RPKM (reads per kilobase per million counted reads). For each group, RPKM values were calculated for samples sexual development (S), DD (D), and vegmix (V) as mean RPKM values of the two independent experiments. The boxplot shows the distribution with the median value as a horizontal line in the box between the first and third quartiles (outliers left out for better visibility). The small inlet shows a magnification of the RPKM values for group a (orphan genes). In this group, overall expression is lower, but the distribution of RPKM values for S is significantly different from D and V samples (p<0.01 in Kolmogorov-Smirnov-test). Within the other groups, no significantly different distribution between S, V, and D can be observed.
Figure 7
Figure 7. Fruiting body development and gene expression under different light regimes.
A. Fruiting body development in P. confluens is blue light-dependent. P. confluens was grown on minimal medium in constant light of different wavelengths as indicated (for filter characteristics see Figure S8). The left column shows petri dishes, the middle column sections from petri dishes (bar 500 µm), and the right column shows mature apothecia in those cases where fruiting bodies are formed (bar 100 µm). Blue light is the effective part of the visible spectrum and induces apothecia formation, similar to white light. Under other light conditions or in darkness, sometimes mycelial aggreagates are formed that can be darkly pigmented, but do not contain sexual structures (e.g. visible in section from petri dish in the dark). B and C. Expression of homologs of genes that are involved in blue light responses (wc1, wc2, frq), in light responses and/or fruiting body formation (pro44), are photoreceptors for other wavelengths (orp1, phy1, phy2) or carotenoid biosynthesis genes (al1, al2, al3) in other fungi (Table 2). Transcript levels after 4 d of illumination with white, blue, or green light compared to 4 d in darkness (DD) are shown in B, short term light induction (5–60 min after growth in darkness for 4 d) in C. P. confluens was grown in minimal liquid medium and harvested under far-red light. Transcript levels were determined by qRT-PCR from at least two independent biological replicates; ratios versus DD samples are shown, error bars in B indicate standard deviation, for standard deviations for short term light induction in C, see Table S10.
Figure 8
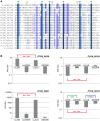
Figure 8. The CBM_14 domain protein family is expanded in P. confluens.
A. Multiple alignment of the CBM_14 domains of proteins from P. confluens, several Eurotiales and an insect. In addition to the P. confluens proteins, the following proteins were used for Clustal X analysis: A. gambiae, Anopheles gambiae sp|O76217.2; A. nidulans, Aspergillus nidulans ANID_00499 from the A. nidulans genome project http://www.broadinstitute.org/annotation/genome/aspergillus_group/MultiHome.html; A. niger, Aspergillus niger ref|XP_001397263.1; N. fischeri, Neosartorya fischeri ref|XP_001266454.1; P. chrysog., Penicillium chrysogenum ref|XP_002561001.1. The conserved cysteine residues are indicated by green arrowheads above the sequence. B. Quantitative real time PCR analysis of selected CBM_14 domain-encoding genes from P. confluens. Expression was analyzed for each gene in two independent biological replicates for the four conditions LL, DD, LLK and DDK (light and darkness in surface culture and submerged culture). Sexual development is only possible in condition LL. The graph shows mean and standard deviation (for better visualization, standard deviations for negative expression ratios are shown in the negative instead of the positive direction). Expression ratios were calculated to address the question if a gene is differentially regulated during sexual development (i.e. in LL/DD and in LL/LLK), or regulated by light (i.e. in LL/DD and LLK/DDK) or regulated by surface versus submerged growth (i.e. LL/LLK and DD/DDK).
Figure 9
Figure 9. Comparative transcriptome analysis with S. macrospora, and functional conservation of the transcription factor gene PCON_06721.
A. Comparative analysis of RPKM values for all orthologous genes for P. confluens and S. macrospora (with the exception of genes without read counts in one or more conditions). B. Quantitative real time PCR analysis of the predicted transcription factor gene PCON_06721 in P. confluens. Expression was analyzed in two independent biological replicates for the four conditions LL, DD, LLK and DDK (light and darkness in surface culture and submerged culture). Sexual development is only possible in condition LL. Expression ratios and standard deviations were calculated to address the question if the gene is differentially regulated during sexual development (i.e. in LL/DD and in LL/LLK), or regulated by light (i.e. in LL/DD and LLK/DDK) or regulated by surface versus submerged growth (i.e. LL/LLK and DD/DDK). PCON_06721 is upregulated during sexual development, but also slightly upregulated by light. RNA-seq results are given for comparison. C. Complementation of the Sordaria macrospora mutant Δpro44 with the P. confluens ortholog PCON_06721. The mutant was transformed with plasmid pFA50 that carries the PCON_06721 ORF under control of the respective gpd and trpC promoter and terminator sequences of Aspergillus nidulans. The figure shows a side view (longitudinal section) of the region comprising the agar/air interface from cultures of the wild type, the sterile mutant Δpro44 and a complemented transformant (Δpro44::PCON_06721_constitutive). The small inserts show photographs of Petri dish sections. The S. macrospora wild type forms mature perithecia at the agar/air interface, whereas the mutant only forms protoperithecia that are submerged in the agar. Complemented transformants produce mature perithecia at the agar/air interface like the wild type. Strains were grown on corn meal agar; photographs were taken after 8 d; scale bar indicates 1 mm, and 1 cm in the inserted photographs.

References

    1. Buckley M (2008) The fungal kingdom - diverse and essential roles in earth's ecosystem. Washington DC: American Academy of Microbiology. - PubMed
    1. Hawksworth DL (2001) The magnitude of fungal diversity: the 1.5 million species estimate revisited. Mycol Res 105: 1422–1432.
    1. Ebersberger I, de Matos Simoes R, Kupczok A, Gube M, Kothe E, et al. (2012) A consistent phylogenetic backbone for the fungi. Mol Biol Evol 29: 1319–1334. - PMC - PubMed
    1. Hibbett DS, Binder M, Bischoff JF, Blackwell M, Cannon PF, et al. (2007) A higher-level phylogenetic classification of the Fungi. Mycol Res 111: 509–547. - PubMed
    1. Liu YJ, Hall BD (2004) Body plan evolution of ascomycetes, as inferred from an RNA polymerase II phylogeny. Proc Nat Acad Sci USA 101: 4507–4512. - PMC - PubMed

Publication types

MeSH terms