. 2013 Sep 24:4:188.
doi: 10.3389/fgene.2013.00188. eCollection 2013.

Temporal clustering of gene expression links the metabolic transcription factor HNF4α to the ER stress-dependent gene regulatory network

Affiliations

Temporal clustering of gene expression links the metabolic transcription factor HNF4α to the ER stress-dependent gene regulatory network

Angela M Arensdorf et al. Front Genet. .

Abstract

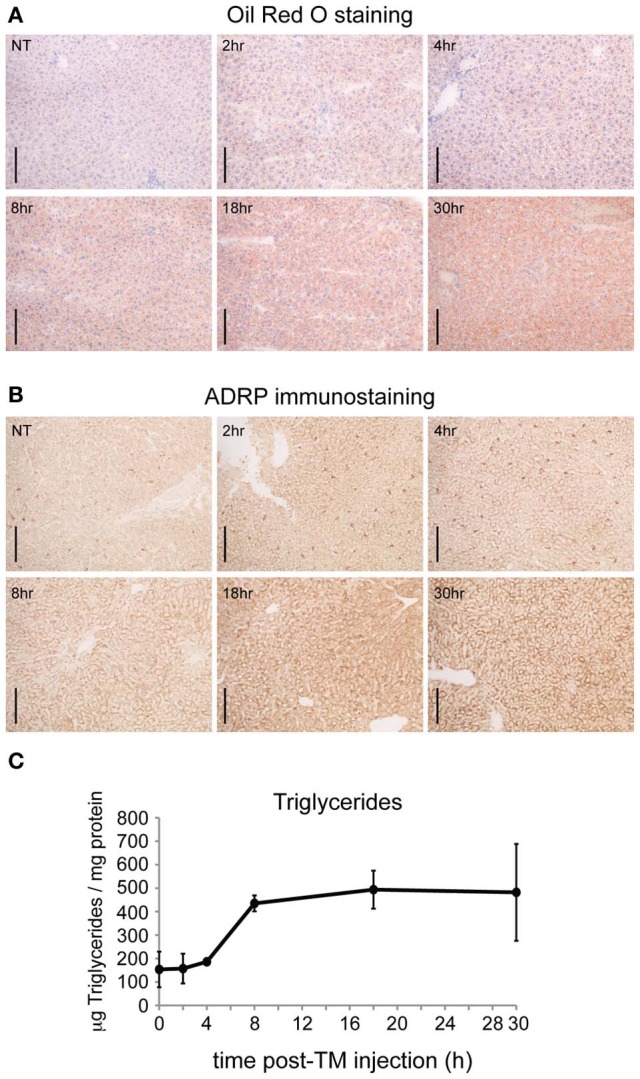
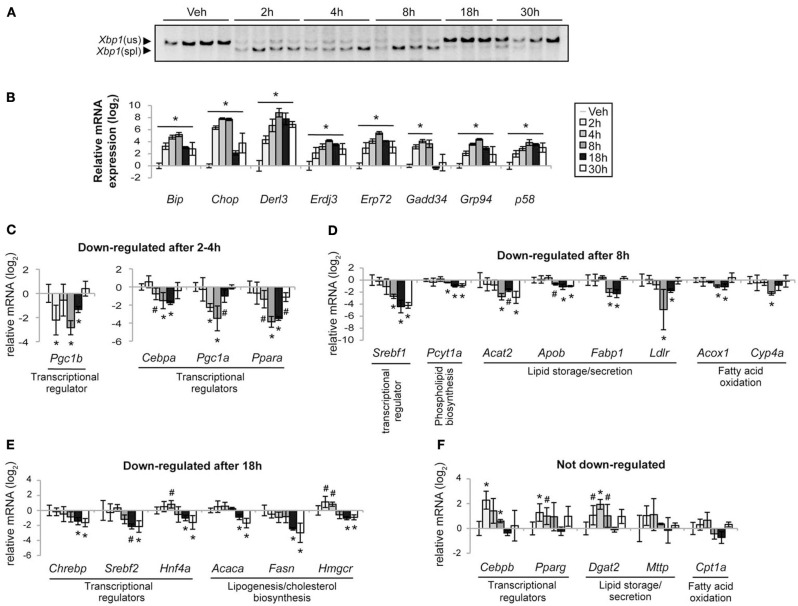
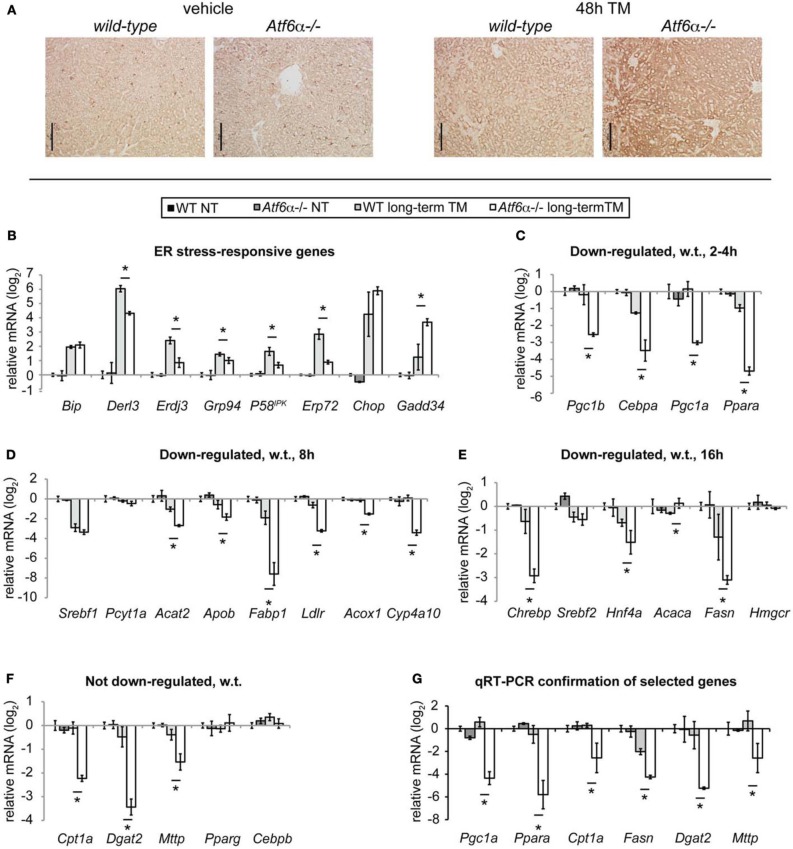
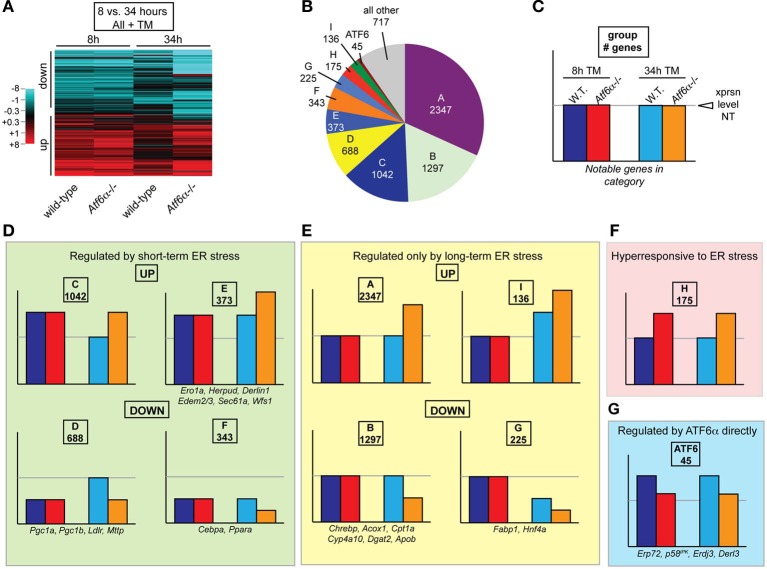
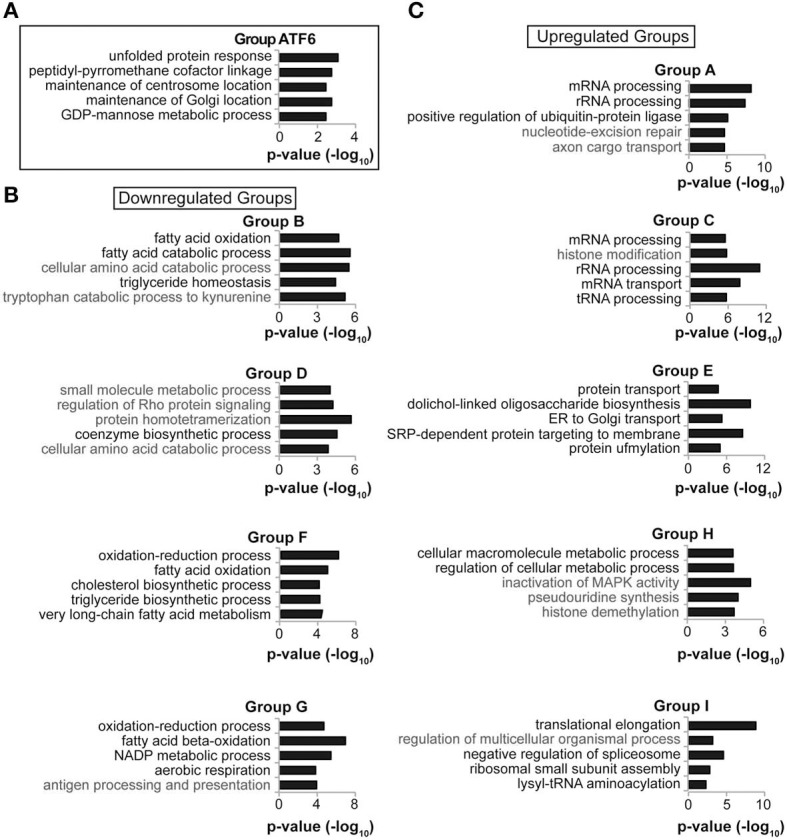
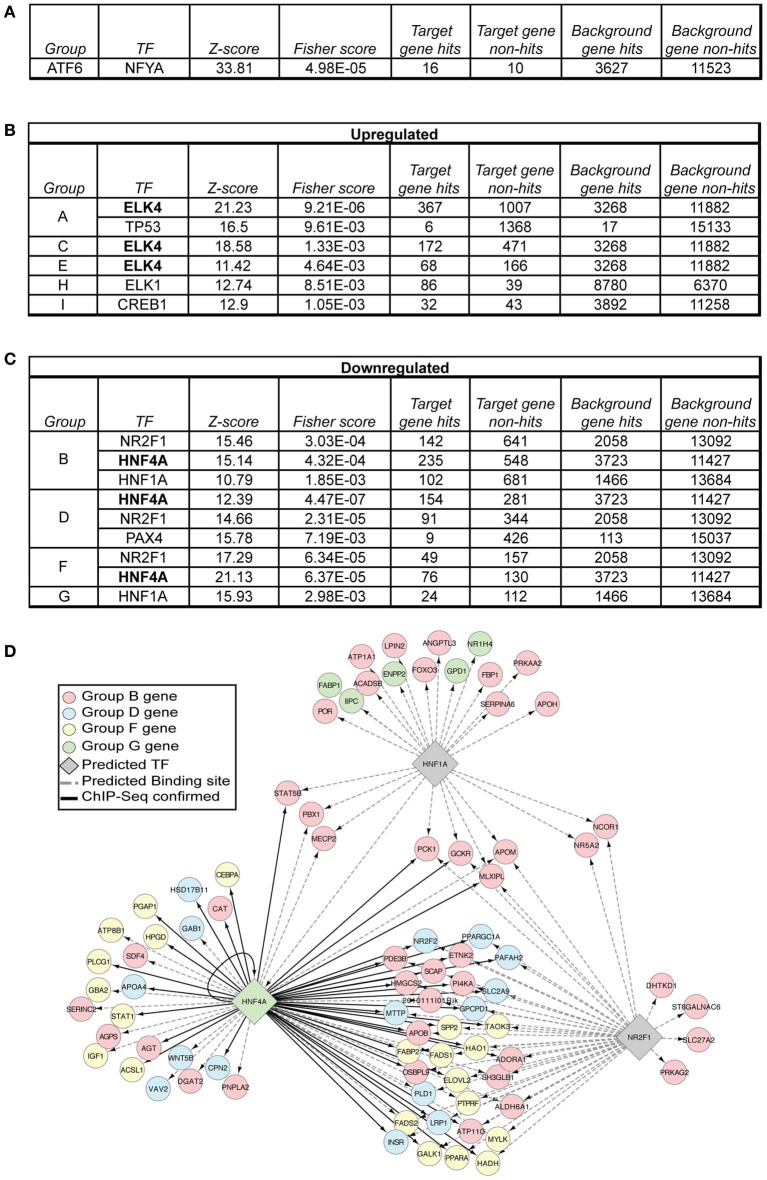
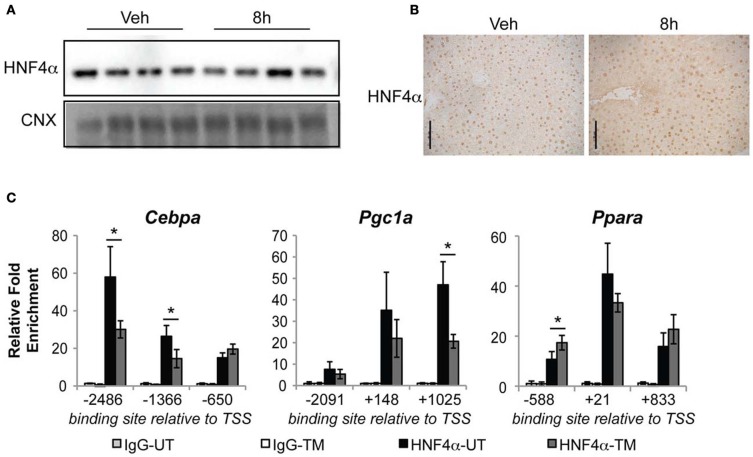
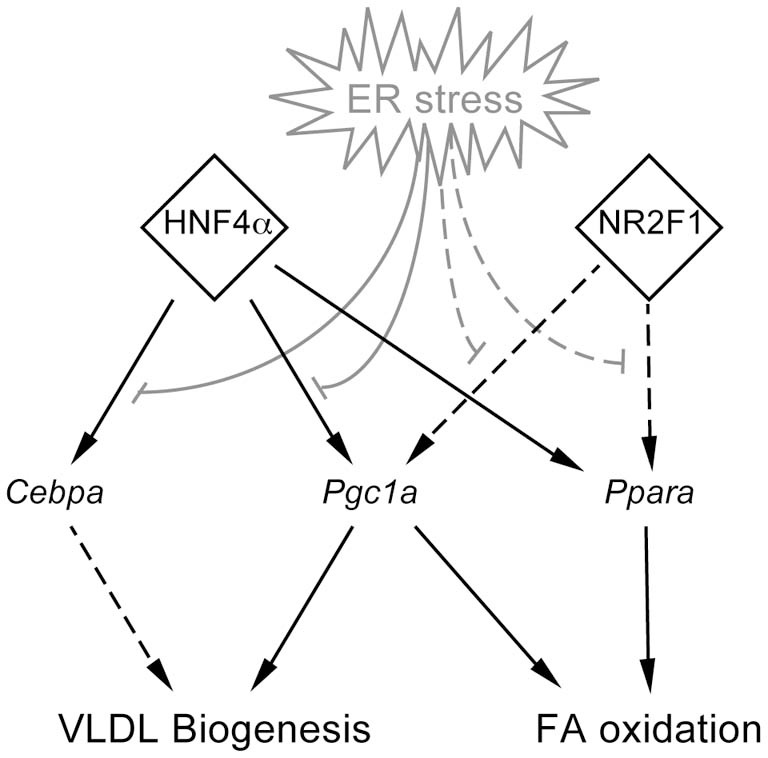
The unfolded protein response (UPR) responds to disruption of endoplasmic reticulum (ER) function by initiating signaling cascades that ultimately culminate in extensive transcriptional regulation. Classically, this regulation includes genes encoding ER chaperones, ER-associated degradation factors, and others involved in secretory protein folding and processing, and is carried out by the transcriptional activators that are produced as a consequence of UPR activation. However, up to half of the mRNAs regulated by ER stress are downregulated rather than upregulated, and the mechanisms linking ER stress and UPR activation to mRNA suppression are poorly understood. To begin to address this issue, we used a "bottom-up" approach to study the metabolic gene regulatory network controlled by the UPR in the liver, because ER stress in the liver leads to lipid accumulation, and fatty liver disease is the most common liver disease in the western world. qRT-PCR profiling of mouse liver mRNAs during ER stress revealed that suppression of the transcriptional regulators C/EBPα, PPARα, and PGC-1α preceded lipid accumulation, and was then followed by suppression of mRNAs encoding key enzymes involved in fatty acid oxidation and lipoprotein biogenesis and transport. Mice lacking the ER stress sensor ATF6α, which experience persistent ER stress and profound lipid accumulation during challenge, were then used as the basis for a functional genomics approach that allowed genes to be grouped into distinct expression profiles. This clustering predicted that ER stress would suppress the activity of the metabolic transcriptional regulator HNF4α-a finding subsequently confirmed by chromatin immunopreciptation at the Cebpa and Pgc1a promoters. Our results establish a framework for hepatic gene regulation during ER stress and suggest that HNF4α occupies the apex of that framework. They also provide a unique resource for the community to further explore the temporal regulation of gene expression during ER stress in vivo.

Keywords: ER stress; fatty liver; functional genomics; gene regulatory network; lipid metabolism.


Figures

Figure 1
Figure 1
ER stress causes substantial hepatic lipid accumulation within 8 h. (A) C57BL/6J mice were challenged with 1 mg/kg TM for the indicated times, livers were frozen in OCT, and lipids were stained with Oil Red O. Scale bar = 50 μm. (B) Same as (A), except lipid content was assessed by immunohistochemical staining for the lipid droplet marker protein ADRP. Scale bar = 50 μm. (C) Same as (A), except triglyceride content was measured by colorimetric assay after extraction of neutral lipids. p < 0.001 by One-Way ANOVA. n = 3 samples per time point. Error bars here and elsewhere show means ± SDM.
Figure 2
Figure 2
Staggered suppression of metabolic genes during ER stress. (A) The spliced (spl) and unspliced (us) forms of Xbp1 mRNA were detected by RT-PCR of total RNA isolated from the livers of mice treated with vehicle (veh) or 1 mg/kg TM for the indicated times. Each lane shows a separate animal. Image is shown in black-to-white inverted form for greater visual clarity. (B) Expression of the indicated UPR target genes was determined by qRT-PCR from the animals shown in (A), with Btf3 and Ppia used as normalizing controls. Expression here and in subsequent figures is given on a log2 scale relative to the vehicle-treated condition. Here and elsewhere unless noted: *p < 0.05; #p < 0.1 by two-tailed student's t-test. (C–F) Expression of metabolic genes was assessed by qRT-PCR as in (B), and genes were grouped according to the time point at which downregulation (p < 0.1) was first observed. The process in which each gene participates is listed.
Figure 3
Figure 3
Loss of Atf6α exacerbates steatosis and long-term metabolic gene suppression. (A) Wild-type or Atf6α−/− mice were challenged with 1 mg/kg TM or vehicle for 48 h, and ADRP immunostaining was carried out as in Figure 1. Scale bar = 50 μm. (B–F) Wild-type or Atf6α−/− mice were challenged with 1 mg/kg TM or vehicle for 34 h, and global mRNA expression was assessed by Affymetrix microarray. Array-determined expression of the indicated genes is shown. Genes were arranged in the same groupings as in Figure 2. Statistical significance was calculated by two-tailed student's t-test, comparing expression in TM-treated Atf6α−/− animals against TM-treated wild-type animals. n = 3 animals per group. (G) Mice were treated with TM or vehicle for 48 h as in (A), and expression of the indicated genes was determined by qRT-PCR. Significance was determined as in (B–F).
Figure 4
Figure 4
Clustering of genes according to temporal regulation in wild-type and Atf−/− animals. (A) The expression of every probeset on the Affymetrix microarray described in Figure 3 was aggregated with expression data from a previously published identical array comparing gene expression in wild-type and Atf−/− animals 8 h after challenge with vehicle or 2 mg/kg TM (Rutkowski et al., 2008). For each time point, expression was determined using a log2 scale relative to vehicle-treated wild-type animals at that time point. Only probesets showing significant (p < 0.05) expression differences (1.5-fold, or ±0.58 on the log2 scale) in one or more of the four of the four conditions (wild-type or Atf−/− at 8 or 34 h) are shown by heatmap, which accounted for ~7000 of the ~45,000 probesets on the array. Extent of up- or downregulation is shown by intensity of red or blue coloration, respectively. Each column depicts expression level averaged among the three animals per group. (B,C) Every probeset on the array was characterized by its expression in the following four ways, with differences defined as > 1.5-fold, p < 0.05: (1) up, down, or unchanged in wild-type TM-treated animals at 8 h relative to vehicle-treated wild-type; (2) up, down, or unchanged in Atf−/− TM-treated animals at 8 h relative to TM-treated wild-type; (3) same as (1) but 34 h; and (4) same as (2) but 34 h. The genes that showed a difference by criterion (4) were broken down into groups based on their behavior with respect to these criteria, and the number of genes in the nine most populated groups is shown in (B). The group of genes that were upregulated by ER stress in wild-type animals at both time points, but were less upregulated in Atf−/− animals—i.e., genes that could be understood as directly ATF6α-dependent—is also accounted for. (C) provides a key for illustration of gene expression patterns. (D–G) Expression pattern for each of the gene groups shown in (B). These include genes shown in Figure 2 (those that did not fall into one of these groups are illustrated in Figure S1) as well as genes involved in ER protein processing found in Group E. For genes represented by more than one probeset, the behavior most commonly represented and/or most consistent with qRT-PCR data is shown.
Figure 5
Figure 5
Functionally related genes cluster by temporal regulation. (A–C) Each of the gene groups in Figure 4 was subjected to Gene Ontology pathway analysis using FunNet. The top seven most significant pathway enrichments were then reordered by the number of genes from that group that were pathway “hits,” with pathways having the most “hits” listed higher. For reasons of space, five of these seven pathways from each group are shown. In no case was a lipid metabolism process enriched among the upregulated gene groups. In (B), pathways relevant to lipid metabolism are listed in black, and other pathways in gray. In (C), pathways relevant to protein processing are listed in black.
Figure 6
Figure 6
Transcription factor prediction implicates ELK4, HNF1α, NR2F1, and HNF4α as hidden regulatory nodes in hepatic stress-dependent gene regulation. (A–C) Each of the gene groups in Figure 4 was subjected to oPOSSUM single-site analysis, which searches regulatory regions (in this case, ±2000 bp from the transcriptional start site) for potential binding sites of transcription factors identified in the JASPAR CORE database. The results were limited to a Z-score > 10 and a Fisher score < 0.01. (D) The data from (C) were visualized using the BINGO plug-in for Cytoscape software, considering only genes relevant to lipid metabolism as annotated from GO analysis. oPOSSUM-predicted binding sites are shown using dashed lines, while genes with confirmed HNF4α-binding sites are shown by solid lines.
Figure 7
Figure 7
Diminished HNF4α binding at Cebpa and Pgc1a promoters during ER stress. (A,B) Wild-type mice were challenged with 1 mg/kg TM for 8 h, and expression of HNF4α was assessed by immunoblot (A) or immunohistochemistry (B). Scale bar = 50 μm. (C) HNF4α binding to the regulatory regions of the indicated genes was assessed by chromatin-IP. Regions are given relative to the transcriptional start site, and correspond to regions identified by ChIP-seq analysis (Schmidt et al., 2010). n = 3–4 animals per group. Typical recovery of genomic material in samples containing HNF4α antibody was in the range of 0.1–1 percent of total input. *p < 0.05 by t-test.
Figure 8
Figure 8
Model for organization of lipid metabolic gene regulation during ER stress. Experimentally demonstrated (here or elsewhere) relationships are shown using solid lines, while as-yet unvalidated relationships suggested by this work are shown by dashed lines.

References

    1. Arensdorf A. M., Rutkowski D. T. (2013). Endoplasmic reticulum stress impairs IL-4/IL-13 signaling through C/EBPβ-mediated transcriptional suppression. J. Cell. Sci. 126, 4026–4036 10.1242/jcs.130757 - DOI - PMC - PubMed
    1. Caviglia J. M., Gayet C., Ota T., Hernandez-Ono A., Conlon D. M., Jiang H., et al. (2011). Different fatty acids inhibit apoB100 secretion by different pathways: unique roles for ER stress, ceramide, and autophagy. J. Lipid Res. 52, 1636–1651 10.1194/jlr.M016931 - DOI - PMC - PubMed
    1. Chen W. S., Manova K., Weinstein D. C., Duncan S. A., Plump A. S., Prezioso V. R., et al. (1994). Disruption of the HNF-4 gene, expressed in visceral endoderm, leads to cell death in embryonic ectoderm and impaired gastrulation of mouse embryos. Genes Dev. 8, 2466–2477 10.1101/gad.8.20.2466 - DOI - PubMed
    1. Chikka M. R., McCabe D. D., Tyra H. M., Rutkowski D. T. (2013). C/EBP homologous protein (CHOP) contributes to suppression of metabolic genes during ER stress in the liver. J. Biol. Chem. 288, 4405–4415 10.1074/jbc.M112.432344 - DOI - PMC - PubMed
    1. Cinaroglu A., Gao C., Imrie D., Sadler K. C. (2011). Activating transcription factor 6 plays protective and pathological roles in steatosis due to endoplasmic reticulum stress in zebrafish. Hepatology 54, 495–508 10.1002/hep.24396 - DOI - PMC - PubMed