. 2013 Sep 19;8(9):e73337.
doi: 10.1371/journal.pone.0073337. eCollection 2013.

Function of survivin in trophoblastic cells of the placenta

Affiliations

Function of survivin in trophoblastic cells of the placenta

Cornelia Muschol-Steinmetz et al. PLoS One. .

Abstract

Background: Preeclampsia is one of the leading causes of maternal and perinatal mortality and morbidity worldwide and its pathogenesis is not totally understood. As a member of the chromosomal passenger complex and an inhibitor of apoptosis, survivin is a well-characterized oncoprotein. Its roles in trophoblastic cells remain to be defined.

Methods: The placental samples from 16 preeclampsia patients and 16 well-matched controls were included in this study. Real-time PCR, immunohistochemistry and Western blot analysis were carried out with placental tissues. Primary trophoblastic cells from term placentas were isolated for Western blot analysis. Cell proliferation, cell cycle analysis and immunofluorescence staining were performed in trophoblastic cell lines BeWo, JAR and HTR-8/SVneo.

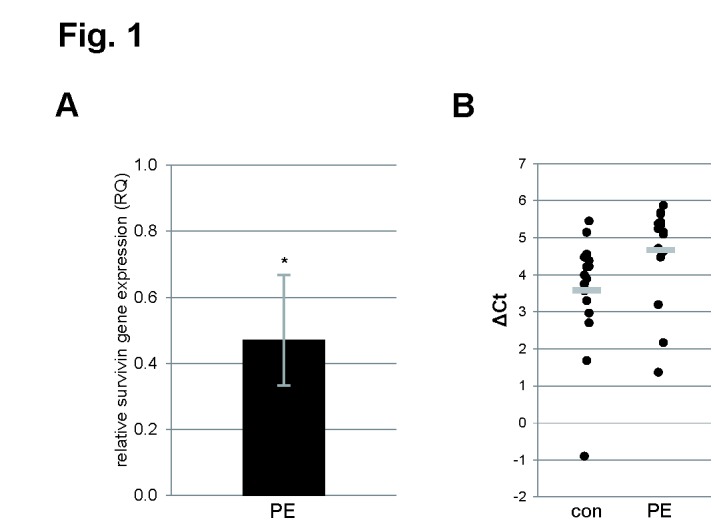
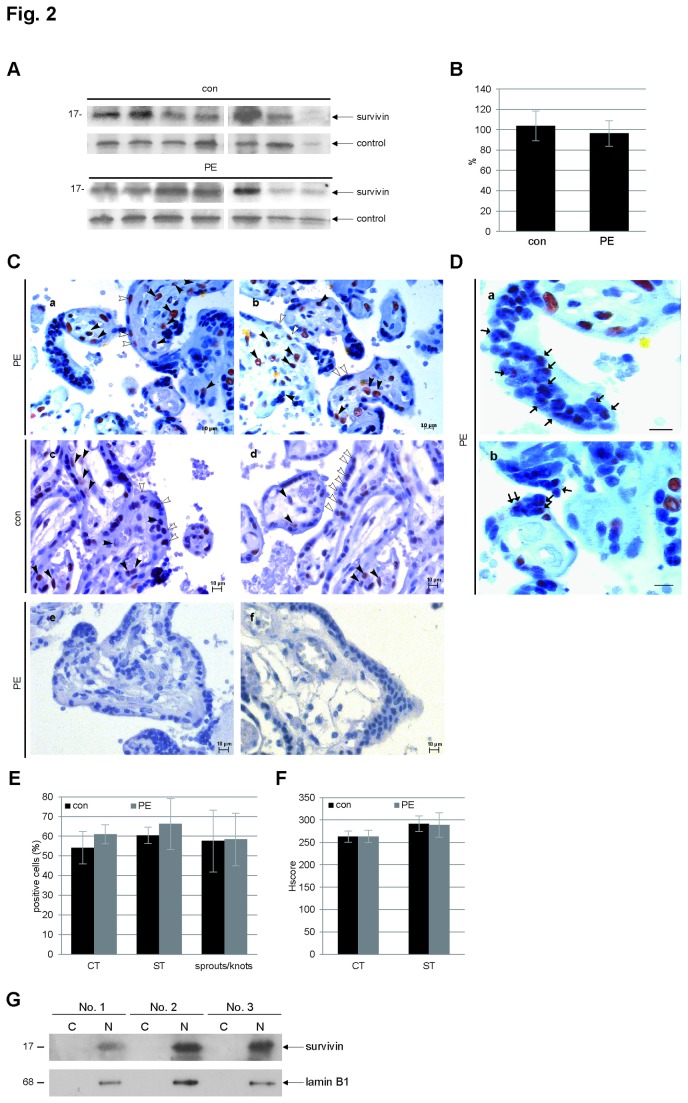
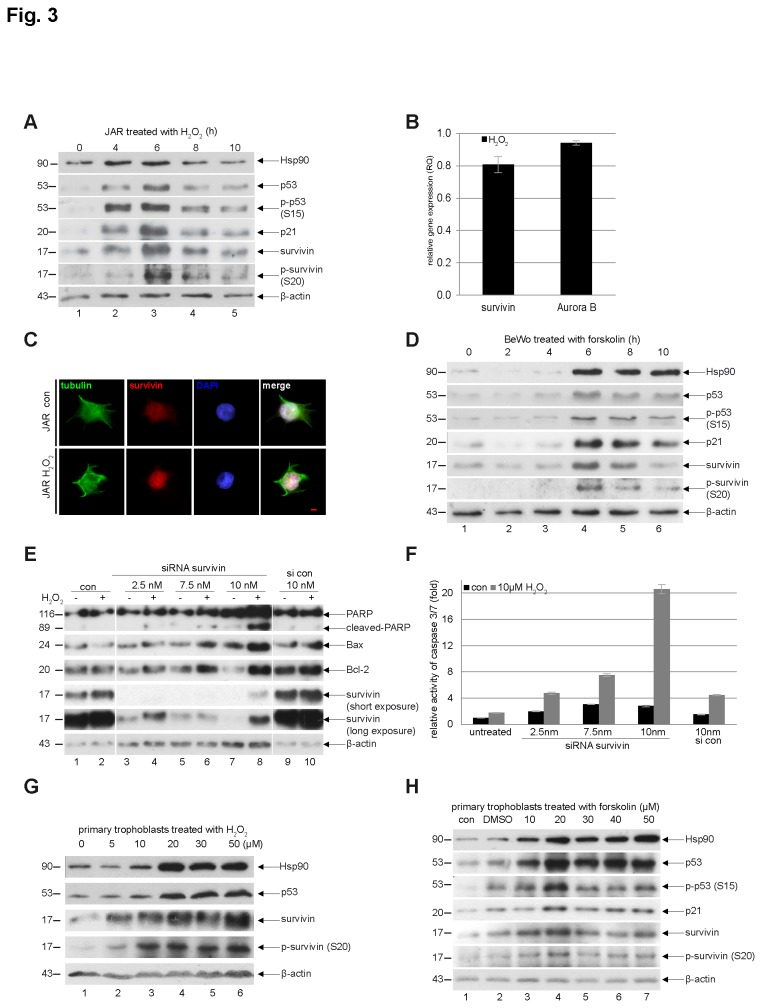
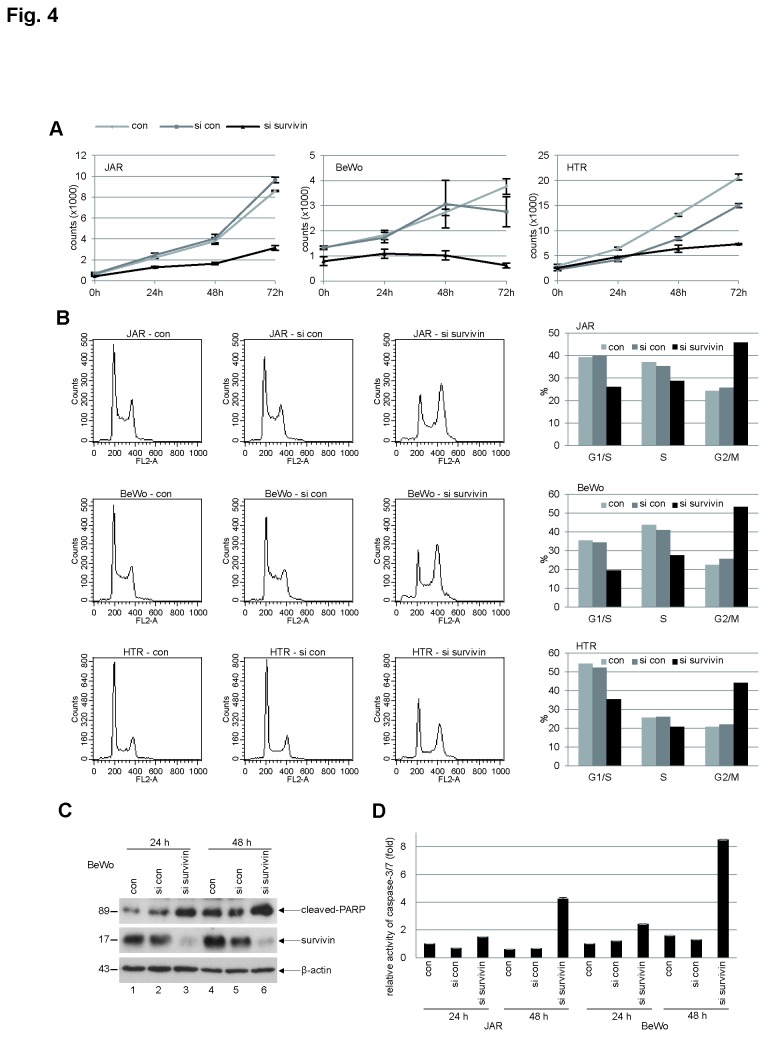
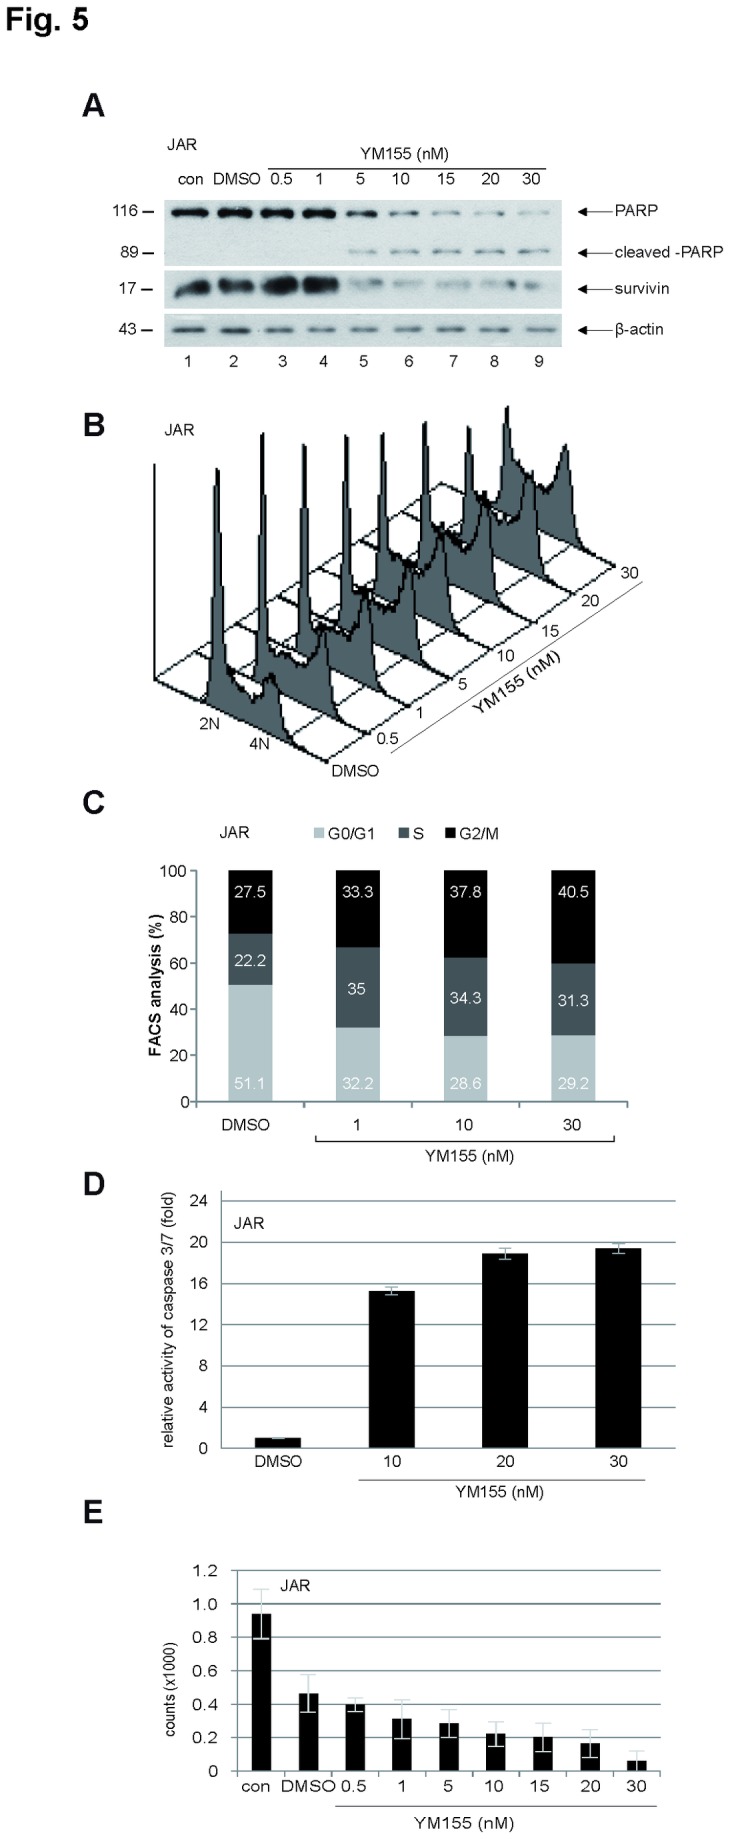
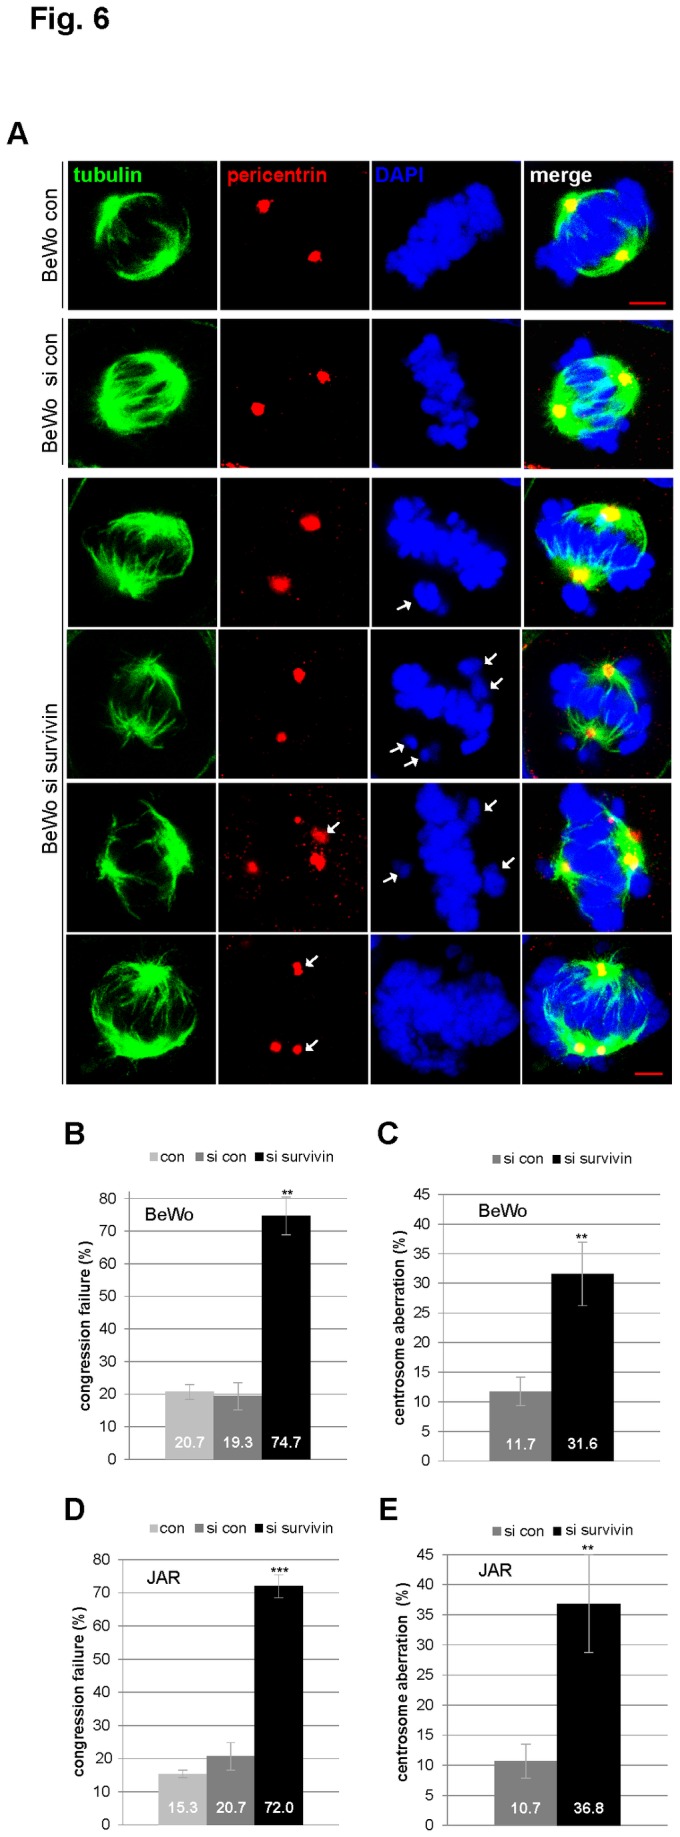
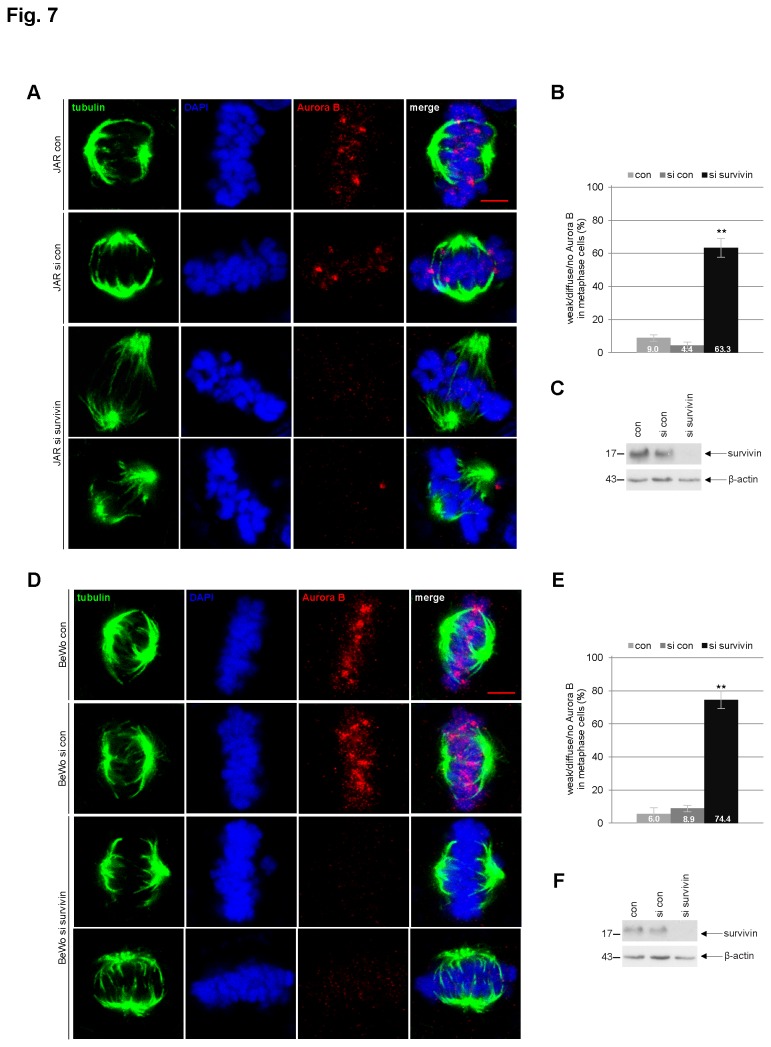
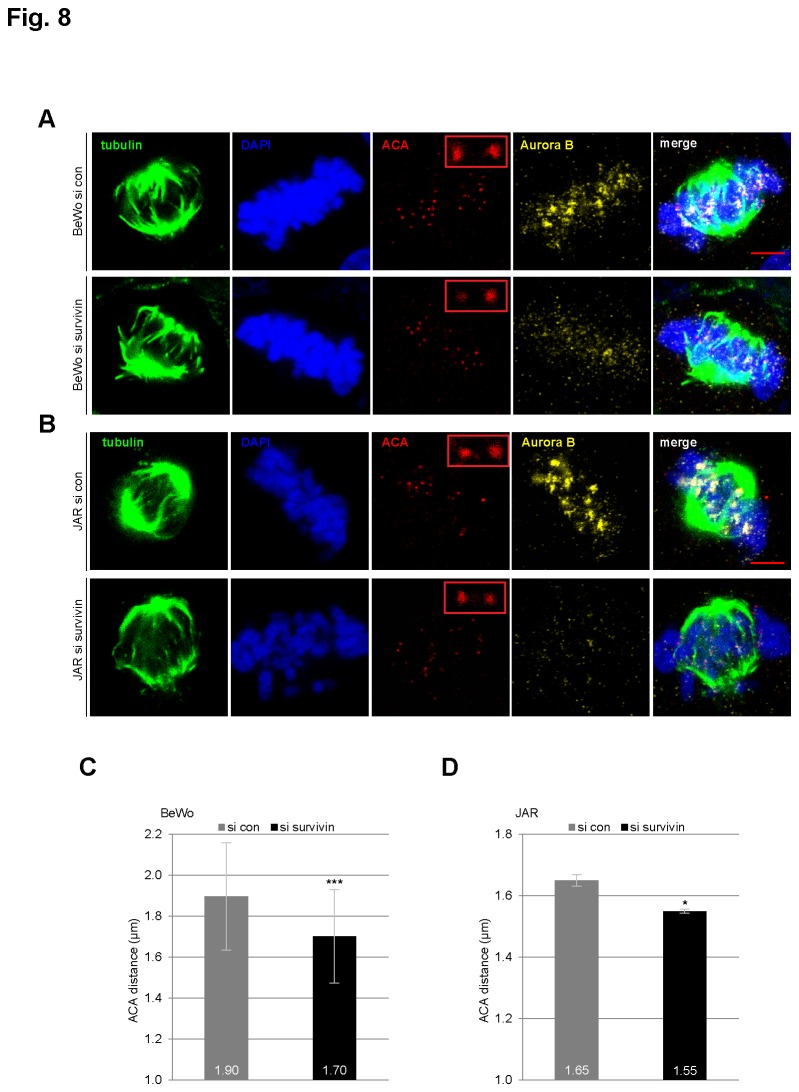
Results: The survivin gene is reduced but the protein amount is hardly changed in preeclamptic placentas, compared to control placentas. Upon stress, survivin in trophoblastic cells is phosphorylated on its residue serine 20 by protein kinase A and becomes stabilized, accompanied by increased heat shock protein 90. Depletion of survivin induces chromosome misalignment, abnormal centrosome integrity, and reduced localization and activity of Aurora B at the centromeres/kinetochores in trophoblastic metaphase cells.

Conclusions: Our data indicate that survivin plays pivotal roles in cell survival and proliferation of trophoblastic cells. Further investigations are required to define the function of survivin in each cell type of the placenta in the context of proliferation, differentiation, apoptosis, angiogenesis, migration and invasion.


Conflict of interest statement

Competing Interests: The authors have declared that no competing interests exist.

Figures

Figure 1
Figure 1. Survivin gene is reduced in preeclamptic placentas.
(A) Relative amount of the gene survivin in preeclamptic placentas (PE, n=16), in comparison with control placentas (n=16). The results are presented by mean of RQ with minimum and maximum range and statistically analyzed between control and PE group. *p < 0.05. RQ: relative quantification of fold by setting the control value as 1, as described in the Materials and Methods section. The RQ value of the control group is omitted and served just as a benchmark. (B) Individual expression levels of the survivin gene in both preeclampsia and control groups, represented by ΔCt values, which are normalized to endogenous controls and are reversely related to the amount of target molecules, as described in the Materials and Methods section. Bar: median value.
Figure 2
Figure 2. Survivin protein is comparable between preeclampsia and control group and is located in the nucleus.
(A) Western blot analysis of control placentas (con, n=16) and preeclamptic placentas (PE, n=16). The representatives are shown. (B) Quantification of the relative amounts of survivin protein in the control group and in the preeclampsia group from Western blot analysis. Bar: standard deviation (± SD). (C) The representatives of immunohistochemical staining with survivin antibody in preeclampsia placentas (a and b) and in control placentas (c and d). Open arrowheads and closed arrowheads indicate some of stained syncytiotrophoblasts and cytotrophoblasts, respectively. Immunohistochemical stainings with control IgG or survivin antibody neutralized with corresponding peptide are presented as controls (e and f). Scale bar: 10 µm. (D) Clear signals of survivin in syncytial sprout cells (black arrows in a, magnification of Figure 2C, a) and signals in syncytial knots (black arrows in b). Scale bar: 10 µm. (E) Quantification of positive cells of survivin staining in 7 placenta samples from PE patients and 7 samples from matched controls (n=1500 cells per cell type). CT: villous cytotrophoblasts. ST: syncytiotrophoblasts. Sprouts/knots: syncytial sprout cells and syncytial knots. Bar: ± SD. (F) Quantification of survivin positive rate using HScore method, as described in the Materials and Methods section, in villous cytotrophoblasts (CT) and syncytiotrophoblasts (ST). Bar: ± SD. con: control placenta. PE: preeclamptic placenta. (G) Western blot analysis using cytosol (C) or nuclear extracts (N) from placentas. Lamin B1 served as nuclear extract marker.
Figure 3
Figure 3. Survivin is stabilized and protects trophoblastic cells from apoptosis upon stress.
(A) Western blot analysis. JAR cells were treated with 10 µM H2O2 and cellular lysates were prepared at 0, 4, 6, 8 and 10 h for Western blot analysis using antibodies as indicated. β-actin served as loading control. (B) Gene levels of survivin and Aurora B. Cells were treated as in (A) for 6 h and total RNA was isolated for real-time PCR analysis. The results are based on three independent experiments and presented as mean ± SEM. The RQ value of the untreated control cells is omitted and served just as a benchmark. (C) Immunofluorescence staining. JAR cells were treated with H2O2 for 6 h, fixed and stained for tubulin, survivin and DNA. Scale bar: 5 µm. (D) BeWo cells were treated with 20 µM forskolin for 0, 2, 4, 6, 8 and 10 h and cellular extracts were prepared for Western blot analysis with indicated antibodies. β-actin served as loading control. (E) Western blot analysis. JAR cells were non-treated (con), treated with scrambled siRNA (si con) or with siRNA targeting survivin (2.5, 7.5 and 10 nM) for 18 h and were then challenged with 10 µM H2O2 for additional 12 h. Cellular lysates were prepared for Western blot analysis with indicated antibodies. β-actin served as loading control. (F) Relative activity of caspase-3/7. The lysates from JAR cells treated as in (F) were used for evaluating caspase-3/7 activity. The results are presented as mean ± SD. (G) Western blot analysis. Primary trophoblasts were isolated from term placentas and stimulated with indicated concentrations of H2O2 for 6 h and cellular lysates were prepared for Western blot analyses with antibodies as indicated. β-actin served as loading control. (H) Western blot analysis. Isolated term primary trophoblasts were treated with increasing concentrations of forskolin for 8 h and cellular extracts were prepared for Western blot analyses with indicated antibodies. β-actin served as loading control.
Figure 4
Figure 4. Survivin is required for the proliferation of trophoblastic cells and depletion induces a G2/M arrest.
(A) Cell viability assay. JAR (left panel), BeWo (middle panel) and HTR-8/SVneo (HTR, right panel) cells were non-treated (con), treated with either control scrambled siRNA (si con) or siRNA targeting survivin (si survivin) and cell viability was analyzed at indicated time points. Bar: ± SD. (B) Cell cycle profiles. Cells were depleted of survivin for 48 h and cell cycle analysis was performed. con: untreated cells as control. si con: treated with control scrambled siRNA. si survivin: treated with siRNA against survivin. Right panels: quantification of the sub-phases of the cell cycle. (C) Western blot analysis. BeWo cells were transfected with scrambled siRNA (si con) or siRNA targeting survivin (si survivin) for 24 h or 48 h and cellular extracts were prepared for Western blot analysis using indicated antibodies. β-actin served as loading control. con: non-treated lysates as control. (D) Relative caspase-3/7 activity. The lysates from JAR or BeWo cells treated as in (C) were used for evaluating caspase-3/7 activity. The results are presented as mean ± SD.
Figure 5
Figure 5. Trophoblastic cells are affected by survivin suppressant YM155.
(A) Western blot analysis. JAR cells were treated with increasing concentrations of YM155 for 24 h and cellular extracts were prepared for Western blot analysis. β-actin served as loading control. Untreated (con) and DMSO treated cellular extracts were taken as controls. (B) Cell cycle profiles. Cells were treated as in (A) and cell cycle analysis was performed. DMSO treated cells were taken as controls. (C) Quantification of the sub-phases of the cell cycle. (D) Relative caspase-3/7 activity. The lysates from JAR cells treated with DMSO or 10, 20 and 30 nM YM155 for 24 h were used for evaluating caspase-3/7 activity. The results are presented as mean ± SD. (E) Cell viability assay. JAR cells were non-treated (con), treated with DMSO or with increasing concentrations of YM155 for 24 h and cell viability was analyzed. Bar: ± SD.
Figure 6
Figure 6. Survivin is required for chromosome alignment and centrosome integrity in trophoblastic cells.
(A) BeWo cells were untreated (1st panel), treated with scrambled siRNA (si con, 2nd panel) or siRNA against survivin (si survivin, 3rd to 6th panels) for 36 h. Cells were then fixed and stained for tubulin, pericentrin and DNA, and analyzed by confocal laser scanning microscopy. Scale bar: 5 µm. Arrow: indicating either chromosome congression defect (DAPI staining) or failure of centrosome integrity (pericentrin staining). (B) Quantification of defects in chromosome congression in metaphase cells treated as in (A) (n=150 metaphase cells per condition). The results are presented as mean ± SD and statistically analyzed between siRNA control and siRNA survivin group. **p < 0.01. (C) Quantification of abnormal centrosomes in metaphase cells treated as in (A) (n=150 metaphase cells per condition). The results are presented as mean ± SD and statistically analyzed between siRNA control and siRNA survivin group. **p < 0.01. (D) The same experiments were also performed with JAR cells. Quantification of defect in chromosome congression in JAR metaphase cells treated as in (A) (n=150 metaphase cells per condition). The results are presented as mean ± SD and statistically analyzed between siRNA control and siRNA survivin group. ***p < 0.001. (E) Quantification of abnormal centrosomes in JAR metaphase cells treated as in (A) (n=150 metaphase cells per condition). The results are presented as mean ± SD and statistically analyzed between siRNA control and siRNA survivin group. **p < 0.01.
Figure 7
Figure 7. Localization of Aurora B at the centromeres/kinetochores is reduced after depletion of survivin.
(A) JAR cells were untreated (1st panel), treated with scrambled siRNA (si con, 2nd panel) or siRNA against survivin (si survivin, 3rd and 4th panels) for 36 h. Cells were then stained for tubulin, DNA and Aurora B, and analyzed by confocal laser scanning microscopy. Scale bar: 5 µm. (B) Quantification of weak/no staining of Aurora B in metaphase cells treated as in (A) (n=90 metaphase cells per condition). The results are presented as mean ± SD and statistically analyzed between control and siRNA survivin group. **p < 0.01. (C) Western blot analysis as siRNA efficiency control. β-actin served as loading control. (D) BeWo cells were untreated (con, 1st panel), treated with scrambled siRNA (si con, 2nd panel) or siRNA against survivin (si survivin, 3rd and 4th panels) for 36 h. Cells were then stained for tubulin, Aurora B and DNA, and analyzed by confocal laser scanning microscopy. Scale bar: 5 µm. (E) Quantification of weak/no staining of Aurora B in BeWo metaphase cells treated as in (D) (n=90 metaphase cells per condition). The results are presented as mean ± SD and statistically analyzed between control and siRNA survivin group. **p < 0.01. (F) Western blot analysis as siRNA efficiency control. β-actin served as loading control.
Figure 8
Figure 8. The distance of the sister centromeres is reduced in trophoblastic cells depleted of survivin.
(A) BeWo cells were treated with scrambled siRNA (si con, upper panel) or siRNA against survivin (si survivin, lower panel) for 36 h. Cells were then stained for tubulin, DNA, the centromere with anti-centromere antibody (ACA) and Aurora B. The stained metaphase cells were analyzed by confocal laser scanning microscopy. Scale bar: 5 µm. Insets show representative sister centromeres with four fold magnification. (B) JAR cells were treated with scrambled siRNA (si con, upper panel) or siRNA against survivin (si survivin, lower panel) for 36 h. Cells were then stained for tubulin, DNA, the centromere with ACA and Aurora B. The stained metaphase cells were analyzed by confocal laser scanning microscopy. Scale bar: 5 µm. Insets show representative sister centromeres with four fold magnification. (C) Evaluation of the distance of the sister centromeres in BeWo cells. Cells were treated as in (A) and the length of paired ACA staining was evaluated (n=52 pairs per condition) with LAS AF software. The results are presented as mean ± SD and statistically analyzed between siRNA control and siRNA survivin group. ***p < 0.001. (D) Evaluation of the distance between sister centromeres in JAR cells. Cells were treated as in (B) and the length of paired ACA staining was evaluated (n=50 pairs per condition) with LAS AF software. The results based on three independent experiments are presented as mean ± SEM and statistically analyzed between siRNA control and siRNA survivin group. *p < 0.05.

Similar articles

Cited by

References

    1. Altieri DC (2008) Survivin, cancer networks and pathway-directed drug discovery. Nat Rev Cancer 8: 61-70. doi:10.1038/nrc2293. PubMed: 18075512. - DOI - PubMed
    1. Mita AC, Mita MM, Nawrocki ST, Giles FJ (2008) Survivin: key regulator of mitosis and apoptosis and novel target for cancer therapeutics. Clin Cancer Res 14: 5000-5005. doi:10.1158/1078-0432.CCR-08-0746. PubMed: 18698017. - DOI - PubMed
    1. Vaira V, Lee CW, Goel HL, Bosari S, Languino LR et al. (2007) Regulation of survivin expression by IGF-1/mTOR signaling. Oncogene 26: 2678-2684. doi:10.1038/sj.onc.1210094. PubMed: 17072337. - DOI - PubMed
    1. Oh SH, Jin Q, Kim ES, Khuri FR, Lee HY (2008) Insulin-like growth factor-I receptor signaling pathway induces resistance to the apoptotic activities of SCH66336 (lonafarnib) through Akt/mammalian target of rapamycin-mediated increases in survivin expression. Clin Cancer Res 14: 1581-1589. doi:10.1158/1078-0432.CCR-07-0952. PubMed: 18316583. - DOI - PubMed
    1. Guha M, Altieri DC (2009) Survivin as a global target of intrinsic tumor suppression networks. Cell Cycle 8: 2708-2710. doi:10.4161/cc.8.17.9457. PubMed: 19717980. - DOI - PMC - PubMed

LinkOut - more resources