. 2013 Sep 17;8(9):e73411.
doi: 10.1371/journal.pone.0073411. eCollection 2013.

Cross-link guided molecular modeling with ROSETTA

Affiliations

Cross-link guided molecular modeling with ROSETTA

Abdullah Kahraman et al. PLoS One. .

Abstract

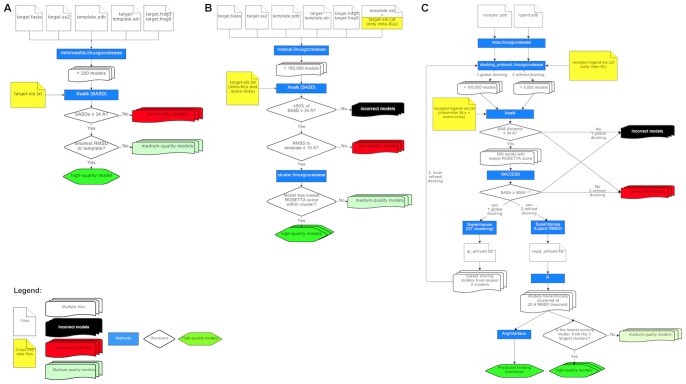
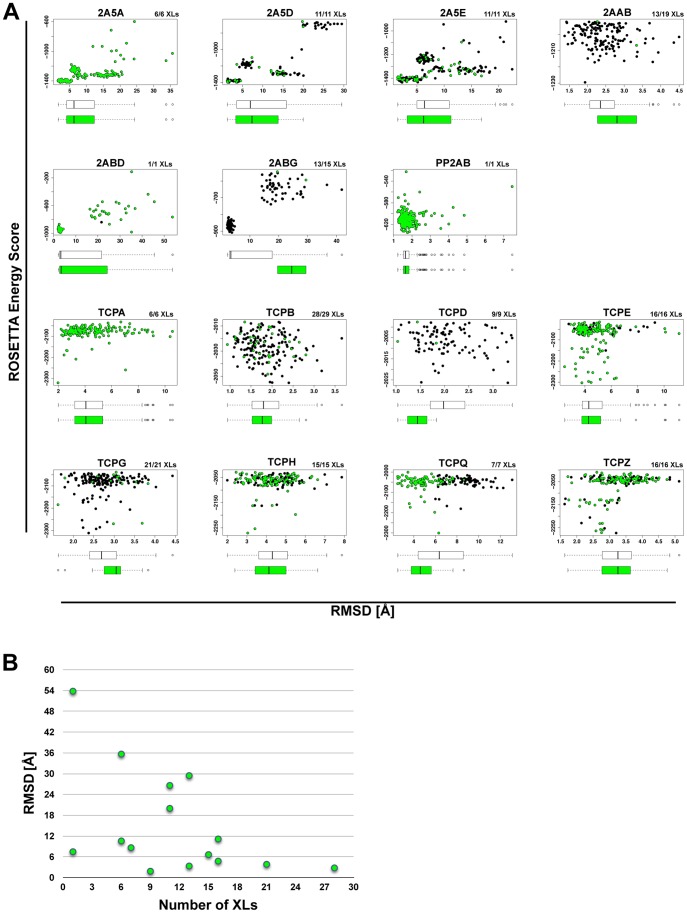
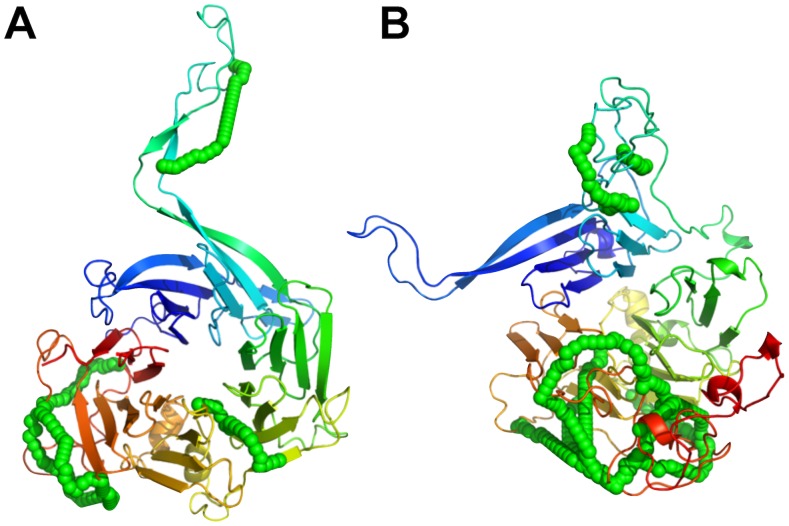
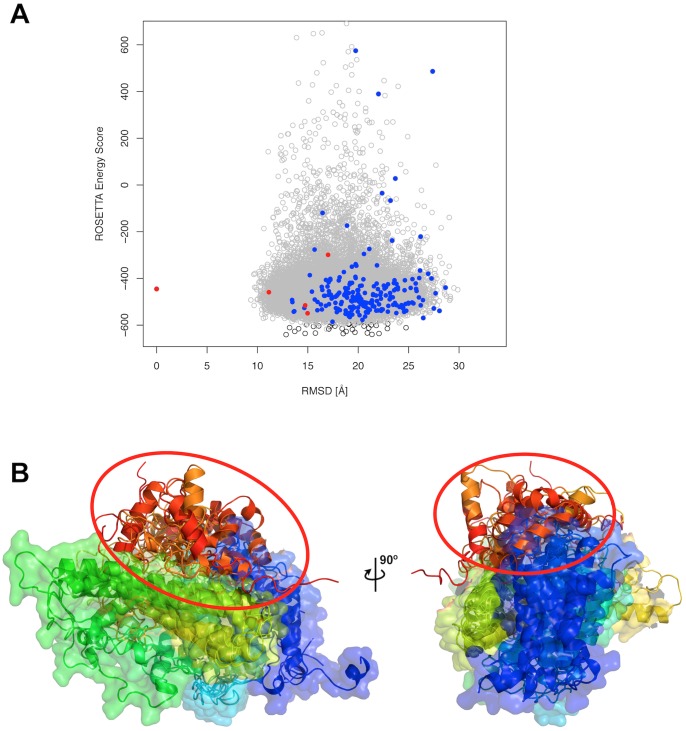
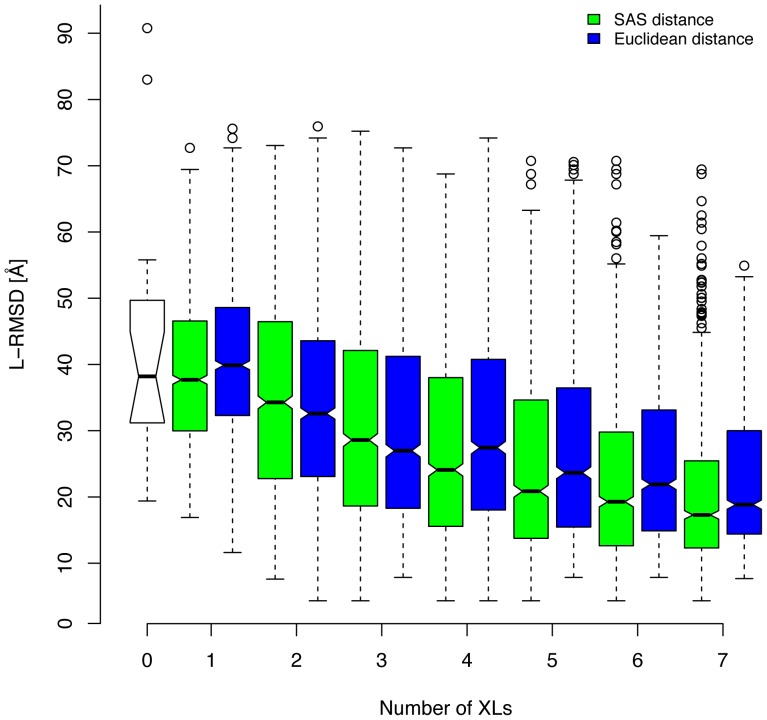
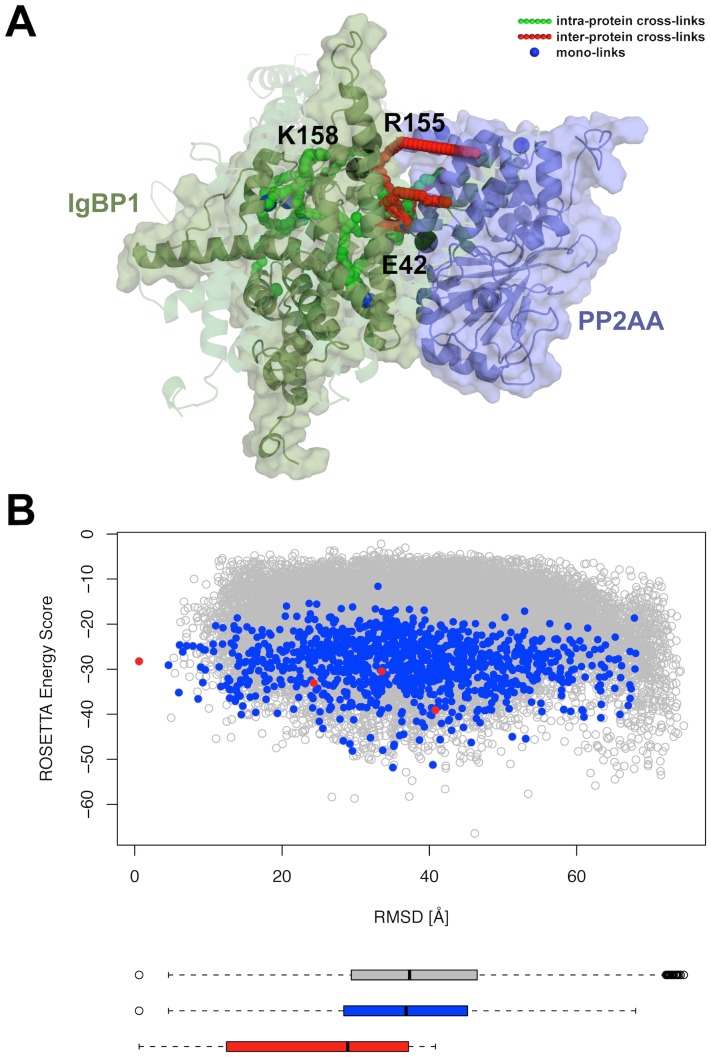
Chemical cross-links identified by mass spectrometry generate distance restraints that reveal low-resolution structural information on proteins and protein complexes. The technology to reliably generate such data has become mature and robust enough to shift the focus to the question of how these distance restraints can be best integrated into molecular modeling calculations. Here, we introduce three workflows for incorporating distance restraints generated by chemical cross-linking and mass spectrometry into ROSETTA protocols for comparative and de novo modeling and protein-protein docking. We demonstrate that the cross-link validation and visualization software Xwalk facilitates successful cross-link data integration. Besides the protocols we introduce XLdb, a database of chemical cross-links from 14 different publications with 506 intra-protein and 62 inter-protein cross-links, where each cross-link can be mapped on an experimental structure from the Protein Data Bank. Finally, we demonstrate on a protein-protein docking reference data set the impact of virtual cross-links on protein docking calculations and show that an inter-protein cross-link can reduce on average the RMSD of a docking prediction by 5.0 Å. The methods and results presented here provide guidelines for the effective integration of chemical cross-link data in molecular modeling calculations and should advance the structural analysis of particularly large and transient protein complexes via hybrid structural biology methods.


Conflict of interest statement

Competing Interests: The authors have declared that no competing interests exist.

Figures

Figure 1
Figure 1. Computational workflows for cross-link guided molecular modeling centered on ROSETTA protocols and Xwalk software.
(A) Comparative modeling. (B) De novo modeling with partial structural information. (C) Protein-protein docking. Flowcharts were generated using https://www.draw.io.
Figure 2
Figure 2. Comparative modeling calculations and chemical cross-link data validation on 15 proteins from the PP2A interaction network.
(A) ROSETTA energy score versus RMSD plots for all proteins. Template structures (see Table 1) served as a reference for the RMSD calculations. Green colored dots highlight those models that satisfy most chemical cross-links; their numbers are indicated at the top right corner of each scatter plot. (B) For each protein from (A), only the model with the largest RMSD value is plotted demonstrating the prediction improvement with the increasing number of chemical cross-links.
Figure 3
Figure 3. Chemical cross-links on the regulatory subunit 2ABG of PP2A might have originated from a stable intermediate folding state.
(A) The comparative model that is most similar to its template structure 2ABA satisfies only 6 of 18 intra-protein cross-links. (B) In contrast, the comparative model that satisfies with 13 cross-links most of the cross-link data has a RMSD of 19.5 Å and is partially unfolded. Green chain of spheres indicate the shortest path between cross-linked lysine pairs that have an SAS distance ≤34.0 Å.
Figure 4
Figure 4. Localization of the C-terminal domain of IgBP1 with chemical cross-link data.
(A) ROSETTA energy score versus RMSD plot for full-length models of IgBP1, with one of the best models acting as a reference structure for the RMSD calculation. Only models below an energy score of 650 are shown. Grey empty circles are models that satisfy more than 60 cross-links by Euclidean distance measure. Blue circles depict models that satisfy more than 60 cross-links by means of the SAS distance measure. The five red circles have been chosen as best models with RMSD ≤10.0 Å to the N-terminal template structure of mouse IgBP1 (PDB-ID: 3QC1). (B) Structure of the five best models. The structures are colored from blue to red between the N and C-terminus. The models were superimposed on their N-terminal domain highlighting the co-location of their C-terminal domain.
Figure 5
Figure 5. Box plots showing the improvement of the docking predictions with an increasing number of cross-links (XLs).
The data was collected on 16 protein complexes that were docked using 100 random selections of 1 to 7 virtual cross-links. For each random selection the model satisfying all cross-links and having the shortest mean cross-link distance was selected and its ligand RMSD (L-RMSD) value selected for plotting. Distances were measured with the Solvent Accessible Surface (SAS) distance (green boxes) or the Euclidean distance (blue boxes). White box corresponds to blind docking without distance restraints.
Figure 6
Figure 6. Prediction of the IgBP1-PP2AA protein topology using 7 inter-protein cross-links, 11 intra-protein cross-links and 10 mono-links.
(A) Structural model of the lowest scoring models from the 4 largest clusters, showing the PP2AA protein in purple color and the IgBP1 protein in dark green color. The solid cartoon representation corresponds to the cluster representative of the largest cluster, while the transparent IgBP1 models are cluster representatives of the 2nd, 3rd and 4th largest cluster. Intra-links with their shortest SAS distance path are shown as green colored chains of spheres, inter-links are shown in red and mono-links are highlighted as blue spheres. In addition, black spheres indicate previously mutated amino acids that were shown to be involved in forming the interface of IgBP1 and PP2AA. (B) Overview of the ROSETTA energy scores for all models that satisfied at least 6 inter-protein cross-links by means of the Euclidean distance measure are shown as empty grey circles. The RMSD was calculated to the cluster representative of the largest cluster. Models satisfying at least 6 inter-protein cross-links by means of the SAS distance measure and having a binding interface size ≥900 Å2 are highlighted in blue, while the cluster representatives of the 4 largest clusters are highlighted as red colored circles.

References

    1. Zhang QC, Petrey D, Deng L, Qiang L, Shi Y, et al... (2012) Structure-based prediction of protein–protein interactions on a genome-wide scale. Nature. doi:10.1038/nature11503. - DOI - PMC - PubMed
    1. Wang X, Wei X, Thijssen B, Das J, Lipkin SM, et al. (2012) Three-dimensional reconstruction of protein networks provides insight into human genetic disease. Nat Biotechnol 30: 159–164 doi:10.1038/nbt.2106 - DOI - PMC - PubMed
    1. Edwards A (2009) Large-Scale Structural Biology of the Human Proteome. Annu Rev Biochem 78: 541–568 doi:10.1146/annurev.biochem.78.070907.103305 - DOI - PubMed
    1. Krissinel E, Henrick K (2007) Inference of macromolecular assemblies from crystalline state. J Mol Biol 372: 774–797. - PubMed
    1. Mosca R, Pons C, Fernández-Recio J, Aloy P (2009) Pushing Structural Information into the Yeast Interactome by High-Throughput Protein Docking Experiments. PLoS Comput Biol 5: e1000490 doi:10.1371/journal.pcbi.1000490 - DOI - PMC - PubMed

Publication types

Associated data

LinkOut - more resources