

NuChart: an R package to study gene spatial neighbourhoods with multi-omics annotations
- PMID: 24069388
- PMCID: PMC3777921
- DOI: 10.1371/journal.pone.0075146
NuChart: an R package to study gene spatial neighbourhoods with multi-omics annotations
Abstract
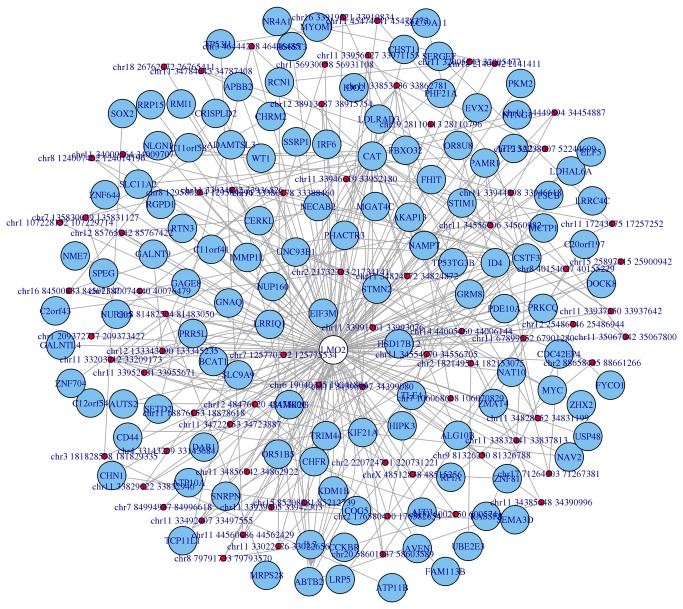
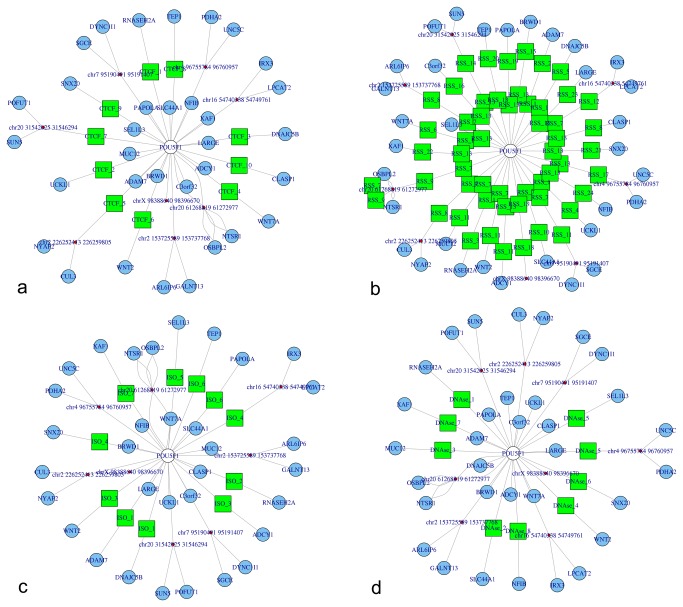
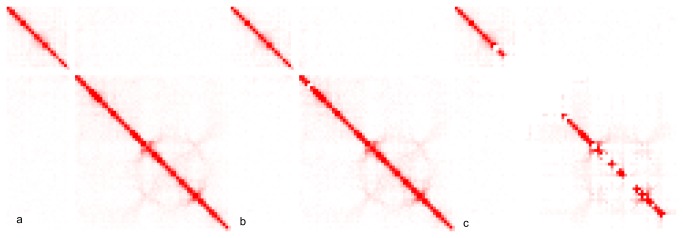
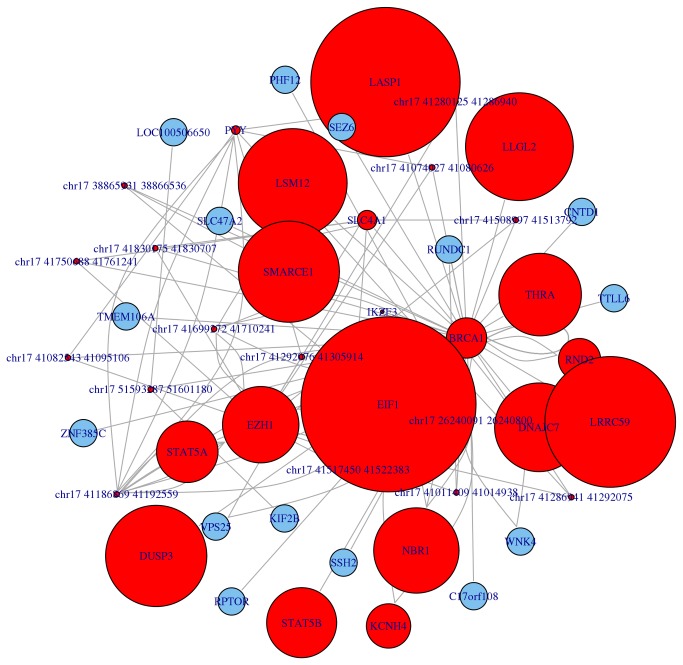
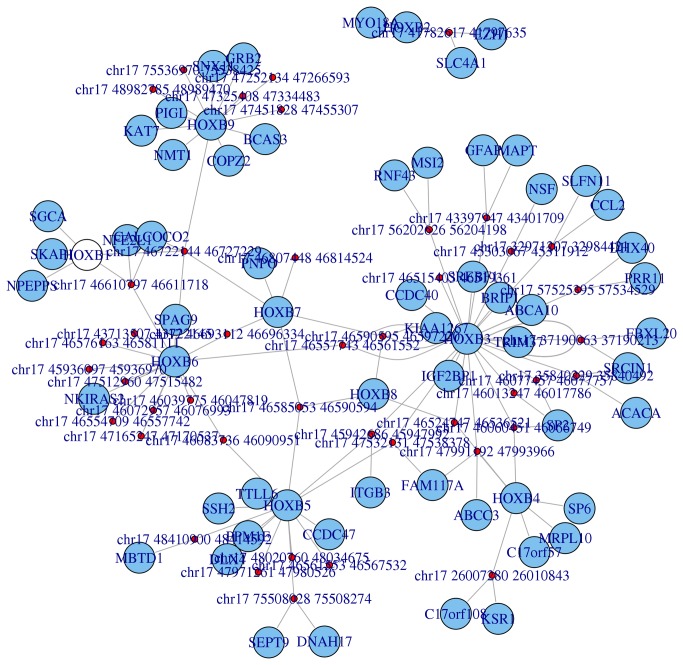
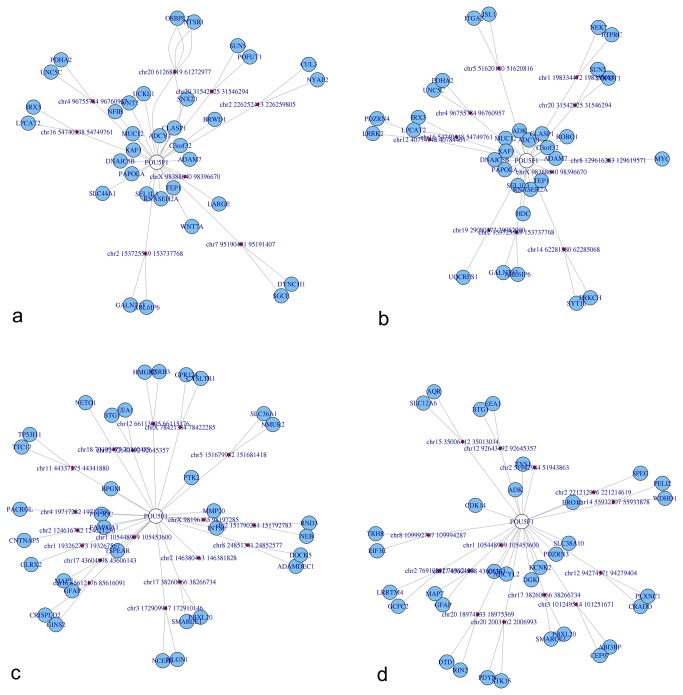
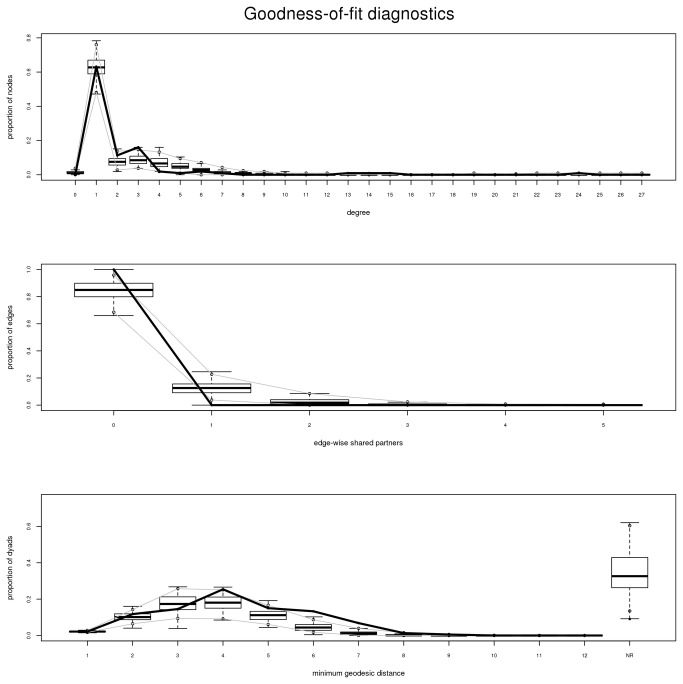
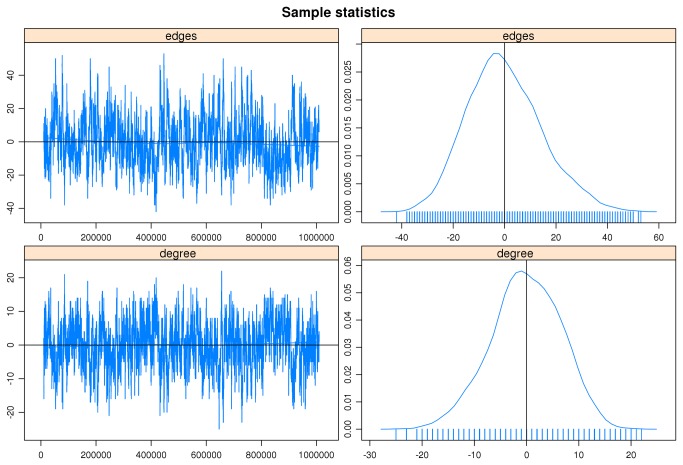
Long-range chromosomal associations between genomic regions, and their repositioning in the 3D space of the nucleus, are now considered to be key contributors to the regulation of gene expression and important links have been highlighted with other genomic features involved in DNA rearrangements. Recent Chromosome Conformation Capture (3C) measurements performed with high throughput sequencing (Hi-C) and molecular dynamics studies show that there is a large correlation between colocalization and coregulation of genes, but these important researches are hampered by the lack of biologists-friendly analysis and visualisation software. Here, we describe NuChart, an R package that allows the user to annotate and statistically analyse a list of input genes with information relying on Hi-C data, integrating knowledge about genomic features that are involved in the chromosome spatial organization. NuChart works directly with sequenced reads to identify the related Hi-C fragments, with the aim of creating gene-centric neighbourhood graphs on which multi-omics features can be mapped. Predictions about CTCF binding sites, isochores and cryptic Recombination Signal Sequences are provided directly with the package for mapping, although other annotation data in bed format can be used (such as methylation profiles and histone patterns). Gene expression data can be automatically retrieved and processed from the Gene Expression Omnibus and ArrayExpress repositories to highlight the expression profile of genes in the identified neighbourhood. Moreover, statistical inferences about the graph structure and correlations between its topology and multi-omics features can be performed using Exponential-family Random Graph Models. The Hi-C fragment visualisation provided by NuChart allows the comparisons of cells in different conditions, thus providing the possibility of novel biomarkers identification. NuChart is compliant with the Bioconductor standard and it is freely available at ftp://fileserver.itb.cnr.it/nuchart.
Conflict of interest statement
Figures
References
-
- Ling JQ, Hoffman AR (2007) Epigenetics of Long-Range Chromatin Interactions. Pediatr Res 61: 11R–16R. doi:10.1203/pdr.0b013e31804575db. PubMed: 17413850. - DOI - PubMed
-
- Schneider R, Grosschedl R (2007) Dynamics and interplay of nuclear architecture, genome organization, and gene expression. Genes Dev 21: 3027-3043. doi:10.1101/gad.1604607. PubMed: 18056419. - DOI - PubMed
-
- Phillips-Cremins JE, Corces VG (2013) Chromatin Insulators: Linking Genome Organization to Cellular Function. Mol Cell 50(4): 461-474. doi:10.1016/j.molcel.2013.04.018. PubMed: 23706817. - DOI - PMC - PubMed
-
- Dekker J, Rippe K, Dekker M, Kleckner N (2002) Capturing chromosome conformation. Science 295: 1306–1311. doi:10.1126/science.1067799. PubMed: 11847345. - DOI - PubMed
-
- Tolhuis B, Palstra RJ, Splinter E, Grosveld F, de Laat W (2002) Looping and interaction between hypersensitive sites in the active β-globin locus. Mol Cell 10: 1453–1465. doi:10.1016/S1097-2765(02)00781-5. PubMed: 12504019. - DOI - PubMed
Publication types
MeSH terms
LinkOut - more resources
Full Text Sources
Other Literature Sources
