. 2013 Oct 15;85(20):9713-20.
doi: 10.1021/ac402118a. Epub 2013 Sep 26.

DNA detection using origami paper analytical devices

Affiliations

DNA detection using origami paper analytical devices

Karen Scida et al. Anal Chem. .

Abstract

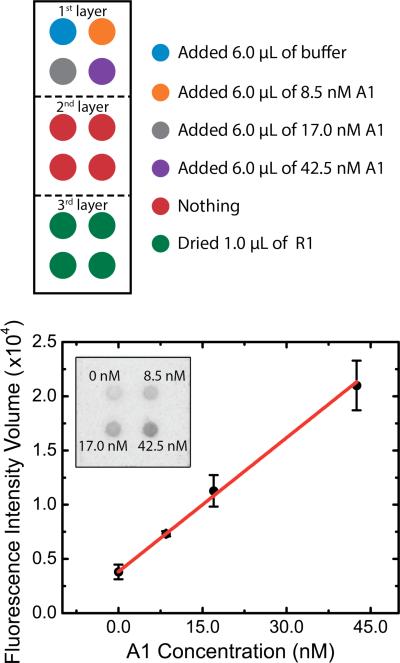
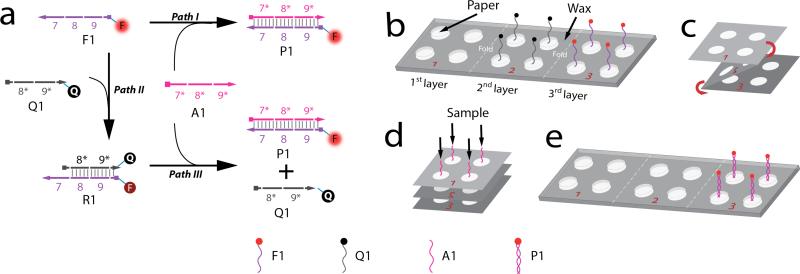
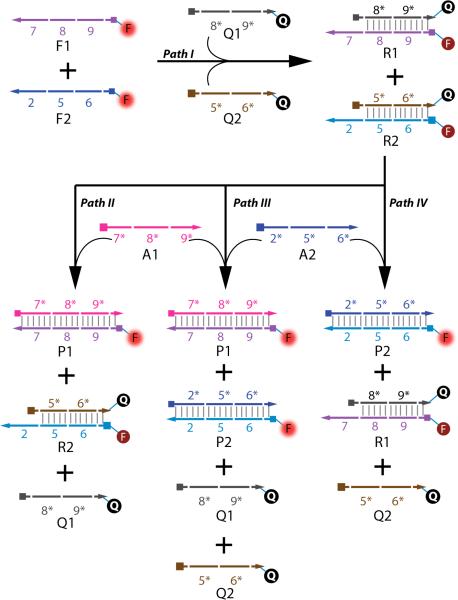
We demonstrate the hybridization-induced fluorescence detection of DNA on an origami-based paper analytical device (oPAD). The paper substrate was patterned by wax printing and controlled heating to construct hydrophilic channels and hydrophobic barriers in a three-dimensional fashion. A competitive assay was developed where the analyte, a single-stranded DNA (ssDNA), and a quencher-labeled ssDNA competed for hybridization with a fluorophore-labeled ssDNA probe. Upon hybridization of the analyte with the fluorophore-labeled ssDNA, a linear response of fluorescence vs analyte concentration was observed with an extrapolated limit of detection <5 nM and a sensitivity relative standard deviation as low as 3%. The oPAD setup was also tested against OR/AND logic gates, proving to be successful in both detection systems.


Figures

Figure 1
Figure 1
Strand displacement-induced fluorescence detection of ssDNA for Case 1. Top: Color-coded schematic representation of reagent placement on the oPAD. Bottom: Plot of fluorescence intensity volume (FIV) as a function of the concentration of A1. The inset is the fluorescence image of the third oPAD layer showing, qualitatively, the dependence of the FIV on A1 concentration. Note that the error bars for the data points correspond to standard deviations obtained by performing experiments on three different oPADs on the same day.
Figure 2
Figure 2
Strand displacement-induced fluorescence detection of ssDNA for Case 2. Top: Color-coded schematic representation of reagent placement on the oPAD. Bottom: Plot of fluorescence intensity volume (FIV) as a function of the concentration of A1. The inset is the fluorescence image of the third oPAD layer showing, qualitatively, the dependence of the FIV on A1 concentration. Note that the error bars for the data points correspond to standard deviations obtained by performing experiments on three different oPADs on the same day.
Figure 3
Figure 3
Strand displacement-induced fluorescence detection of DNA coupled to an oPAD-based OR gate. The device was passivated with BSA and all solutions added to the first oPAD layer contained 1.0 μM (dT)21 as an additional blocker. Top left: Color-coded schematic representation of the reagent placement on the oPAD. Top right: Truth table. Bottom left: Fluorescence image of the third oPAD layer showing the resulting fluorescence response upon addition of different inputs. Bottom right: Histogram of the fluorescence intensity volumes (FIV) measured at the third oPAD layer as a function of the input type. Note that the error bars for the histogram correspond to standard deviations obtained by performing experiments on three different oPADs on the same day.
Figure 4
Figure 4
Strand displacement-induced fluorescence detection of DNA coupled to oPAD-based AND gate. The device was passivated with BSA and all solutions added to the first oPAD layer contained 1.0 μM (dT)21 as an additional blocker. Top left: Color-coded schematic representation of the reagent placement on the oPAD. Top right: Truth table. Bottom left: Fluorescence image of the third oPAD layer showing the resulting fluorescence response upon addition of different inputs. Bottom right: Histogram of the fluorescence intensity volumes (FIV) measured at the third oPAD layer as a function of the input type. Note that the error bars for the histogram correspond to standard deviations obtained by performing experiments on three different oPADs on the same day.
Scheme 1
Scheme 1
Scheme 2
Scheme 2
Scheme 3
Scheme 3

References

    1. Dungchai W, Chailapakul O, Henry CS. Anal. Chim. Acta. 2010;674:227–233. - PubMed
    1. Ellerbee AK, Phillips ST, Siegel AC, Mirica KA, Martinez AW, Striehl P, Jain N, Prentiss M, Whitesides GM. Anal. Chem. 2009;81:8447–8452. - PubMed
    1. Shen L, Hagen JA, Papautsky I. Lab Chip. 2012;12:4240–4243. - PubMed
    1. Dungchai W, Chailapakul O, Henry CS. Anal. Chem. 2009;81:5821–5826. - PubMed
    1. Vella SJ, Beattie P, Cademartiri R, Laromaine A, Martinez AW, Phillips ST, Mirica KA, Whitesides GM. Anal. Chem. 2012;84:2883–2891. - PMC - PubMed

Publication types