. 2014 Feb 7;13(2):433-46.
doi: 10.1021/pr400539j. Epub 2013 Dec 12.

Characterization, design, and function of the mitochondrial proteome: from organs to organisms

Affiliations

Characterization, design, and function of the mitochondrial proteome: from organs to organisms

Christopher Lotz et al. J Proteome Res. .

Abstract

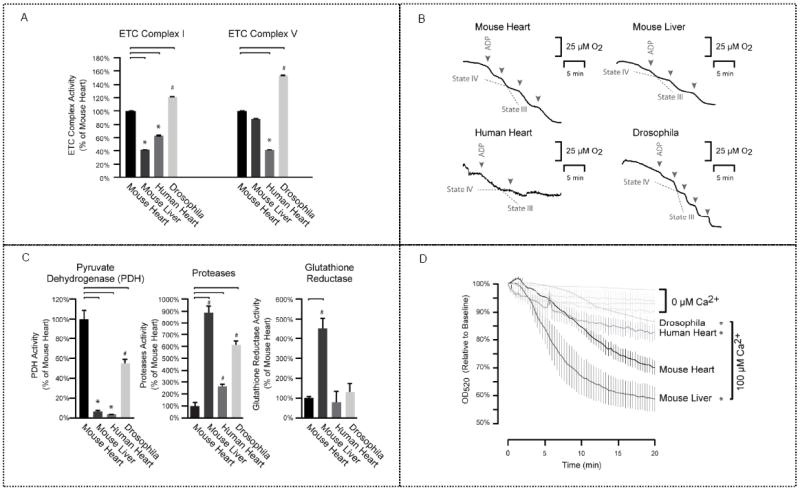
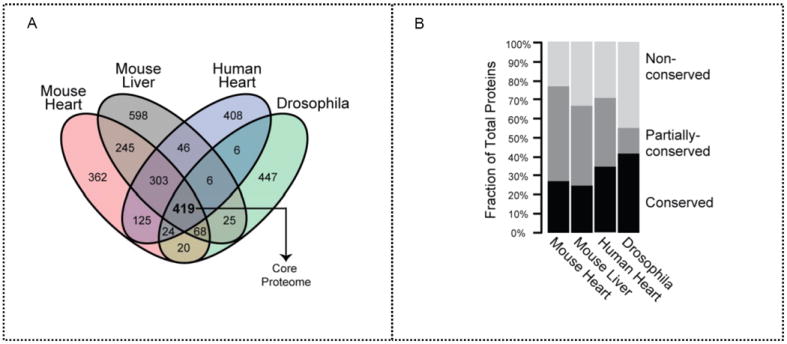
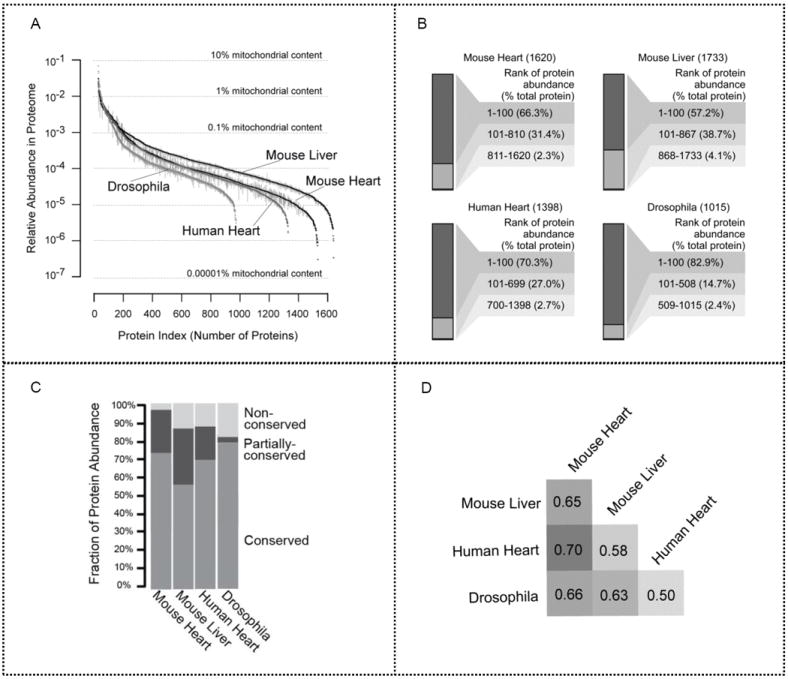
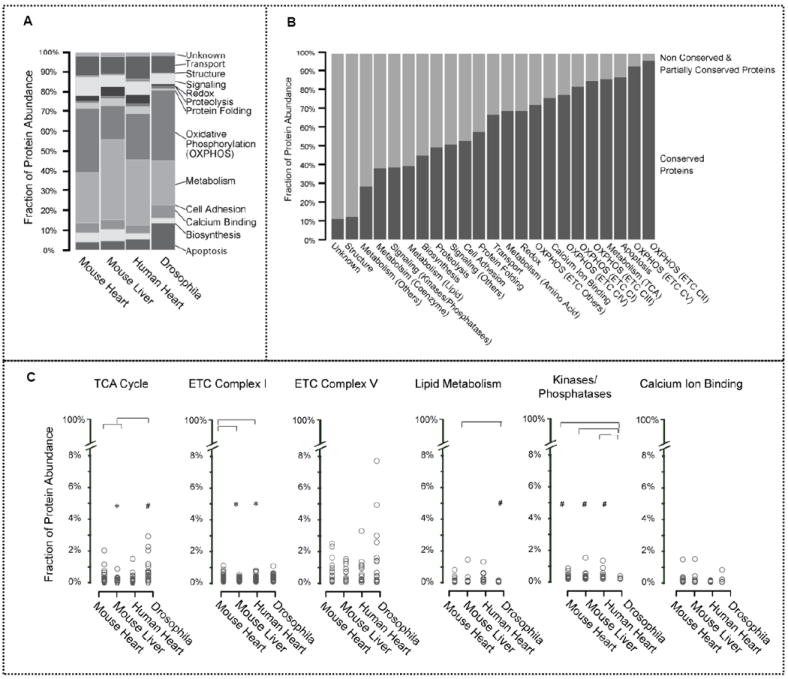
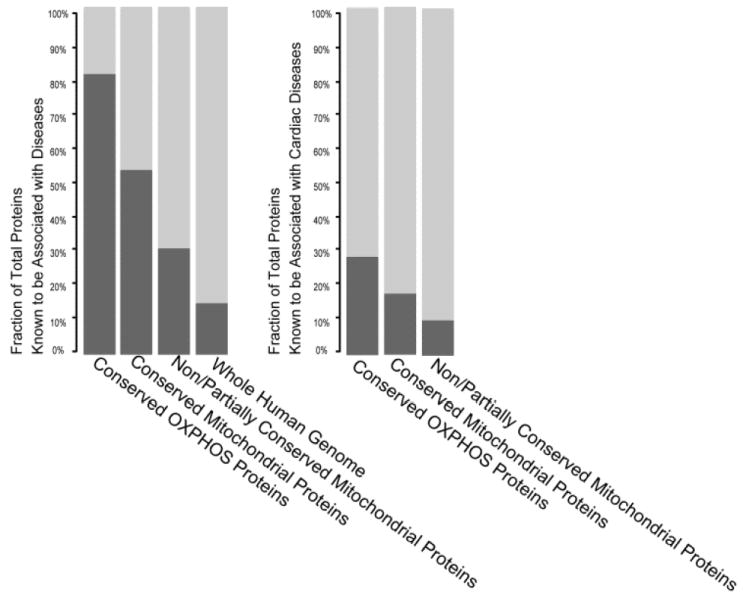
Mitochondria are a common energy source for organs and organisms; their diverse functions are specialized according to the unique phenotypes of their hosting environment. Perturbation of mitochondrial homeostasis accompanies significant pathological phenotypes. However, the connections between mitochondrial proteome properties and function remain to be experimentally established on a systematic level. This uncertainty impedes the contextualization and translation of proteomic data to the molecular derivations of mitochondrial diseases. We present a collection of mitochondrial features and functions from four model systems, including two cardiac mitochondrial proteomes from distinct genomes (human and mouse), two unique organ mitochondrial proteomes from identical genetic codons (mouse heart and mouse liver), as well as a relevant metazoan out-group (drosophila). The data, composed of mitochondrial protein abundance and their biochemical activities, capture the core functionalities of these mitochondria. This investigation allowed us to redefine the core mitochondrial proteome from organs and organisms, as well as the relevant contributions from genetic information and hosting milieu. Our study has identified significant enrichment of disease-associated genes and their products. Furthermore, correlational analyses suggest that mitochondrial proteome design is primarily driven by cellular environment. Taken together, these results connect proteome feature with mitochondrial function, providing a prospective resource for mitochondrial pathophysiology and developing novel therapeutic targets in medicine.


Conflict of interest statement

The authors declare no competing financial interest.

Figures

Figure 1
Figure 1
Mitochondrial functional characterization. (a) Electron production rate per microgram of mitochondrial proteins was analyzed to determine ETC complex activity and subsequently normalized to mouse cardiac mitochondria. Mouse liver mitochondria showed lower C–I activity and drosophila demonstrated higher C–I activity compared with the mouse heart. In addition, drosophila exhibited the highest C–V activity overall, with the lowest C–V activity in human heart mitochondria. These differences in respiratory flux and ATP generation can be attributed to cellular environment and genetic background. * or # represents p < 0.05 versus mouse heart; n = 4 per group. (b) RCI tracers are presented; they were measured as a ratio of the oxygen consumption rate by an initial O2 concentration of 220 mmol·L−1. Drosophila mitochondria were the most tightly coupled (RCI: 12.0), followed by the human heart (8.9), mouse heart (7.6), and mouse liver (7.0). A higher RCI value indicates tighter coupling of oxidation and phosphorylation processes. (c) Additional key enzymatic mitochondrial functions revealed similar intra- and intergenomic variability. Mouse liver mitochondria exhibited the highest proteolytic and glutathione reductase activities, whereas the mouse heart had the highest PDH activity, which may be explained by the altered production of reducing equivalents. * or # represents p < 0.05 versus mouse heart; n = 4 per group. (d) Calcium-induced mitochondrial swelling was measured as a reduction of optical density. Mouse liver mitochondria displayed the highest susceptibility to calcium-induced swelling. * represents p < 0.05 versus mouse heart with calcium overload; n = 4 per group.
Figure 2
Figure 2
Mitochondrial proteome composition among four mitochondrial populations. (a) Protein orthologs were analyzed for each model systems. The 419 proteins identified in all four model systems represent the conserved core mitochondrial proteome. (b) Proportions of conserved and nonconserved proteins by protein number were denoted in each proteome. Drosophila demonstrated the highest protein count ratio of both conserved and nonconserved proteins.
Figure 3
Figure 3
Mitochondrial proteome abundance. (a) Relative protein abundance was indexed based on NSAF values in descending order. The high dynamic range of protein expression levels for the mitochondrial proteome spans over five orders of magnitude. Error bar: SEM. (b) Proteins were ranked according to their abundance. The top 100 proteins in each model system are highly abundant and occupy a majority of the total mitochondrial protein content. The top 50% of each mitochondrial proteome accounts for over 95% of the total protein abundance, whereas the bottom 50% constitutes <4%. (c) The proportion of conserved, partially conserved, and unique proteins was illustrated in all four model systems. The conserved proteins are highly abundant, accounting for 72, 55, 68, and 78% of mitochondrial protein content in the mouse heart, the mouse liver, the human heart, and drosophila, respectively. Furthermore, nonconserved proteins in drosophila comprise the highest unique protein ratio among these organs and organisms, alluding to their specialized functionality. (d) Similarity in distribution of mitochondrial protein abundance was determined. Human heart and mouse heart mitochondrial protein abundance distribution levels are closely related, indicating that mitochondrial populations in the same organ of different species can demonstrate a stronger correlation than mitochondrial populations within different organs of the same organism. Moreover, mouse heart and mouse liver mitochondria had similar, but not identical distributions (ρ = 0.65).
Figure 4
Figure 4
Correlation between the mitochondrial proteome and its functions. (a) Mitochondrial protein abundances were categorized by biological function. The high-abundance clusters are enriched in oxidative phosphorylation, metabolism, and transport-related proteins. In particular, mouse liver has the highest abundance values within the metabolism cluster, highlighting a metabolic specialization. Moreover, these conserved proteins are highly abundant, representing 81.0% of mitochondrial protein content in mouse heart, 59.5% in mouse liver, 79.7% in human heart, and 86.4% in drosophila. (b) Mitochondrial proteins were characterized by biological processes. Conserved proteins and non/partially conserved proteins in each category were quantified. Proteins involved in OXPHOS were concentrated in C–II and C–V. Conserved proteins were also found to be highly involved in apoptosis and TCA metabolism. Structural, signaling, and proteolytic processes have higher proportions of nonshared proteins. (c) Relative fraction of the proteome involved in specified functional pathways was determined. Mitochondrial proteins were further classified through bioinformatics analyses based on their involvement in specific functional pathways and then plotted by their NSAF values. *p < 0.05 versus mouse heart. The mouse heart, human heart, and drosophila models have high TCA cycle protein abundances, while the mouse liver shows significantly lower protein abundances, denoting the differences in TCA cycle activity between contractile and noncontractile tissues. The mouse liver mitochondria also contained the lowest abundance of C–I proteins. C–V was not found to have a significant difference in overall protein abundance among the model systems. Notably, within each Complex, differential subunit abundances spanned over three orders of magnitude. Drosophila had considerably lower lipid metabolism protein abundances in comparison with mouse liver, implicating liver mitochondria as specialized in the synthesis and degradation of lipids. In addition, drosophila mitochondria possess the lowest abundance of kinase/phosphatase proteins, suggesting that there is less phosphorylation regulation. The abundance of calcium-binding proteins was similar across the model systems; this deviates from our previous finding that shows mouse liver is more susceptible to calcium-induced swelling, indicating limitations in direct connections between proteomics data and functionality. Statistical significance was determined with a Mann–Whitney U test.
Figure 5
Figure 5
Mitochondrial protein–protein interactome analysis. An interactome analysis of C–I, C–V, redox, C–I + redox, and C–V + redox proteins was performed, and the protein–protein interactions are displayed. Major hubs have been labeled by gene name. The size of each mitochondrial node represents the number of connections in the protein–protein interaction network, with larger nodes indicating more interactions. (a) C–I showed NDUFA2 as the primary human mitochondrial protein with the most connections. Mouse mitochondrial proteins mainly centralized around one partner protein, α-synuclein. In contrast, drosophila proteins did not exhibit a clustered pattern. Three C–V proteins in human mitochondria, ATP5A1, ATP5B, and ATP5C1, were more interactive than other C–V proteins; however, only ATP5B was categorized as a major hub in both mouse and drosophila. (b) Analysis of redox protein–protein interactions demonstrated similar patterns to C–I with human and mouse proteins assembled around a single protein, whereas drosophila presented dispersed partnerships among its proteins. (c) Moreover, examination of C–I + redox and C–V + redox revealed little interaction between these complex proteins and redox proteins. An exception to the pattern, ATP5B (in C–V), interacted with redox protein PRDX1 in the mouse mitochondria analysis. Finally, the mouse C–I + redox interactome revealed an intertwining C–I and redox protein interaction network, a feature unique to the mouse mitochondrial proteome. The series of interlocking C–I and redox proteins found in the mouse C–I + redox interactome have been circled by a dotted line.
Figure 5
Figure 5
Mitochondrial protein–protein interactome analysis. An interactome analysis of C–I, C–V, redox, C–I + redox, and C–V + redox proteins was performed, and the protein–protein interactions are displayed. Major hubs have been labeled by gene name. The size of each mitochondrial node represents the number of connections in the protein–protein interaction network, with larger nodes indicating more interactions. (a) C–I showed NDUFA2 as the primary human mitochondrial protein with the most connections. Mouse mitochondrial proteins mainly centralized around one partner protein, α-synuclein. In contrast, drosophila proteins did not exhibit a clustered pattern. Three C–V proteins in human mitochondria, ATP5A1, ATP5B, and ATP5C1, were more interactive than other C–V proteins; however, only ATP5B was categorized as a major hub in both mouse and drosophila. (b) Analysis of redox protein–protein interactions demonstrated similar patterns to C–I with human and mouse proteins assembled around a single protein, whereas drosophila presented dispersed partnerships among its proteins. (c) Moreover, examination of C–I + redox and C–V + redox revealed little interaction between these complex proteins and redox proteins. An exception to the pattern, ATP5B (in C–V), interacted with redox protein PRDX1 in the mouse mitochondria analysis. Finally, the mouse C–I + redox interactome revealed an intertwining C–I and redox protein interaction network, a feature unique to the mouse mitochondrial proteome. The series of interlocking C–I and redox proteins found in the mouse C–I + redox interactome have been circled by a dotted line.
Figure 6
Figure 6
Distribution of proteins with mitochondrial targeting sequences in the mitochondrial proteome. (a) The number of mitochondrial proteins with an N-terminal mitochondrial targeting sequence (MTS) within the mitochondrial proteome was examined. Only a small percentage of mitochondrial proteins carried an MTS. Mitochondrial proteins with an MTS accounted for 9.7% of the total mitochondrial proteome in drosophila, 19.9% in mouse heart, 20.7% in human heart, and 22.4% in mouse liver. (b) Analysis of the core proteins demonstrated a similar pattern of mitochondrial proteins with an MTS – 17.4% in drosophila, 37.9% in human heart, 48.7% in mouse liver, and 49.7% in mouse heart. This suggests that the mitochondrial proteins without N-terminal targeting sequences are utilizing alternative methods to localize in the mitochondria. (c) Number of core mitochondrial proteins with an MTS and without an MTS was determined by their different functionalities and subcellular localizations. A majority of the mitochondrial proteins with an MTS were involved in metabolism and biosynthesis and were found throughout the mitochondrion rather than a specific mitochondrial compartment. In contrast, mitochondrial proteins without an MTS were predominantly integral in metabolism and OXPHOS and were localized in other cellular regions. (d) While the abundance of core mitochondrial proteins with an MTS and core mitochondrial proteins without an MTS were both highly involved in metabolism, OXPHOS, apoptosis, and biosynthesis, the core mitochondrial proteins with an MTS were most abundant in the outer and inner mitochondrial membrane, whereas the core mitochondrial proteins without an MTS were most abundant in the inner mitochondrial membrane, intermembrane space, matrix, and other cellular locations.
Figure 7
Figure 7
Pathological phenotypes of the mitochondrial proteomes. The involvement of mitochondrial proteins as well as the OXPHOS subproteome in disease phenotypes (left) and cardiac disease phenotypes (right) was determined by literature curation using predefined search terms. Human disease-associated genes are more prominent within the conserved mitochondrial proteome, and dysfunction of conserved respiratory chain proteins is particularly detrimental with 54% of these proteins implicated in disease. In contrast, only 15% of the human genome is correlated with causing disorders. Among these, 27% of conserved OXPHOS proteins and 17% of conserved mitochondrial proteins are directly associated with cardiac disease. These results illustrate the importance of the core mitochondrial proteome to physiological functions.

References

    1. Johnson DT, Harris RA, Blair PV, Balaban RS. Functional consequences of mitochondrial proteome heterogeneity. Am J Physiol : Cell Physiol. 2007;292:C698–707. - PubMed
    1. Balaban RS. Regulation of oxidative phosphorylation in the mammalian cell. Am J Physiol. 1990:377–389. - PubMed
    1. Shao D, Oka S, Brady CD, Haendeler J, Eaton P, Sadoshima J. Redox modification of cell signaling in the cardiovascular system. J Mol Cell Cardiol. 2012;52:550–558. - PMC - PubMed
    1. Zhang J, Lin A, Powers J, Lam MP, Lotz C, Liem D, Lau E, Wang D, Deng N, Korge P, Zong NC, Cai H, Weiss J, Ping P. Perspectives on: Sgp symposium on mitochondrial physiology and medicine: Mitochondrial proteome design: From molecular identity to pathophysiological regulation. J Gen Physiol. 2012;139:395–406. - PMC - PubMed
    1. Gucek M, Murphy E. What can we learn about cardioprotection from the cardiac mitochondrial proteome? Cardiovasc Res. 2010;88:211–218. - PMC - PubMed

Publication types