. 2013 Oct;45(10):1127-33.
doi: 10.1038/ng.2762.

Emerging landscape of oncogenic signatures across human cancers

Affiliations

Emerging landscape of oncogenic signatures across human cancers

Giovanni Ciriello et al. Nat Genet. 2013 Oct.

Abstract

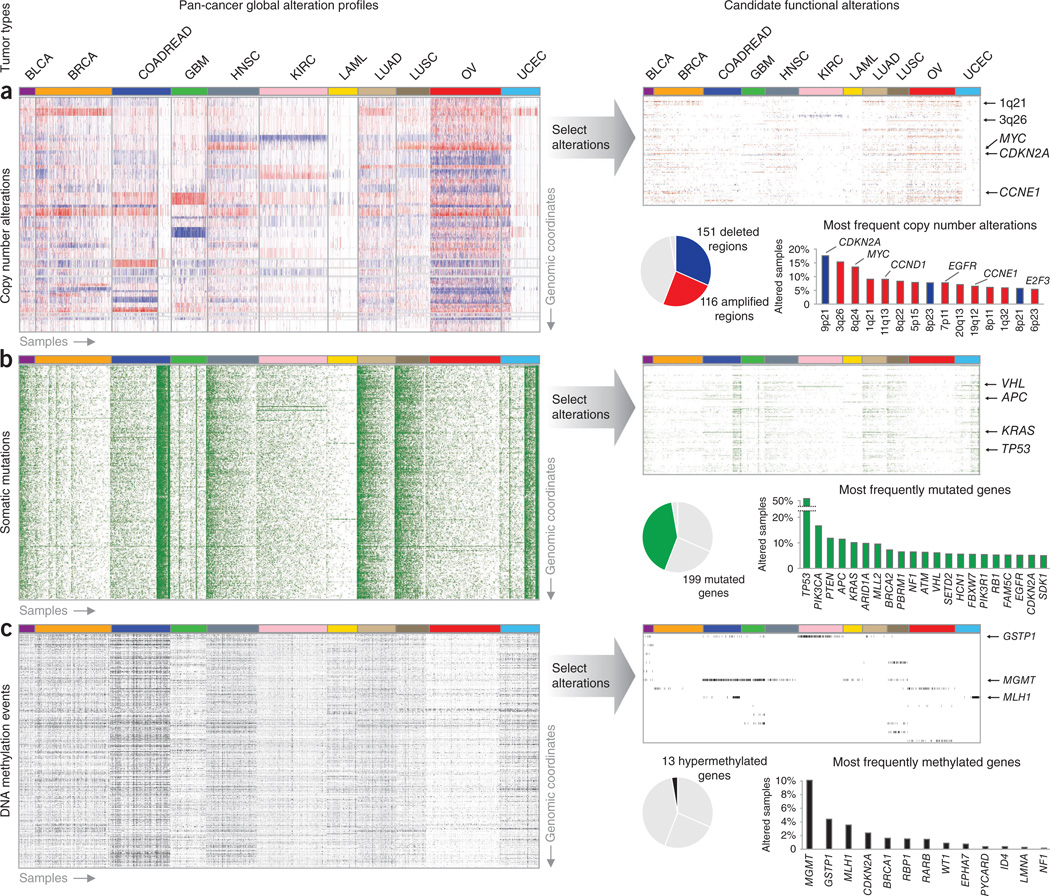
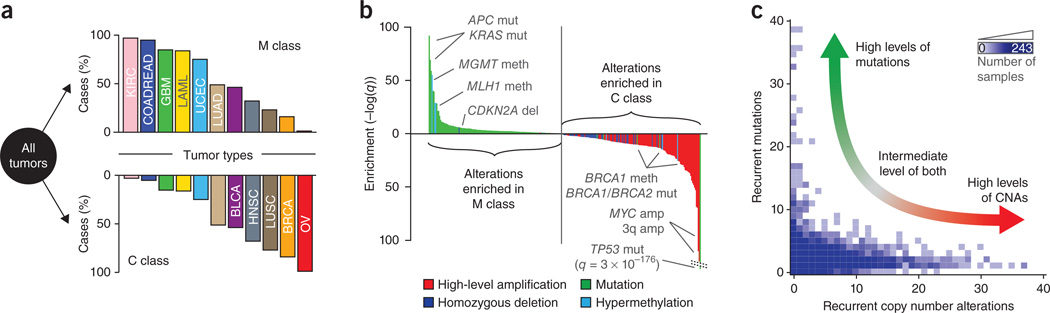
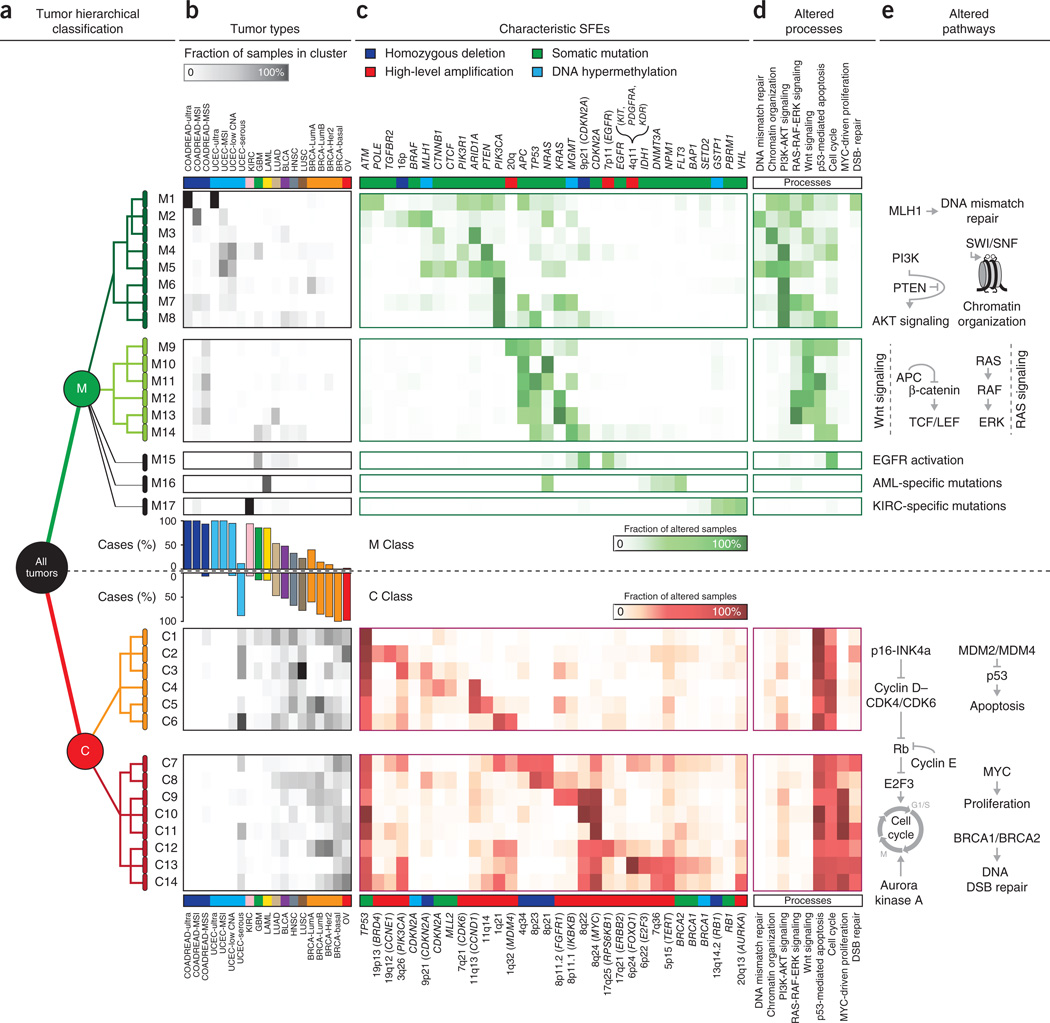
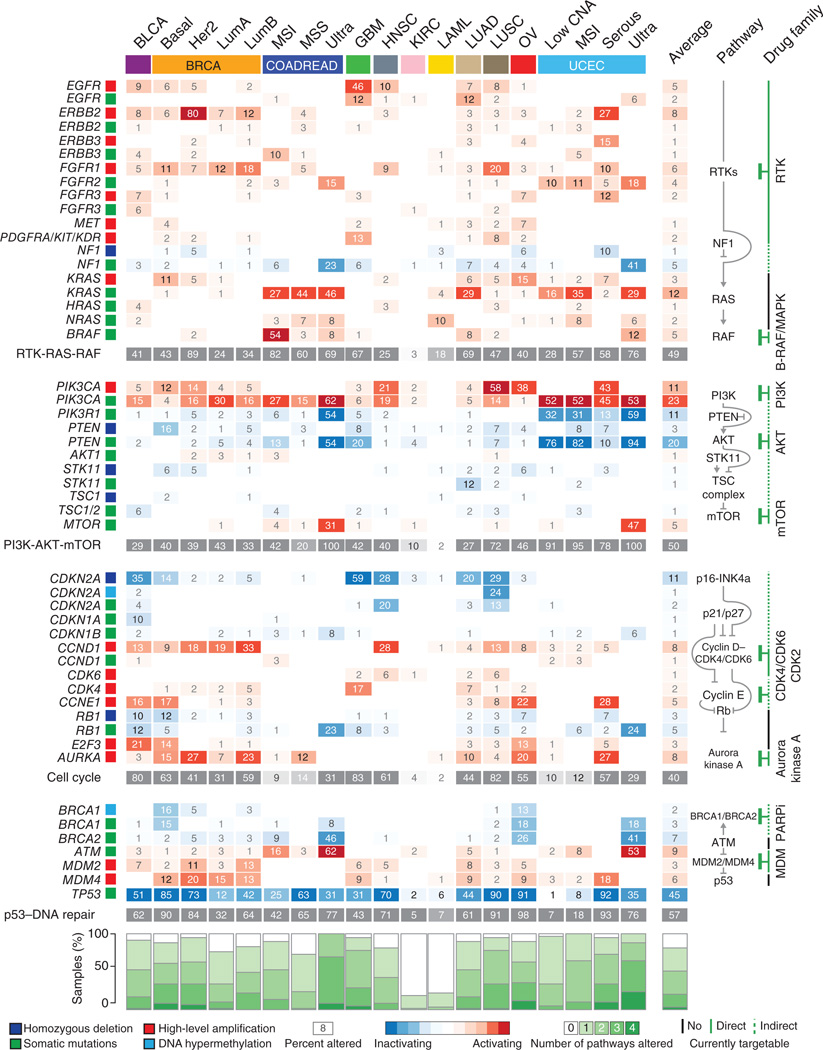
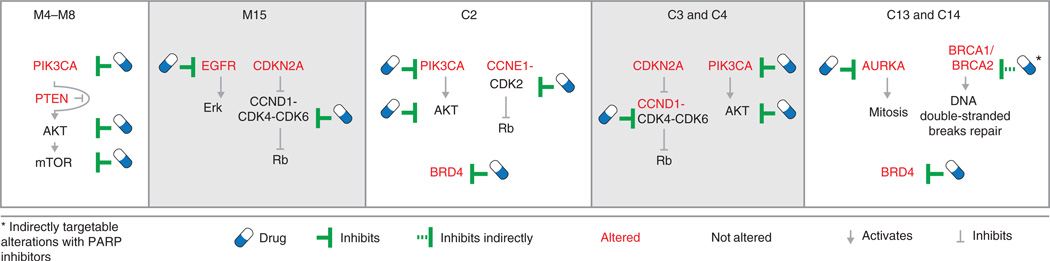
Cancer therapy is challenged by the diversity of molecular implementations of oncogenic processes and by the resulting variation in therapeutic responses. Projects such as The Cancer Genome Atlas (TCGA) provide molecular tumor maps in unprecedented detail. The interpretation of these maps remains a major challenge. Here we distilled thousands of genetic and epigenetic features altered in cancers to ∼500 selected functional events (SFEs). Using this simplified description, we derived a hierarchical classification of 3,299 TCGA tumors from 12 cancer types. The top classes are dominated by either mutations (M class) or copy number changes (C class). This distinction is clearest at the extremes of genomic instability, indicating the presence of different oncogenic processes. The full hierarchy shows functional event patterns characteristic of multiple cross-tissue groups of tumors, termed oncogenic signature classes. Targetable functional events in a tumor class are suggestive of class-specific combination therapy. These results may assist in the definition of clinical trials to match actionable oncogenic signatures with personalized therapies.


Figures

Figure 1
Figure 1
From global profiles of genomic alterations to selected functional events. (ac) Genomic alterations considered included copy number alterations (a), somatic mutations (b) and changes in DNA methylation (c). For the discovery of oncogenic signatures, we first reduced thousands of genomic alterations (heatmaps to the left) to a few hundred candidate functional events (heatmaps to the right). Copy number alterations (losses in blue, gains in red), somatic mutations (mutations in green) and DNA methylation status (high level of methylation in black) define the genetic and epigenetic landscapes of 3,299 samples from 12 tumors types (arranged from left to right with groups of columns labeled by tumor type). Altered genes are arranged vertically and sorted by genomic locus, with chromosome 1 at the top of each rectangular panel and chromosome 22 at the bottom. Candidate functional alterations were selected (Online Methods) for each data type (pie charts show the proportion selected). The most recurrent selected alterations (histograms) tend to involve well-known oncogenes and tumor suppressors. Tumor types abbreviated as in Table 1.
Figure 2
Figure 2
The first partition of the pan-cancer data set identifies two main classes primarily characterized by either recurrent mutations (M class) or recurrent copy number alterations (C class). (a) Each class is composed of multiple tumor types in different proportions. (b) SFEs were tested for significant enrichment (more frequent than expected in a random distribution) in each class (events along the x axis, log-scaled q values on the y axis). Highly enriched events are primarily mutations in the M class and copy number alterations in the C class. Mut, mutation; meth, methylation change; amp, amplification; del, deletion. (c) The distribution of SFEs in tumors indicates that the number of copy number alterations in a sample (x axis) is approximately anticorrelated with the number of somatic mutations in a sample (y axis). The number of samples for a given (x,y) position range from 0 (white) to 243 (dark blue). CNAs, copy number alterations. Tumor types abbreviated as in Table 1.
Figure 3
Figure 3
Characteristic patterns of functional alterations and distinct oncogenic processes as determinants of oncogenic signature classes (OSCs). (a) The first partition of the tree-like stratification (starting with ‘all tumors’ on the left) identifies two main classes: the M class (green) and the C class (red). We identify 17 oncogenic signature subclasses for the M class (M1–M17) and 14 oncogenic signature subclasses for the C class (C1–C14) (one row per subclass). (b) Each subclass includes subsets of tumors from several cancer types (grayscale heatmap; gray intensity represents the fraction of samples in a particular tumor type (column) and a particular subclass (row)). (c) Tree classification is determined at each level by sets of characteristic functional events (color intensity represents the fraction of samples in a subclass (row) affected by a particular functional event (column)). For functional copy number alterations, we indicate, if present, known oncogenes and tumor suppressors in parentheses, for example, 8q24 (MYC). (d,e) Subclass characteristic events reflect particular cellular processes (color intensity represents the fraction of samples in a subclass (row) affected by alterations to a particular process (column)) (d) and altered pathways involved in each of the processes (e). RTK, receptor tyrosine kinase; DSB, double-strand break. Tumor types abbreviated as in Table 1.
Figure 4
Figure 4
Map of functional and actionable alterations across 12 tumor types. Genes (rows) encoding components of four major oncogenic pathways (RTK-RAS-RAF, PI3K-AKT-mTOR, cell cycle and p53–DNA repair; shown schematically in the pathway column) are affected by selected functional events (percent of samples altered and types of alteration are represented by colored squares) across tissue-specific tumor types (columns). Alterations to at least one of these pathways are observed in almost all samples of almost all tumor types (stacked green bar plots at bottom), except in KIRC and LAML. A sizable fraction of these alterations are directly or indirectly therapeutically actionable given the current availability of anticancer drugs (the column with drug family information shows the targets of specific inhibitors). Tumor types abbreviated as in Table 1.
Figure 5
Figure 5
Combination of therapeutically actionable alterations in oncogenic signature classes. In these examples of oncogenic signature subclasses, functional events distinctive for a tumor subclass nominate potential combination therapy when these alterations are either directly or indirectly targetable (Supplementary Table 7). Other combinations of targeted compounds apply to the full set of subclasses in Figure 3.

References

    1. Vogelstein B, et al. Cancer genome landscapes. Science. 2013;339:1546–1558. - PMC - PubMed
    1. Garraway LA, Lander ES. Lessons from the cancer genome. Cell. 2013;153:17–37. - PubMed
    1. Hudson TJ, et al. International network of cancer genome projects. Nature. 2010;464:993–998. - PMC - PubMed
    1. Cancer Genome Atlas Network. Comprehensive molecular portraits of human breast tumors. Nature. 2012;490:61–70. - PMC - PubMed
    1. Cancer Genome Atlas Research Network. Integrated genomic characterization of endometrial carcinoma. Nature. 2013;497:67–73. - PMC - PubMed

Publication types