. 2014 Mar;31(3):720-30.
doi: 10.1007/s11095-013-1193-2. Epub 2013 Sep 27.

The use of ROC analysis for the qualitative prediction of human oral bioavailability from animal data

Affiliations

The use of ROC analysis for the qualitative prediction of human oral bioavailability from animal data

Andrés Olivares-Morales et al. Pharm Res. 2014 Mar.

Abstract

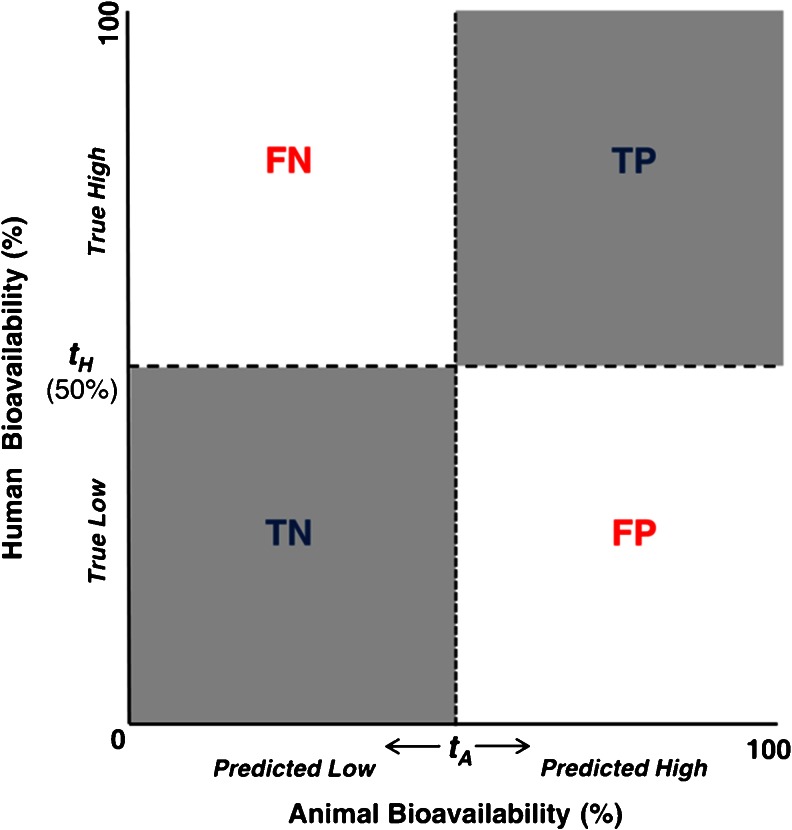
Purpose: To develop and evaluate a tool for the qualitative prediction of human oral bioavailability (Fhuman) from animal oral bioavailability (Fanimal) data employing ROC analysis and to identify the optimal thresholds for such predictions.

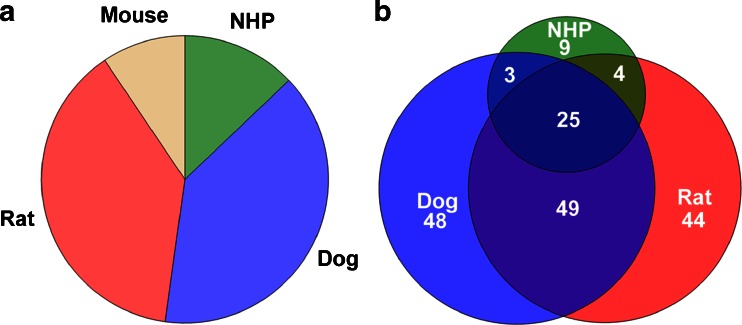
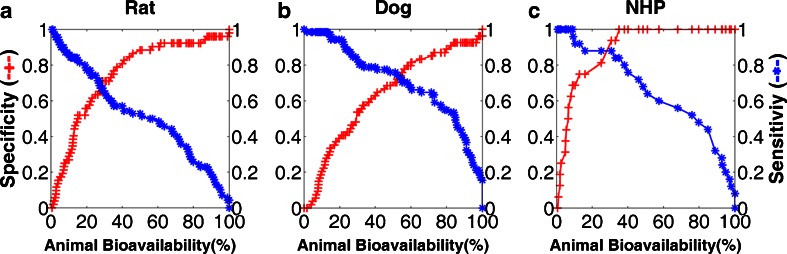
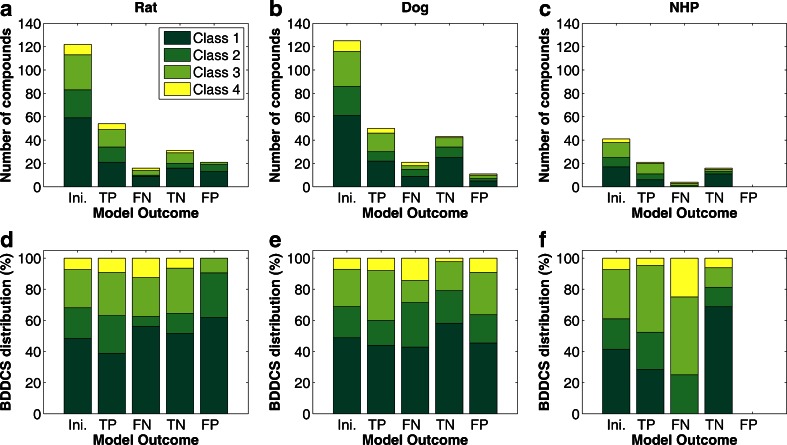
Methods: A dataset of 184 compounds with known Fhuman and Fanimal in at least one species (mouse, rat, dog and non-human primates (NHP)) was employed. A binary classification model for Fhuman was built by setting a threshold for high/low Fhuman at 50%. The thresholds for high/low Fanimal were varied from 0 to 100 to generate the ROC curves. Optimal thresholds were derived from 'cost analysis' and the outcomes with respect to false negative and false positive predictions were analyzed against the BDDCS class distributions.

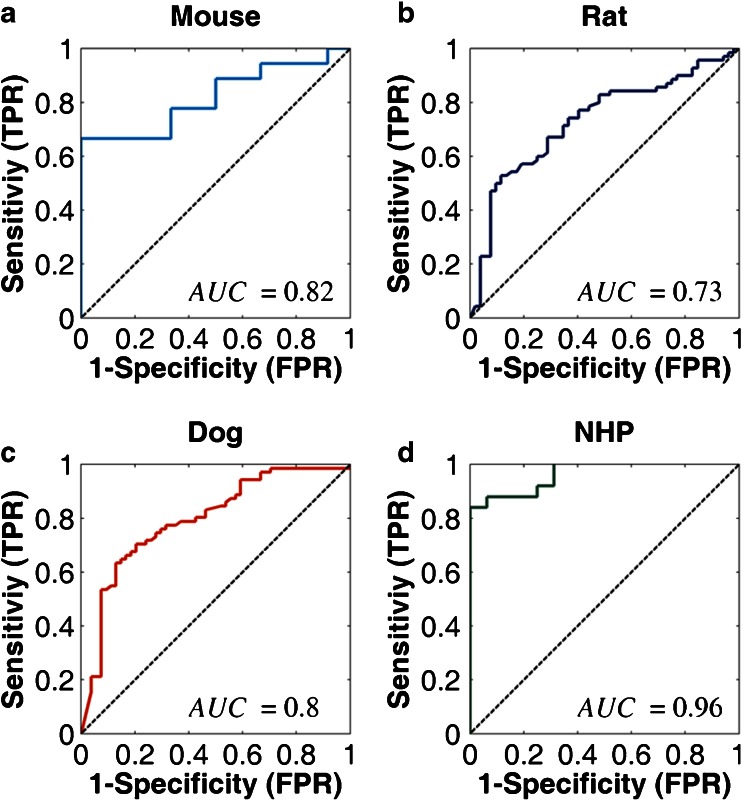
Results: We successfully built ROC curves for the combined dataset and per individual species. Optimal Fanimal thresholds were found to be 67% (mouse), 22% (rat), 58% (dog), 35% (NHP) and 47% (combined dataset). No significant trends were observed when sub-categorizing the outcomes by the BDDCS.

Conclusions: Fanimal can predict high/low Fhuman with adequate sensitivity and specificity. This methodology and associated thresholds can be employed as part of decisions related to planning necessary studies during development of new drug candidates and lead selection.


Figures

Fig. 1
Fig. 1
Threshold based predictions of human oral bioavailability from animal data. FN, False negatives; TP, True positives; TN, True negatives; FP, False positive; t A, Animal high/low bioavailability threshold; t H, human high/low bioavailability threshold.
Fig. 2
Fig. 2
(a) Pie chart of the distribution of the oral bioavailability data points employed for the analysis by species, mouse (n = 30), rat (n = 122), dog (n = 125) and non-human primates (NHP) (n = 41). (b) Venn diagram of the relationship between oral bioavailability data points for rat, dog and NHP. The area of the circles represents the number of compounds with oral bioavailability data for both animal species and humans, the areas of the interception represents the number of compounds with bioavailability data for more than one species.
Fig. 3
Fig. 3
Averaged ROC curve for the human versus animal bioavailability dataset for all the preclinical species (mouse, rat, dog and NHP) combined. The dashed line corresponds to the line for random classification, AUC = 0.79 for the overall dataset.
Fig. 4
Fig. 4
Averaged ROC curves for the human versus animal bioavailability dataset by preclinical species. (a) Mouse ROC curve, AUC = 0.82; (b) Rat ROC curve, AUC = 0.73; (c) Dog ROC curve, AUC = 0.80; (d) NHP ROC curve, AUC = 0.96; Dashed line corresponds to the line for random classification.
Fig. 5
Fig. 5
Impact of the FP/FN cost ratio on the determination of the optimal thresholds by Eq. 4. Sky-blue line and circles, thresholds for the combined dataset; Blue line and upper triangles, mouse thresholds; Red line and squares, rat thresholds; Green line and lower triangles, dog thresholds; Yellow line and diamonds, NHP thresholds.
Fig. 6
Fig. 6
Sensitivity and specificity as a function of F animal thresholds for rat (a), dog (b) and NHP (c). An increase on the thresholds will increase the specificity but at the same time will decrease its sensitivity, the thresholds closer to the intercept between the two lines were chosen as alternative thresholds. Red line and cross (-+-), specificity; Blue line and asterisk (-*-), sensitivity.
Fig. 7
Fig. 7
ROC curve for rat predictions of very low human bioavailability (F human ≤ 20%) dataset. The dashed line corresponds to the line of random classification.
Fig. 8
Fig. 8
Number of compounds and BDDCS class distribution for rat (a), dog (b) and NHP (c) as a function of the outcome of the threshold based model. (d, e and f) BDDCS class distribution for the outcome (in percentage of the outcome groups) for rat, dog and NHP, respectively. Ini., initial number of compounds; TP, compounds classified as true positives, FN, compounds classified as false negatives; TN, compounds classified as true negatives; FP, compounds classified as false positives.

References

    1. Lin JH. Species similarities and differences in pharmacokinetics. Drug Metab Dispos. 1995;23:1008–21. - PubMed
    1. Jamei M, Marciniak S, Feng K, Barnett A, Tucker G, Rostami-Hodjegan A. The Simcyp® population-based ADME simulator. Expert Opin Drug Metab Toxicol. 2009;5:211–23. doi: 10.1517/17425250802691074. - DOI - PubMed
    1. Hellriegel ET, Bjornsson TD, Hauck WW. Interpatient variability in bioavailability is related to the extent of absorption: implications for bioavailability and bioequivalence studies. Clin Pharmacol Ther. 1996;60:601–7. doi: 10.1016/S0009-9236(96)90208-8. - DOI - PubMed
    1. Sietsema WK. The absolute oral bioavailability of selected drugs. Int J Clin Pharmacol Ther Toxicol. 1989;27:179–211. - PubMed
    1. Chhabra RS, Pohl RJ, Fouts JR. A comparative study of xenobiotic-metabolizing enzymes in liver and intestine of various animal species. Drug Metab Dispos. 1974;2:443–7. - PubMed

Publication types

Substances