. 2013 Nov 15;305(10):G697-711.
doi: 10.1152/ajpgi.00184.2013. Epub 2013 Sep 26.

Loss of NHE3 alters gut microbiota composition and influences Bacteroides thetaiotaomicron growth

Affiliations

Loss of NHE3 alters gut microbiota composition and influences Bacteroides thetaiotaomicron growth

Melinda A Engevik et al. Am J Physiol Gastrointest Liver Physiol. .

Abstract

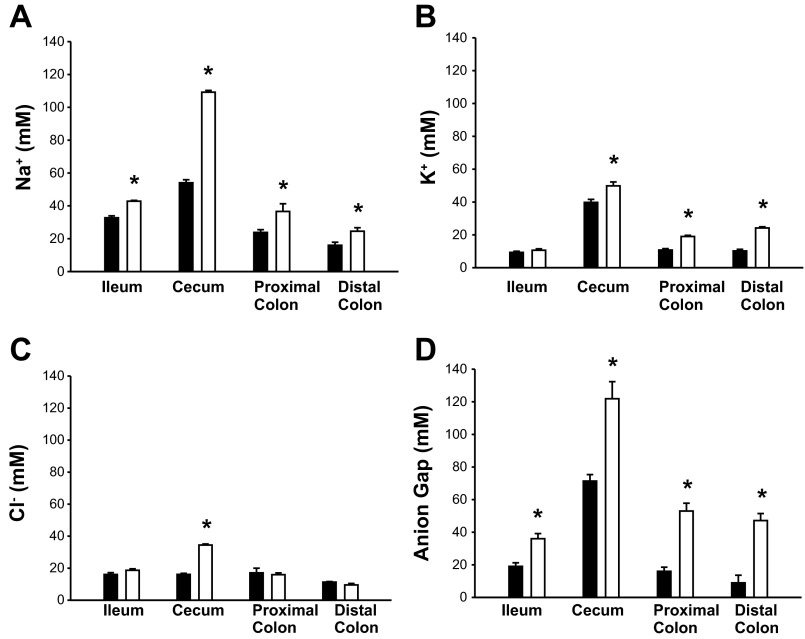
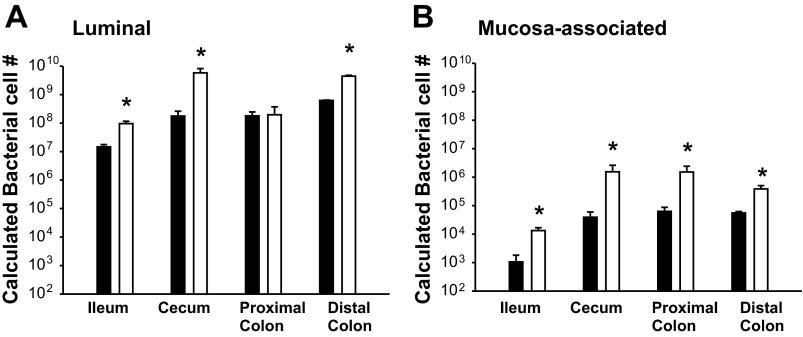
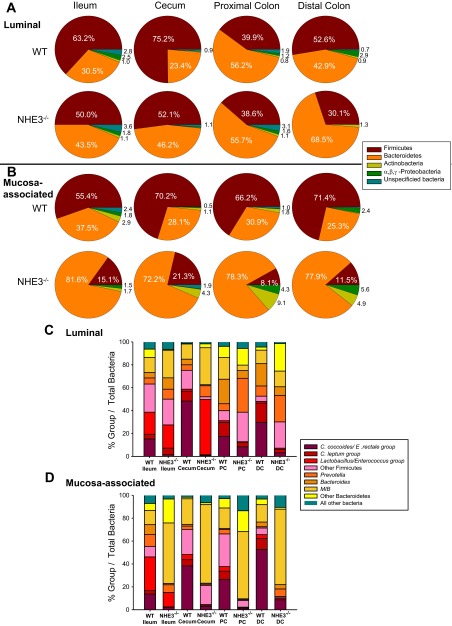
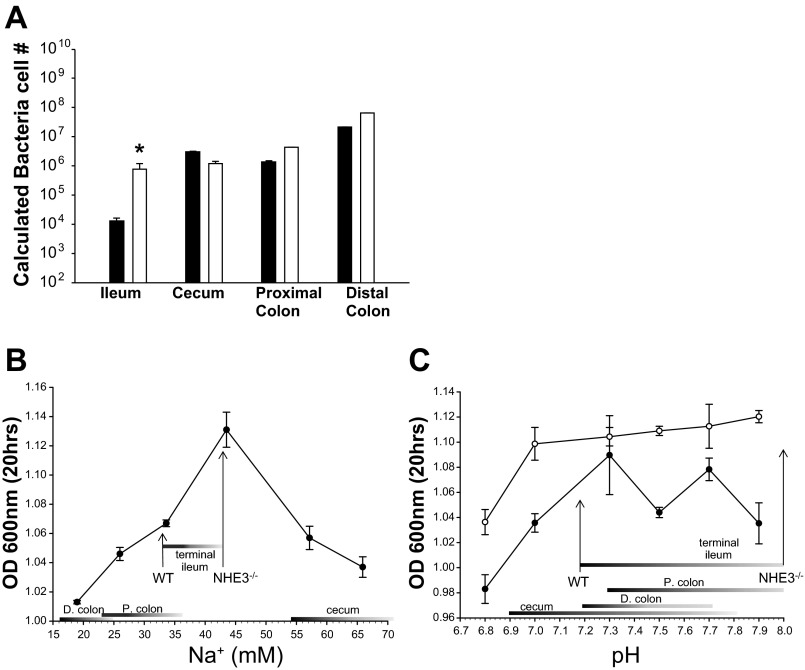
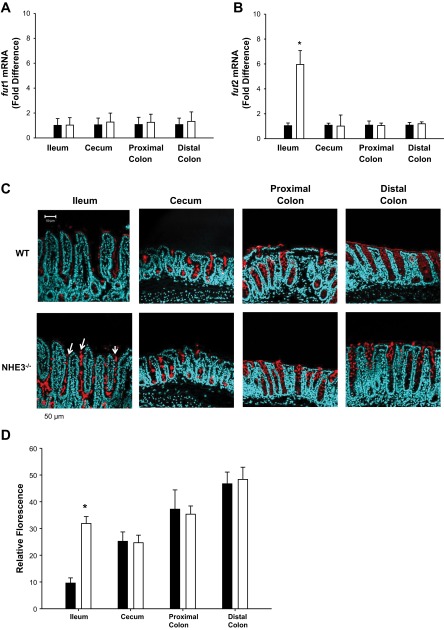
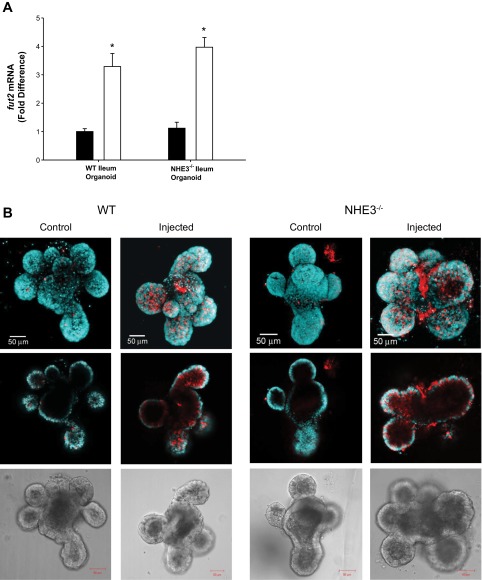
Changes in the intestinal microbiota have been linked to diabetes, obesity, inflammatory bowel disease, and Clostridium difficile (C. difficile)-associated disease. Despite this, it remains unclear how the intestinal environment, set by ion transport, affects luminal and mucosa-associated bacterial composition. Na(+)/H(+)-exchanger isoform 3 (NHE3), a target of C. difficile toxin B, plays an integral role in intestinal Na(+) absorption. Thus the NHE3-deficient mouse model was chosen to examine the effect of pH and ion composition on bacterial growth. We hypothesized that ion transport-induced change in the intestinal environment would lead to alteration of the microbiota. Region-specific changes in ion composition and pH correlated with region-specific alteration of luminal and mucosal-associated bacteria with general decreases in Firmicutes and increases in Bacteroidetes members. Bacteroides thetaiotaomicron (B. thetaiotaomicron) increased in NHE3(-/-) terminal ileum and was examined in vitro to determine whether altered Na(+) was sufficient to affect growth. Increased in vitro growth of B. thetaiotaomicron occurred in 43 mM Na(+) correlating with the NHE3(-/-) mouse terminal ileum [Na(+)]. NHE3(-/-) terminal ileum displayed increased fut2 mRNA and fucosylation correlating with B. thetaiotaomicron growth. Inoculation of B. thetaiotaomicron in wild-type and NHE3(-/-) terminal ileum organoids displayed increased fut2 and fucosylation, indicating that B. thetaiotaomicron alone is sufficient for the increased fucosylation seen in vivo. These data demonstrate that loss of NHE3 alters the intestinal environment, leading to region-specific changes in bacteria, and shed light on the growth requirements of some gut microbiota members, which is vital for creating better treatments of complex diseases with an altered gut microbiota.

Keywords: Bacteroides thetaiotaomicron; Clostridium difficile; Na+/H+-exchanger isoform 3; fucosylation; ileum.


Figures

Fig. 1.
Fig. 1.
Na+/H+-exchanger isoform 3 (NHE3)−/− mice have normal histology. Mucosal morphology shown in hematoxylin and eosin-stained sections from WT and NHE3−/− mouse terminal ileum, cecum, proximal colon, and distal colon, demonstrating no gross alteration of the mucosal architecture. Micrographs are representative of observations from all mice n = 4. Scale bar = 50 μM.
Fig. 2.
Fig. 2.
Ion concentrations in luminal fluid from wild-type (WT) (solid bar) and NHE3−/− (open bar) mouse intestinal segments. A: sodium concentration as determined by flame photometry was significantly increased in all measured segments from NHE3−/− vs. WT littermates. B: potassium concentration as determined by flame photometry was significantly increased in cecum and colon but not terminal ileum of NHE3−/− vs. WT littermates. C: chloride concentration as determined by chloridometry was significantly increased only in the cecum of NHE3−/− vs. WT littermates. D: calculated anion gap + bicarbonate ([Na+] + [K+] − [Cl]) was significantly increased in all measured segments from NHE3−/− vs. WT littermates. n = 5 for WT and n = 3 for NHE3−/−. *P < 0.05.
Fig. 3.
Fig. 3.
NHE3−/− mice exhibit region-specific increases in total bacteria. Total bacteria were quantified by qPCR using a universal bacterial 16S DNA sequence. Calculated bacterial cell number was calculated using an Escherichia coli standard curve normalized to intestinal flush volume. A: luminal bacterial levels in WT (solid bar) and NHE3−/− (open bar) littermates (n = 6). Significant increases in total bacteria in NHE3−/− samples were observed in all but the proximal colon segment. B: mucosa-associated (adherent) bacterial levels in WT (solid bar) and NHE3−/− (open bar) littermates (n = 6). Significant increases in total bacteria were observed in all NHE3−/− mucosal regions tested. *P > 0.005.
Fig. 4.
Fig. 4.
NHE3−/− mice exhibit an altered gut microbiota in luminal and mucosa-associated bacterial populations. Relative bacterial phyla abundance was calculated as the percentage of bacterial phyla compared with total bacteria for luminal (A) and mucosa-associated bacteria (B). NHE3−/− mice showed a disproportionate amount of Bacteroidetes relative to Firmicutes phyla compared with WT littermates (n = 6). In the luminal bacterial population, significant interaction between genotype and region was observed in Firmicutes (P = <0.001), Bacteroidetes (P < 0.001), and Proteobacteria (P < 0.001). No interaction was observed in Actinobacteria (P = 0.641) or unspecified (P = 0.409). In the mucosa-associated bacterial population, significant interaction between genotype and region was observed in Firmicutes (P = <0.001), Bacteroidetes (P = 0.001), Actinobacteria (P < 0.001), Proteobacteria (P < 0.001), and unspecified bacteria (P < 0.001). Relative abundance of luminal (C) and mucosa-associated (D) bacterial subgroups of Firmicutes and Bacteroidetes phyla was observed. Relative abundance was calculated as the percentage of bacterial subgroup compared with total bacteria. Regional changes were observed in the Firmicutes subgroup Clostridium coccoides cluster XIVa, Clostridium leptum cluster IV, and Lactobacillus/Enterococcus group. Changes were also observed in the Bacteroidetes subgroup Prevotella, Bacteroides, and mouse intestinal Bacteroidetes (MIB) in the NHE3−/− mouse luminal and mucosa-associated bacterial populations. Significant interaction was observed between genotype and region for all groups (P < 0.001), n = 6 for WT and NHE3−/−. 2-way ANOVA, Holme-Sidak *P > 0.005. DC, distal colon; PC, proximal colon.
Fig. 5.
Fig. 5.
In vivo and in vitro growth of Bacteroides thetaiotaomicron (B. thetaiotaomicron). A: calculated bacterial cell number for the Bacteroides species B. thetaiotaomicron. Bacterial cell numbers were calculated from a standard curve using a pure culture of B. thetaiotaomicron. B. thetaiotaomicron was significantly increased only in NHE3−/− terminal ileum vs. WT littermates. This increase accounts for 33% of the increased Bacteroidetes. n = 6 for WT (solid bar) and n = 6 for NHE3−/− (open bar) *P > 0.005. B: growth of B. thetaiotaomicron in tryptone soy broth (TSB) at varying concentrations of Na+, which mimic those seen in vivo for NHE3−/− and WT intestinal fluid (Table 2). The steepest change in B. thetaiotaomicron growth is observed at a [Na+] range that correlates directly with that seen in the WT and NHE3−/− terminal ileum. n = 3. [Na+] ranges for each intestinal segment in WT and NHE3−/− are displayed as bars along the x-axis. Arrows indicate in vivo values for terminal ileum. C: growth of B. thetaiotaomicron in TSB broth at varying pH, which mimics that seen in vivo for NHE3−/− and WT intestinal fluid (Table 2). Growth was determined at 33 mM Na+ (●), mimicking WT terminal ileum and 43 mM Na+ (○), mimicking NHE3−/− ileum. No significant difference was observed in B. thetaiotaomicron growth within the pH range seen in WT and NHE3−/− terminal ileum (indicated by the bar). n = 3. Bars and arrows indicate in vivo values.
Fig. 6.
Fig. 6.
Increased fut2 and fucosylation are observed in the NHE3−/− terminal ileum. mRNA expression was determined by qRT-PCR and expressed as the ΔΔCT relative fold difference. A: no significant difference is observed in fut1 mRNA expression between NHE3−/− (open bar) and WT (solid bar) littermate mice. B: fut2 mRNA is significantly increased only in NHE3−/− (open bar) mouse terminal ileum vs. WT (solid bar) littermates. No significant difference in fut2 expression is observed in mucosal segments distal to the terminal ileum. This directly correlates with B. thetaiotaomicron levels shown in Fig. 5A. n = 6. *P < 0.05. C: significant increase in fucosylation was only observed in terminal ileum of NHE3−/− vs. WT mice with fucosylated residues apparent from crypt to villus tip (depicted by the arrows). This increase directly correlates with increased fut2 mRNA and Bacteroides levels in the terminal ileum of the NHE3−/− mice. Fucosylation was determined by Ulex europaeus agglutinin (UEA)-1-FITC lectin binding (red). Nuclei stained with DAPI (blue). Representative micrographs of observations from n = 4 mice. Scale bar = 50 μM. D: semiquantitative analysis of fucosylation. There is a significant interaction between genotype and segment (*P = <0.001). NHE3−/− vs. WT ileum P < 0.001. No significant differences were observed between WT and NHE3−/− cecum (P = 0.896), proximal (P = 0.511) and distal colon (P = 0.720) by 2-way ANOVA, Holme-Sidak.
Fig. 7.
Fig. 7.
B. thetaiotaomicron induced host epithelial changes in mouse terminal ileal organoid. A: fut2 mRNA in WT and NHE3−/− mouse ileum organoids (solid bar = ileum organoid injected with TSB broth; open bar = ileum organoid injected with B. thetaiotaomicron culture). B: confocal images from WT and NHE3−/− mouse ileum organoids depicting fucosylation by UEA-1-rhodamine lectin (red) binding. Nuclei stained with DAPI (blue). Shown from top to bottom are projection images, x-y plane midsection slice, and transmitted light image. Images reveal increased fucosylation in organoids infected with B. thetaiotaomicron. These data demonstrate that B. thetaiotaomicron alone is sufficient to induce fut2, which correlates to increased fucosylation in terminal mouse ileum. n = 5 *P < 0.05. Scale bar = 50 μm.

References

    1. Avetisyan AV, Bogachev AV, Murtasina RA, Skulachev VP. ATP-driven Na+ transport and Na(+)-dependent ATP synthesis in Escherichia coli grown at low delta mu H+. FEBS Lett 317: 267–270, 1993 - PubMed
    1. Backhed F, Ding H, Wang T, Hooper LV, Koh GY, Nagy A, Semenkovich CF, Gordon JI. The gut microbiota as an environmental factor that regulates fat storage. Proc Natl Acad Sci USA 101: 15718–15723, 2004 - PMC - PubMed
    1. Backhed F, Manchester JK, Semenkovich CF, Gordon JI. Mechanisms underlying the resistance to diet-induced obesity in germ-free mice. Proc Natl Acad Sci USA 104: 979–984, 2007 - PMC - PubMed
    1. Barman M, Unold D, Shifley K, Amir E, Hung K, Bos N, Salzman N. Enteric salmonellosis disrupts the microbial ecology of the murine gastrointestinal tract. Infect Immun 76: 907–915, 2008 - PMC - PubMed
    1. Bergstrom KS, Kissoon-Singh V, Gibson DL, Ma C, Montero M, Sham HP, Ryz N, Huang T, Velcich A, Finlay BB, Chadee K, Vallance BA. Muc2 protects against lethal infectious colitis by disassociating pathogenic and commensal bacteria from the colonic mucosa. PLoS Pathog 6: e1000902, 2010 - PMC - PubMed

Publication types

LinkOut - more resources