. 2013 Dec;23(12):2078-90.
doi: 10.1101/gr.156919.113. Epub 2013 Sep 26.

3' UTR-isoform choice has limited influence on the stability and translational efficiency of most mRNAs in mouse fibroblasts

Affiliations

3' UTR-isoform choice has limited influence on the stability and translational efficiency of most mRNAs in mouse fibroblasts

Noah Spies et al. Genome Res. 2013 Dec.

Abstract

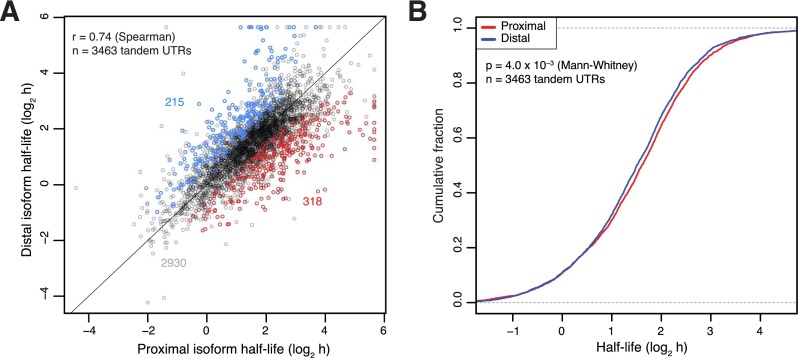
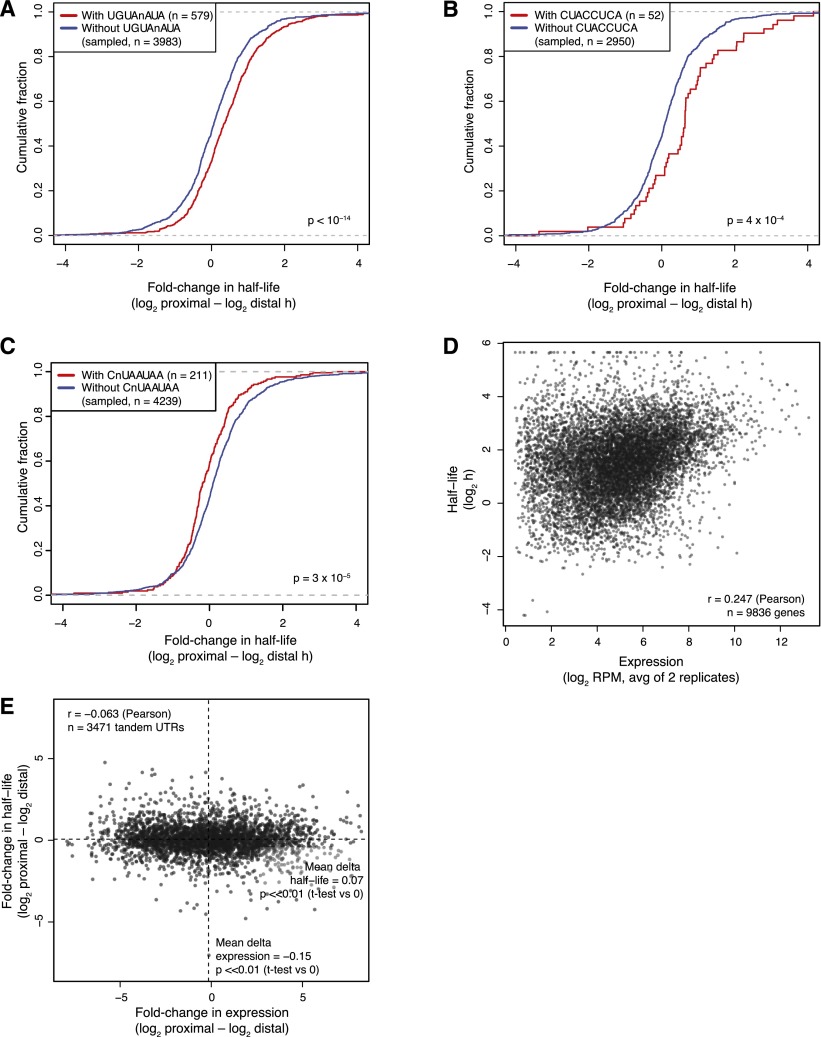
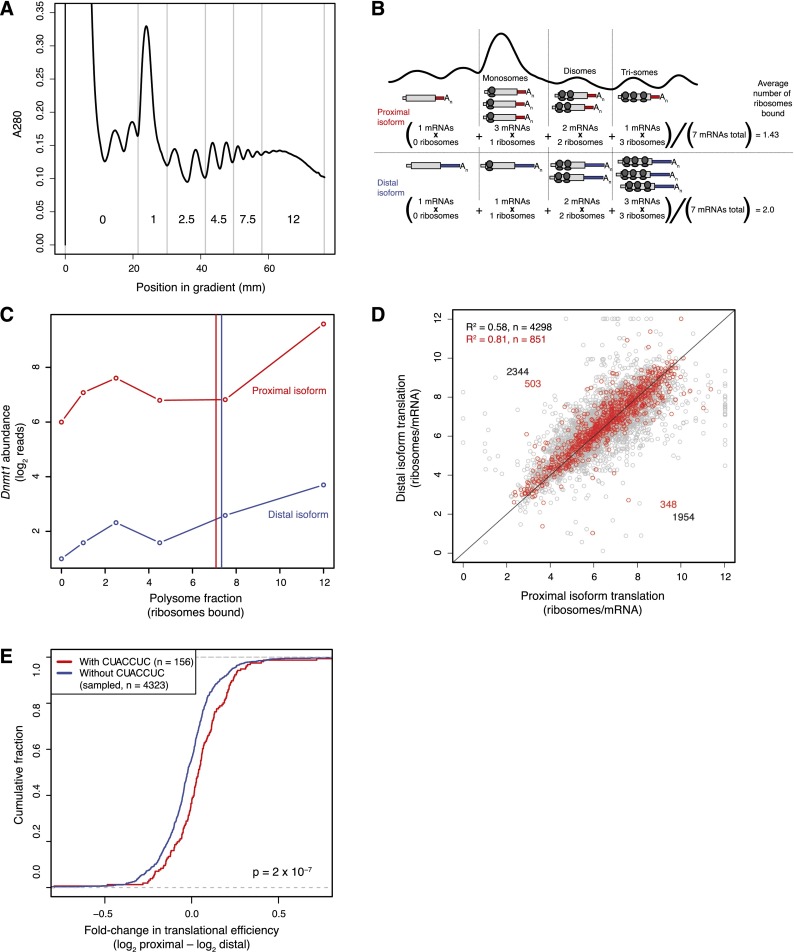
Variation in protein output across the genome is controlled at several levels, but the relative contributions of different regulatory mechanisms remain poorly understood. Here, we obtained global measurements of decay and translation rates for mRNAs with alternative 3' untranslated regions (3' UTRs) in murine 3T3 cells. Distal tandem isoforms had slightly but significantly lower mRNA stability and greater translational efficiency than proximal isoforms on average. The diversity of alternative 3' UTRs also enabled inference and evaluation of both positively and negatively acting cis-regulatory elements. The 3' UTR elements with the greatest implied influence were microRNA complementary sites, which were associated with repression of 32% and 4% at the stability and translational levels, respectively. Nonetheless, both the decay and translation rates were highly correlated for proximal and distal 3' UTR isoforms from the same genes, implying that in 3T3 cells, alternative 3' UTR sequences play a surprisingly small regulatory role compared to other mRNA regions.


Figures

Figure 1.
Figure 1.
Experimental methods used to assay alternative cleavage and polyadenylation. (A) 3P-seq (Jan et al. 2011). This method captures 3′ end mRNA fragments without using oligo(dT) priming and, therefore, is highly specific for true poly(A) sites. A bridge oligo (black) is used to ligate a biotinylated oligo (blue); reverse transcription primer (red); captured mRNA 3′ end fragment (gray); Illumina sequencing adapters (purple and green). (B) Poly(A)-primed sequencing, or 2P-seq. This simplified method is useful for quantifying usage of known poly(A) sites. (C) Reproducibility of 2P-seq measurements of isoform abundance across two biological replicates. Only isoforms with at least a single read in either replicate were considered, and a single pseudocount was added prior to taking the log of each value. (D) Correspondence between mRNA quantified using 2P-seq and RNA-seq data sets from 3T3 cells. A minimum of two tags or 0.1 RPKM was required for 2P-seq and RNA-seq, respectively, and pseudocounts of 1 and 0.1, respectively, were added prior to taking the log of each value.
Figure 2.
Figure 2.
mRNA and isoform half-life values, and modeling of associated mRNA features. (A) Schematic of approach used to measure half-lives of tandem 3′ UTR isoforms. Distal and proximal isoforms are illustrated for cleavage stimulation factor subunit 1 (Cstf1). For each time point after transcriptional arrest with actinomycin D, 2P tags are plotted for each isoform as well as a gene-level aggregate, showing the corresponding half-life estimates below. Tags for the 0 h (steady-state) replicates were averaged. (B) Fitted exponential degradation curves, shown for the same isoforms as in A. An additional normalization factor not considered here was used to correct for the slight decrease in total mRNA at later time points, resulting in slightly lower final half-lives of 0.52 h (proximal) and 1.20 h (distal). (C) Correlation between gene-based half-lives determined in 3T3 cells (2P-seq) with previous results in mouse embryonic stem cells (Sharova et al. 2009). (D) Correspondence between our measured half-lives and mRNA half-lives predicted using a model trained on a separate 50% of our data. For each gene with multiple tandem 3′ UTRs, only the most proximal isoform was used to quantitate gene half-life, although results were similar when averaging over all isoforms or using only the most distal isoform. (E) The correspondence between mRNA half-life and ORF exon-junction density. A maximum of 0.02 exons/bp was used for ORF exon-junction density, affecting seven of the 7028 genes. (F) Sequence features used to predict half-lives, arranged in approximate order of importance in the model. Adding more features resulted in diminishing returns, with a model including only the top three to six features performing nearly as well as any of the models with more features. Because of significant multicollinearity, features correlating well were grouped together (e.g., ORF length and ORF exon-junction density) with their pairwise correlation indicated (Pearson r). Also reported are each individual R2 with mRNA stability, and each cumulative R2 calculated for a linear model including all previous features. Predicted targeting for the top 10 miRNAs or for individual miRNAs was quantified using context scores (Grimson et al. 2007; Garcia et al. 2011). Error bars show 95% confidence intervals.
Figure 3.
Figure 3.
Isoform-specific quantification of mRNA stability. (A) Relationship between half-lives of the adjacent proximal and distal tandem 3′ UTR isoforms' half-lives, highlighting the statistically significant differences (P < 0.05, colored points) and their tallies (colored numbers). (B) Cumulative distribution function of data shown in A. Plotted is the fraction of genes with half-life exceeding the value of the x-axis. The very slight shift toward more stable proximal tandem UTR isoforms is statistically significant (P = 4.0 × 10⁻³, Mann-Whitney test, n = 3463 tandem isoform pairs).
Figure 4.
Figure 4.
Relationships between isoform half-life and either motifs or isoform accumulation. (A) Half-life differences for proximal versus distal tandem UTR isoforms containing a PUF-binding site in the distal region (red curve) or those for length-matched control tandem UTRs without the site (blue curve). Fold changes >0 indicate a more stable proximal isoform, and those <0 indicate a more stable distal isoform. The P-value reports a statistically significant difference between the two cumulative distributions (Mann-Whitney test). (B) Half-life differences for proximal versus distal tandem UTR isoforms with and without an 8-nt site for the let-7 miRNA in the distal region. Otherwise, as in A. (C) Half-life differences for tandem UTR isoforms with and without the top candidate stabilizing motif in the distal region. Otherwise, as in A. (D) Relationship between half-life and steady-state mRNA accumulation, calculated as the average over all 3′ UTR isoforms. mRNA expression levels were the average of two biological replicates. (E) Differences in proximal and distal tandem UTR half-lives compared to differences in their accumulation. On average, distal isoforms were slightly more highly expressed than were proximal isoforms, as indicated by the vertical line, but proximal isoforms were on average slightly more stable than were distal isoforms, as indicated by the horizontal line.
Figure 5.
Figure 5.
Isoform-specific quantification of mRNA translational efficiency. (A) Polysome profile used to separate mRNAs into six fractions based on the number of bound ribosomes. Fractions are labeled by the average number of ribosomes bound per message. The two peaks in fraction 0 are the 60S and 80S ribosomal subunits. (B) Schematic of polysome-gradient sedimentation, illustrating calculation of translation rates for individual mRNA isoforms. In this example, the distal isoform has a greater average number of ribosomes bound (1.71 ribosomes/mRNA) compared to the proximal isoform (1.43 ribosomes/mRNA). Because isoforms share the same ORF, we did not normalize by ORF length when comparing values for tandem isoforms. (C) Polysome profiles for the DNA methyltransferase Dnmt1 mRNA, which has two tandem UTR isoforms colored red (proximal), and blue (distal). 2P-seq read counts were normalized to known amounts of yeast spike-in RNA. Translational efficiencies, calculated as the average number of ribosomes bound, are shown as vertical lines. (D) Comparison of translation rates for proximal and distal tandem 3′ UTR isoforms. Results for the 851 most highly expressed tandem 3′ UTR isoforms are shown in red, with results of the remainder shown in gray. Because tandem UTR isoforms presumably share the same ORF, translation rates were not divided by ORF length; doing so increased the correlation between proximal and distal isoforms but did not affect the tendency toward increased translation of the distal isoforms. (E) Translational efficiency differences for proximal versus distal tandem UTR isoforms with and without a 7-nt site for the let-7 miRNA in the distal region. Otherwise, as in Figure 4A.

References

    1. Andreassi C, Riccio A 2009. To localize or not to localize: mRNA fate is in 3′UTR ends. Trends Cell Biol 19: 465–474 - PubMed
    1. Arava Y, Wang Y, Storey JD, Liu CL, Brown PO, Herschlag D 2003. Genome-wide analysis of mRNA translation profiles in Saccharomyces cerevisiae. Proc Natl Acad Sci 100: 3889–3894 - PMC - PubMed
    1. Ashburner M, Ball CA, Blake JA, Botstein D, Butler H, Cherry JM, Davis AP, Dolinski K, Dwight SS, Eppig JT, et al. 2000. Gene ontology: Tool for the unification of biology. The Gene Ontology Consortium. Nat Genet 25: 25–29 - PMC - PubMed
    1. Baek D, Villen J, Shin C, Camargo FD, Gygi SP, Bartel DP 2008. The impact of microRNAs on protein output. Nature 455: 64–71 - PMC - PubMed
    1. Barreau C, Paillard L, Osborne HB 2005. AU-rich elements and associated factors: Are there unifying principles? Nucleic Acids Res 33: 7138–7150 - PMC - PubMed

Publication types

Associated data