Comparative Study
. 2013 Oct;52(10):1048-1056.e3.
doi: 10.1016/j.jaac.2013.07.016. Epub 2013 Aug 3.

No genetic influence for childhood behavior problems from DNA analysis

Affiliations
Comparative Study

No genetic influence for childhood behavior problems from DNA analysis

Maciej Trzaskowski et al. J Am Acad Child Adolesc Psychiatry. 2013 Oct.

Abstract

Objective: Twin studies of behavior problems in childhood point to substantial genetic influence. It is now possible to estimate genetic influence using DNA alone in samples of unrelated individuals, not relying on family-based designs such as twins. A linear mixed model, which incorporates DNA microarray data, has confirmed twin results by showing substantial genetic influence for diverse traits in adults. Here we present direct comparisons between twin and DNA heritability estimates for childhood behavior problems as rated by parents, teachers, and children themselves.

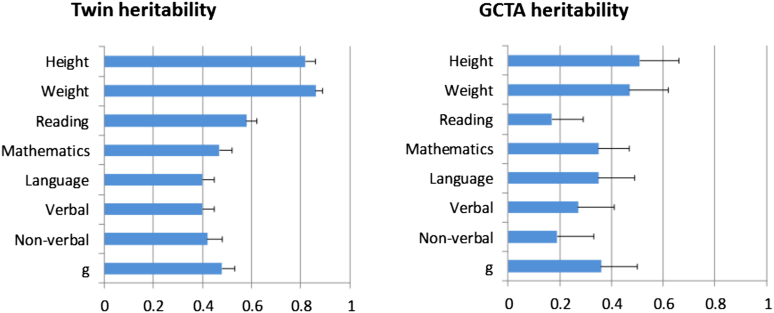
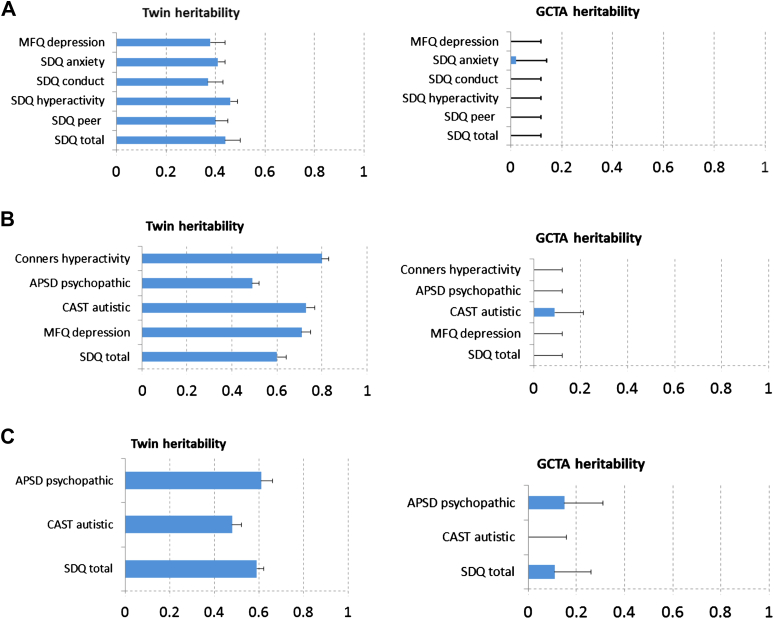
Method: Behavior problem data from 2,500 UK-representative 12-year-old twin pairs were used in twin analyses; DNA analyses were based on 1 member of the twin pair with genotype data for 1.7 million DNA markers. Diverse behavior problems were assessed, including autistic, depressive, and hyperactive symptoms. Genetic influence from DNA was estimated using genome-wide complex trait analysis (GCTA), and the twin estimates of heritability were based on standard twin model fitting.

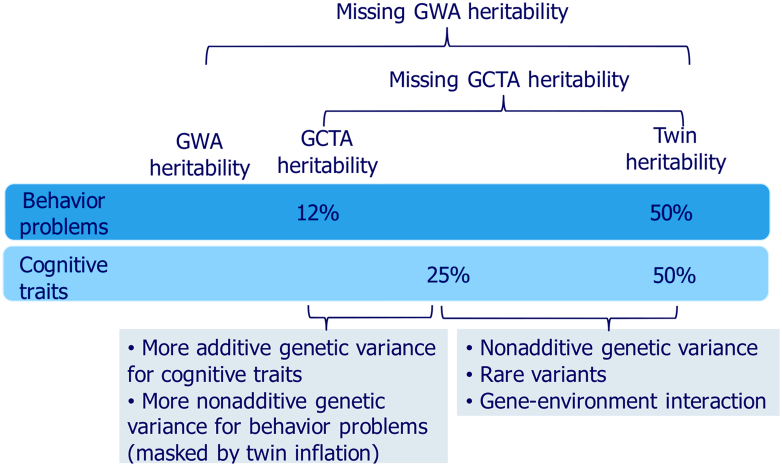
Results: Behavior problems in childhood-whether rated by parents, teachers, or children themselves-show no significant genetic influence using GCTA, even though twin study estimates of heritability are substantial in the same sample, and even though both GCTA and twin study estimates of genetic influence are substantial for cognitive and anthropometric traits.

Conclusions: We suggest that this new type of "missing heritability," that is, the gap between GCTA and twin study estimates for behavior problems in childhood, is due to nonadditive genetic influence, which will make it more difficult to identify genes responsible for heritability.

Keywords: behavior problems; cognitive abilities; genome-wide complex trait analysis (GCTA); heritability; twin study.


Figures

Figure 1
Figure 1
Genetic estimates for height, weight, and cognitive trait composites from twin analyses and from genome-wide complex trait analysis (GCTA). Note: ‘g’ refers to general cognitive ability, which is a composite of verbal and nonverbal ability. N = 2,153 to 2,659 twin pairs for twin analyses, and N = 2,281 to 2,809 unrelated individuals for GCTA. Error bars in the figure indicate standard errors (SE).
Figure 2
Figure 2
Genetic estimates for composite measures of behavior problems from twin analyses and from genome-wide complex trait analysis (GCTA). Note: (A) Self-report, N = 2,153 to 2,659 twin pairs for twin analyses; N = 2,281 to 2,809 unrelated individuals for GCTA. (B) Parent ratings, N = 2,680 to 2,695 twin pairs for twin estimates; N = 2,687 to 2,700 individuals for GCTA estimates. (C) Teacher ratings, N = 1,783 to 1,925 twin pairs for twin analyses; N = 2,034 to 2,139 individuals for GCTA estimates. Error bars in the figure indicate standard errors (SE). Results for the constituent scales for these composites are presented in Table S1, available online.
Figure 3
Figure 3
Missing genome-wide association (GWA) heritability and missing genome-wide complex trait analysis (GCTA) heritability for behavior problems and cognitive traits.
Figure S1
Figure S1
(A) Histograms of untransformed composite scales, (B) Histograms of composite quantile normalized scales. Note: As seen in Figure S1A, some of the composite scales are skewed, as is typical of behavior problem scales. However, Figure S1B shows that van der Wearden transformation (see Method) normalizes the scales. It is noteworthy that despite the considerable transformation of the distributions, the correlation between the untransformed and transformed scales are high (.0.90, 0.96, 0.96, 0.99, 0.92, 0.98, 0.98, 0.97, 0.86, 0.97, 0.94, 0.95, 0.94, 0.95, respectively), indicating that the transformation did not drastically disrupt the rank-order structure of the data. In the Results section of the text, we presented results for the transformed scales; however, as a further check on the effect of non-normality, we also compared genome-wide complex trait analysis (GCTA) and twin point estimates of heritability for the transformed and untransformed scales. We found that the largest GCTA heritability difference was 0.04 and the largest twin heritability difference was also 0.04. ‘lcmfq1’ = child self-rated Moods and Feelings Questionnaire (MFQ); ‘lcsanxt1’ = child self-rated Strengths and Difficulties Questionnaire (SDQ) Anxiety; ‘lcscont1’ = child self-rated SDQ conduct; ‘lcshypt1’ = child self-rated SDQ hyperactivity; ‘lcspert1’ = child self-rated SDQ peer problems; ‘lcsbeht1’ = child self-rated SDQ composite; ‘lpapsdt1’ = parent-rated APSD composite; ‘lpcstt1’ = parent-rated CAST composite; ‘lpmfq1’ = parent-rated MFQ composite; ‘lpsbeht1’ = parent-rated SDQ composite; ‘ltapsdt1’ = teacher-rated Antisocial Process Screening Device (APSD) composite; ‘ltcastt1’ = teacher-rated Childhood Asperger Syndrome Test (CAST) composite; ‘ltsbeht1’ = teacher-rated SDQ composite; ‘lpconnt1’ = parent-rated Conners attention-deficit/hyperactivity disorder (ADHD) composite.
Figure S1
Figure S1
(A) Histograms of untransformed composite scales, (B) Histograms of composite quantile normalized scales. Note: As seen in Figure S1A, some of the composite scales are skewed, as is typical of behavior problem scales. However, Figure S1B shows that van der Wearden transformation (see Method) normalizes the scales. It is noteworthy that despite the considerable transformation of the distributions, the correlation between the untransformed and transformed scales are high (.0.90, 0.96, 0.96, 0.99, 0.92, 0.98, 0.98, 0.97, 0.86, 0.97, 0.94, 0.95, 0.94, 0.95, respectively), indicating that the transformation did not drastically disrupt the rank-order structure of the data. In the Results section of the text, we presented results for the transformed scales; however, as a further check on the effect of non-normality, we also compared genome-wide complex trait analysis (GCTA) and twin point estimates of heritability for the transformed and untransformed scales. We found that the largest GCTA heritability difference was 0.04 and the largest twin heritability difference was also 0.04. ‘lcmfq1’ = child self-rated Moods and Feelings Questionnaire (MFQ); ‘lcsanxt1’ = child self-rated Strengths and Difficulties Questionnaire (SDQ) Anxiety; ‘lcscont1’ = child self-rated SDQ conduct; ‘lcshypt1’ = child self-rated SDQ hyperactivity; ‘lcspert1’ = child self-rated SDQ peer problems; ‘lcsbeht1’ = child self-rated SDQ composite; ‘lpapsdt1’ = parent-rated APSD composite; ‘lpcstt1’ = parent-rated CAST composite; ‘lpmfq1’ = parent-rated MFQ composite; ‘lpsbeht1’ = parent-rated SDQ composite; ‘ltapsdt1’ = teacher-rated Antisocial Process Screening Device (APSD) composite; ‘ltcastt1’ = teacher-rated Childhood Asperger Syndrome Test (CAST) composite; ‘ltsbeht1’ = teacher-rated SDQ composite; ‘lpconnt1’ = parent-rated Conners attention-deficit/hyperactivity disorder (ADHD) composite.

Comment in

Similar articles

Cited by

References

    1. Merikangas K.R., He J.-P., Brody D., Fisher P.W., Bourdon K., Koretz D.S. Prevalence and treatment of mental disorders among US children in the 2001-2004 NHANES. Pediatrics. 2010;125:75–81. - PMC - PubMed
    1. Kessler R.C., Berglund P., Demler O., Jin R., Merikangas K.R., Walters E.E. Lifetime prevalence and age-of-onset distributions of DSM-IV disorders in the National Comorbidity Survey Replication. Arch Gen Psychiatry. 2005;62:593–602. - PubMed
    1. Plomin R., DeFries J.C., Knopik V.S., Neiderhiser J.M. 6th ed. Worth Publishers; New York: 2012. Behavioral Genetics.
    1. Visscher P.M., Brown M.A., McCarthy M.I., Yang J. Five years of GWAS discovery. Am J Hum Genet. 2012;90:7–24. - PMC - PubMed
    1. Plomin R. Child development and molecular genetics: 14 years later. Child Dev. 2012;30:1467–8624. - PMC - PubMed

Publication types

Substances