. 2013 Sep 26;155(1):70-80.
doi: 10.1016/j.cell.2013.08.030.

A nondegenerate code of deleterious variants in Mendelian loci contributes to complex disease risk

Affiliations

A nondegenerate code of deleterious variants in Mendelian loci contributes to complex disease risk

David R Blair et al. Cell. .

Abstract

Although countless highly penetrant variants have been associated with Mendelian disorders, the genetic etiologies underlying complex diseases remain largely unresolved. By mining the medical records of over 110 million patients, we examine the extent to which Mendelian variation contributes to complex disease risk. We detect thousands of associations between Mendelian and complex diseases, revealing a nondegenerate, phenotypic code that links each complex disorder to a unique collection of Mendelian loci. Using genome-wide association results, we demonstrate that common variants associated with complex diseases are enriched in the genes indicated by this "Mendelian code." Finally, we detect hundreds of comorbidity associations among Mendelian disorders, and we use probabilistic genetic modeling to demonstrate that Mendelian variants likely contribute nonadditively to the risk for a subset of complex diseases. Overall, this study illustrates a complementary approach for mapping complex disease loci and provides unique predictions concerning the etiologies of specific diseases.


Figures

Figure 1
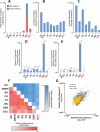
Figure 1. A systematic comparison of the eight clinical record datasets analyzed in this study
(A) The total number of records in each dataset, broken down by gender. Panels (B) and (C) display the average prevalence for the complex and Mendelian diseases across the 8 datasets. Using the superset of the discovered associations (based on the original 7 datasets, see Extended Experimental Procedures for details), we compared the number of association signals that were detected in each dataset independently, depicted as the percentage of all associations discovered in the union of the 7 datasets (excluding MED): (D) Mendelian-complex and (E) Mendelian-Mendelian associations. (F) The rank correlation among relative risk estimates (lower diagonal) and disease prevalence (upper diagonal) for each significantly comorbid complex-Mendelian disease pair across the eight distinct datasets. (G) Scatter plots depicting the relative risk correlations for three pairs of datasets, indicated using the colored boxes in panel F. See also Tables S2 and S3.
Figure 2
Figure 2. The significant comorbidity relationships among the complex and Mendelian disease pairs
Entries in the matrix indicate the log10-transformed relative risk associated with each significantly comorbid complex-Mendelian disease pair. The complex phenotypes are grouped by our current understanding of their pathophysiology. The symbols ♂ and ♀ indicate male and female-specific diseases, respectively. The numerical values underlying each association are provided Table in S4. The statistical procedure for generating these values is outlined in Figure S1. See also Tables S1-S3.
Figure 3
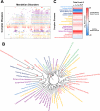
Figure 3. Complex-Mendelian comorbidities provide unique insight into the etiology of complex diseases
(A) The data matrix from Figure 2 is re-ordered such that similar rows and columns are adjacent to one another (accomplished using greedy clustering). (B) The neighbor-joining tree for the complex phenotypes was constructed from the Euclidean distances among the relative risks displayed in Figure 2 and Panel A. The bootstrap numbers (10,000 replicates) over tree arcs indicate the reliability of the corresponding partitions, with 100 being the most reliable and 0 the least. The color of the tree labels is preserved with regard to the groupings of the phenotypes depicted in Figure 2. (C) Heat map comparing the qualities of fit for the two multi-locus genetic models discussed in the main text over a range of loci numbers. The value of the log10-Bayes Factor indicates the support for the combinatorial model in comparison to the additive model. A log10-Bayes Factor of 1 indicates that the combinatorial model is 10 times more likely than the heterogeneity model given the data. See Figure S3 for a graphical comparison of the model fits to the complex disease risk data. See also Table S2.
Figure 4
Figure 4. The significant comorbidity relationships detected among all pairs of Mendelian diseases
The upper diagonal of the matrix displays the log10-transformed odds ratios for the significant associations, with gray-scale intensity indicating the effect size of the association. The lower diagonal displays the community structure determined using a network-clustering algorithm (Blondel et al., 2008), with each community corresponding to a unique color and associations between diseases within the same community colored accordingly. The numerical values underlying each association are provided in Table S5. The statistical procedure for generating these values is depicted in Figure S4. An unfiltered version of the matrix is displayed in Figure S5.

Comment in

References

    1. Ashwood P, Nguyen DV, Hessl D, Hagerman RJ, Tassone F. Plasma cytokine profiles in Fragile X subjects: is there a role for cytokines in the pathogenesis? Brain Behav Immun. 2010;24:898–902. - PMC - PubMed
    1. Badano JL, Katsanis N. Beyond Mendel: an evolving view of human genetic disease transmission. Nature reviews Genetics. 2002;3:779–789. - PubMed
    1. Badano JL, Leitch CC, Ansley SJ, May-Simera H, Lawson S, Lewis RA, Beales PL, Dietz HC, Fisher S, Katsanis N. Dissection of epistasis in oligogenic Bardet-Biedl syndrome. Nature. 2006;439:326–330. - PubMed
    1. Bassett AS, Marshall CR, Lionel AC, Chow EW, Scherer SW. Copy number variations and risk for schizophrenia in 22q11.2 deletion syndrome. Human molecular genetics. 2008;17:4045–4053. - PMC - PubMed
    1. Blondel VD, Guillaume J-L, Lambiotte R, Lefebvre E. Fast unfolding of communities in large networks. J Stat Mech. 2008;10:10008–10020.

Publication types