. 2013 Sep 26;155(1):135-47.
doi: 10.1016/j.cell.2013.08.031.

The cell-cycle state of stem cells determines cell fate propensity

Affiliations

The cell-cycle state of stem cells determines cell fate propensity

Siim Pauklin et al. Cell. .

Erratum in

Abstract

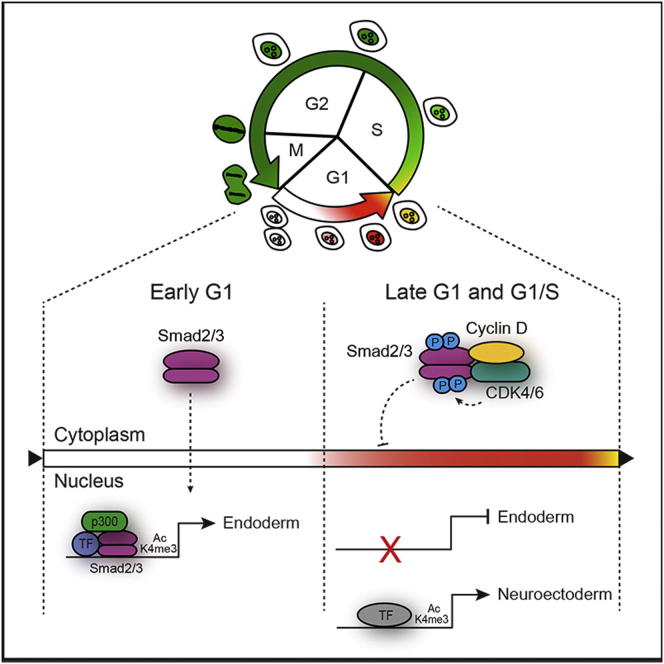
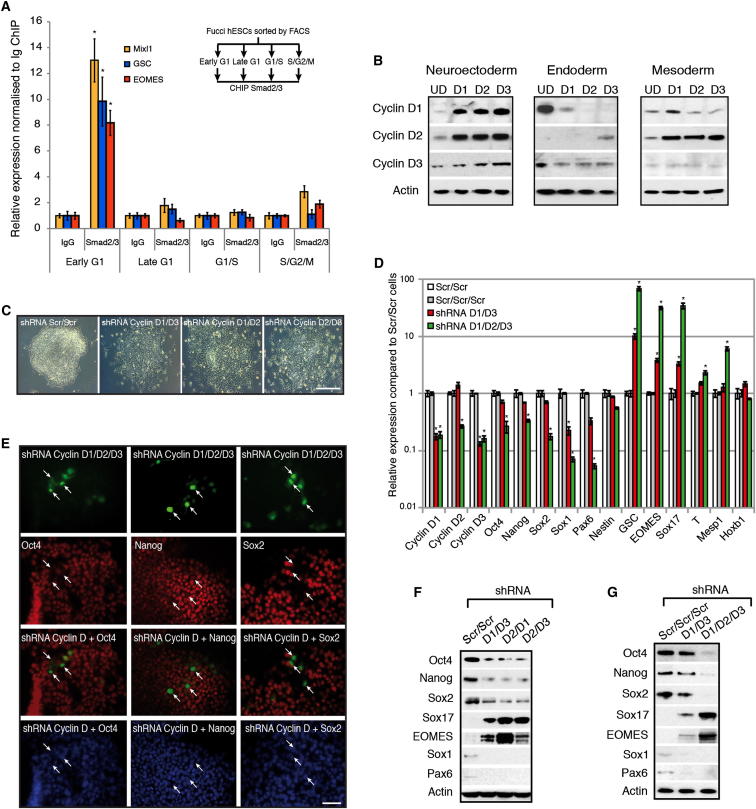
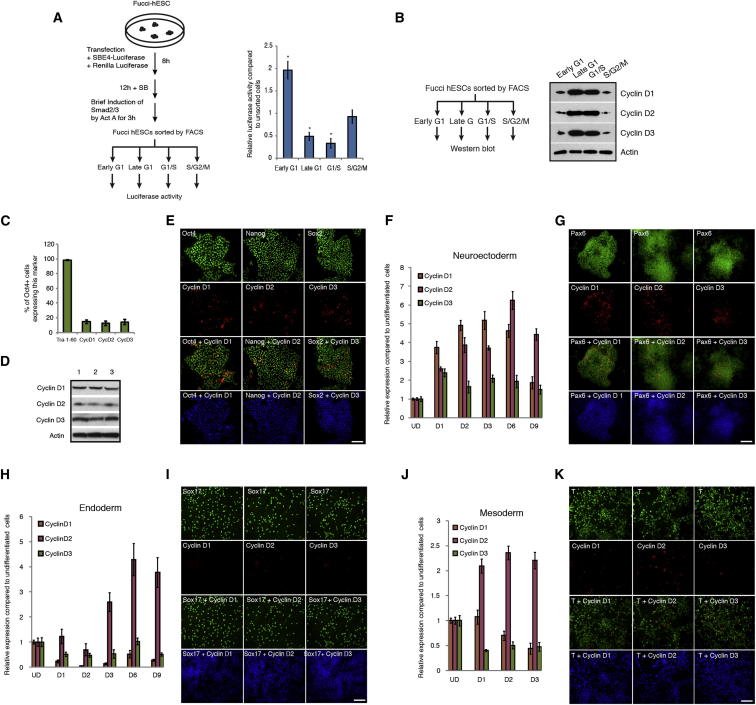
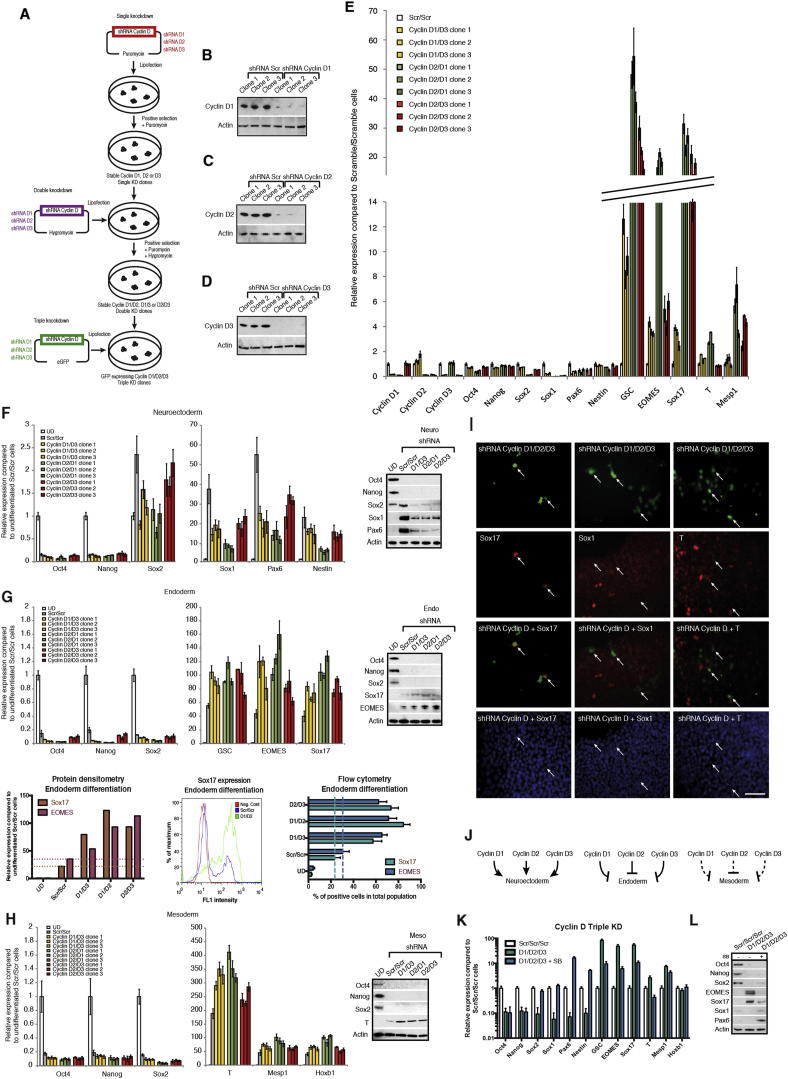
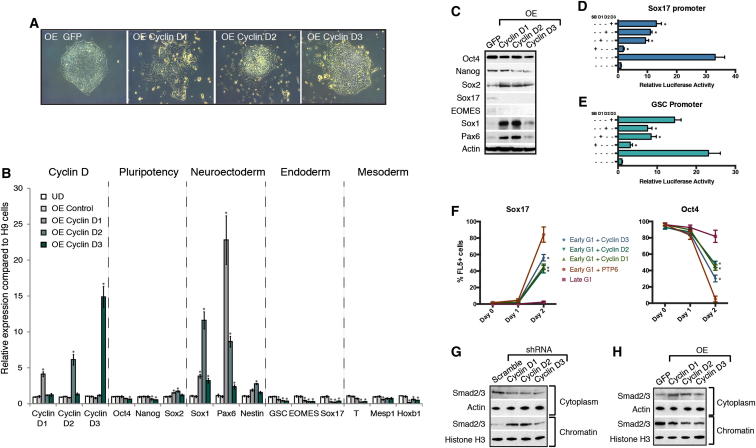
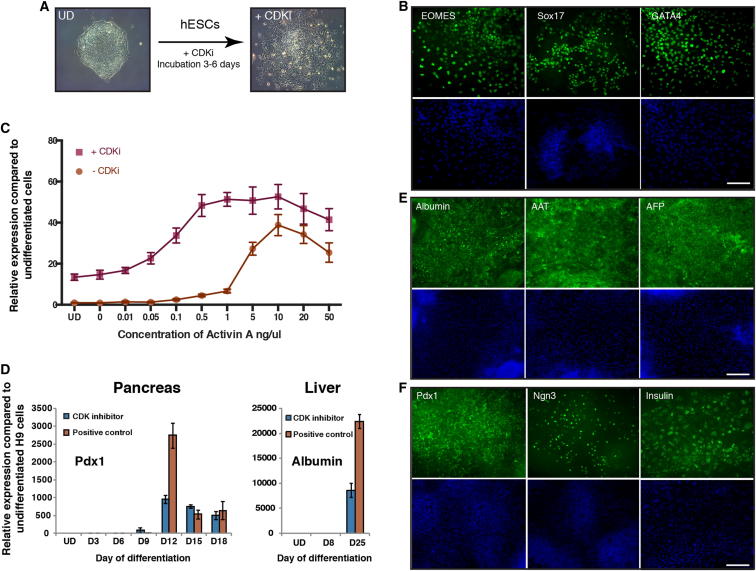
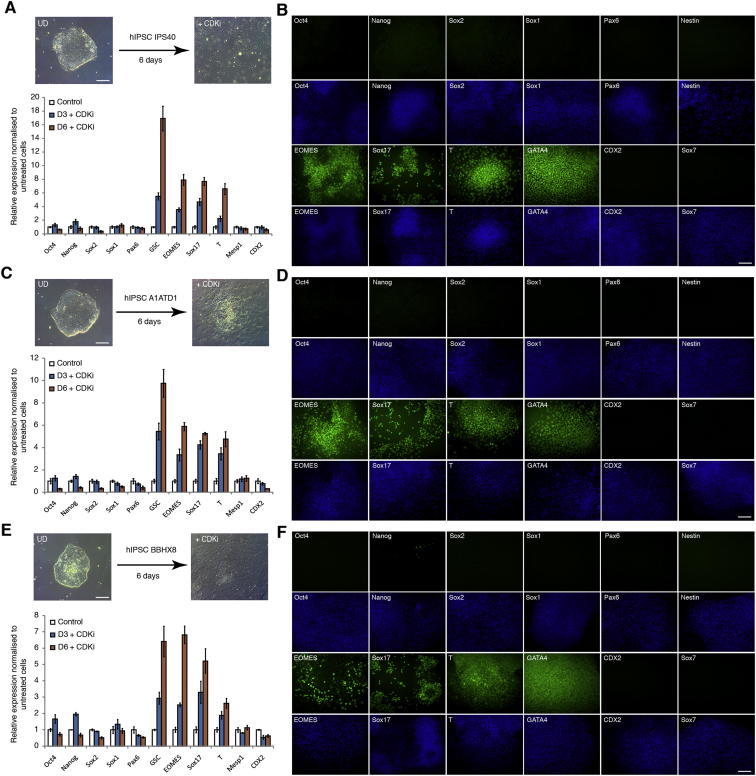
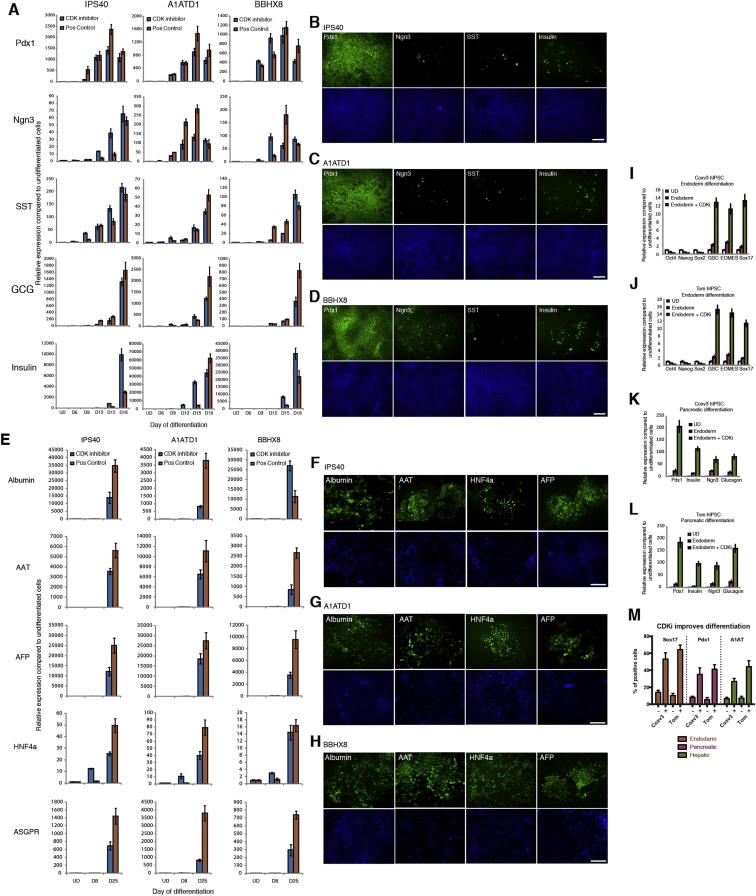
Self-renewal and differentiation of stem cells are fundamentally associated with cell-cycle progression to enable tissue specification, organ homeostasis, and potentially tumorigenesis. However, technical challenges have impaired the study of the molecular interactions coordinating cell fate choice and cell-cycle progression. Here, we bypass these limitations by using the FUCCI reporter system in human pluripotent stem cells and show that their capacity of differentiation varies during the progression of their cell cycle. These mechanisms are governed by the cell-cycle regulators cyclin D1-3 that control differentiation signals such as the TGF-β-Smad2/3 pathway. Conversely, cell-cycle manipulation using a small molecule directs differentiation of hPSCs and provides an approach to generate cell types with a clinical interest. Our results demonstrate that cell fate decisions are tightly associated with the cell-cycle machinery and reveal insights in the mechanisms synchronizing differentiation and proliferation in developing tissues.


Figures

None
Graphical abstract
Figure 1
Figure 1
Generating Fucci-hESCs for Studying Cell-Cycle-Dependent Events in Live Pluripotent Stem Cells (A) Mechanistic overview of the FUCCI system. FUCCI system relies on the fusion of a red and green fluorescent protein (red mKO2 and green mAG) to two cell-cycle-specific proteins (Cdt1 and Geminin). (B) Representative colony of FUCCI-hESCs showing cells in early G1 (no fluorescence), late G1 (red), G1/S transition (yellow), and S/G2/M (green). Scale bar represents 100 μm. (C) Time-lapse imaging of a FUCCI-hESC progressing through the cell cycle. Early G1 cells express neither red mKO2-Cdt1 nor green mAG-Geminin. Late G1 cells express red mKO2-Cdt1. mAG-Geminin starts being expressed in G1/S transition giving the cells a temporal yellow color due to coexpression with mKO2-Cdt1. Cells in S, G2, and M phase expressing only the green mAG-Geminin. During cell division, mAG-Geminin is rapidly degraded and the resulting daughter cells are not fluorescent (arrows). Scale bar represents 5 μm. (D) FUCCI system does not alter the cell-cycle distribution of hESCs. H9 hESCs and FUCCI-hESCs were analyzed for DNA content by flow cytometry and Hoechst staining. (E) Analysis of the relative proportion of FUCCI-hESCs in each cell-cycle phase. FUCCI-hESCs were analyzed by flow cytometry for mAG-Geminin (FL1) and mKO2-Cdt1 (FL2) expression. (F) DNA content analysis of different cell-cycle phases in FUCCI-hESCs. FUCCI-hESCs were stained with Hoechst and subpopulations of cells were gated as shown in (E). Green, early G1 phase; blue, late G1 phase; light blue, G1/S transition; orange, S/G2/M phase; red, total population.
Figure S1
Figure S1
Generating FUCCI-hESCs for Studying Cell-Cycle-Dependent Events in Live Pluripotent Stem Cells, Related to Figure 2 (A) Representative colony of Fucci-hESCs. Fucci-hESCs fixed with 4% PFA and visualized by fluorescence microscopy. Scale bar, 100 μm. (B–E) hESCs differentiate nonsynchronously and nonhomogenously. Live unsorted Fucci-hESCs were differentiated into (B) endoderm and (C) neuroectoderm and analyzed for germ layer and pluripotency marker expression at different time points flow cytometry. Gates depict negative FL5- and positive FL5+ populations. (D-E) Early G1 phase directs endoderm whereas late G1 promotes neuroectoderm differentiation. Live Fucci-hESCs sorted into early G1 phase, late G1, G1/S transition or S/G2/M phase cells were differentiated into (D) endoderm or (E) neuroectoderm and analyzed for germ layer and pluripotency marker expression at different time points by flow cytometry. (F) Overview of the initiation of differentiation in hESCs. Early G1 phase directs cells into endoderm and mesoderm whereas neuroectoderm is blocked. Late G1 phase directs cells into neuroectoderm whereas endoderm and mesoderm is blocked.
Figure 2
Figure 2
The Cell Cycle Directs Differentiation of hESCs (A–C) Cell-cycle-dependent differentiation of hESCs. qPCR analysis for the expression of germ layer markers in FACS sorted Tra-1-60-positive FUCCI-hESCs incubated for 6 hr in culture condition inductive for three germ layers. (D and E) Cell cycle regulates the timing of differentiation in hESCs. Fucci-hESCs sorted into early G1 phase, late G1, G1/S transition, or S/G2/M phase cells were differentiated into (D) endoderm or (E) neuroectoderm and analyzed for germ layer and pluripotency marker expression at different time points by qPCR. (F and G) Early G1 phase directs endoderm whereas late G1 promotes neuroectoderm differentiation. Flow cytometry analysis for the expression of germ layer markers in FACS sorted Fucci-hESCs incubated for up to two days in culture condition inductive for (F) endoderm or (G) neuroectoderm differentiation. (H) Restricted capacity of differentiation during G1 transition. Left: schematic overview of experimental approach. Right: qPCR analysis of neuroectoderm markers in samples (1–4) treated as shown in schematic overview. (I) Schematic presentation of pancreatic differentiation from sorted or unsorted cells. (J) Cell-cycle stage of pluripotent cells affects insulin expression during pancreatic differentiation. Immunostaining of insulin during pancreatic differentiation. (K) Cell-cycle stage affects foregut marker FoxA2 expression. Immunostaining for FoxA2 at day 8 of hepatic differentiation of hESCs sorted in early G1 or late G1 phase. (L) Cell-cycle stage of pluripotent cells affects pancreatic differentiation. Early G1 phase cells differentiating into endoderm improves pancreatic differentiation, whereas late G1 phase cells reduces pancreatic differentiation. (M) Cell-cycle stage affects liver differentiation. Expression of liver markers at day 25 of hepatic differentiation shows variability of developmental potential for cells that were used during initial endoderm differentiation. All data are shown as mean ± SD (n = 3). Student’s t test was performed. p < 0.05. Scale bar represents 100 μm. See also Figure S1.
Figure 3
Figure 3
Cyclin Ds Are Necessary for Pluripotency (A) Cell-cycle-dependent binding of Smad2/3 to endoderm genes. ChIP analyses in Tra-1-60+ sorted FUCCI-hESCs showing Smad2/3 binding on endoderm genes. (B) Cyclin D expression during early differentiation of hESCs. Cyclin D1-3 protein expression during days 1–3 of neuroectoderm, endoderm, and mesoderm differentiation shown by western blot analysis. (C) Morphology of cyclin D double knockdown. Representative colonies of shRNA Scramble and cyclin D double-knockdown cells. (D) Triple knockdown of cyclin D causes endoderm differentiation. cyclin D1/3 double-knockdown cells were transfected with a cyclin D2 shRNA construct expressing GFP and then FACS sorted for qPCR analyses. (E) Triple knockdown of cyclin D causes loss of pluripotency markers. Immunofluorescence microscopy analyses for Oct4, Nanog, and Sox2 expression (red) in cyclin D triple-knockdown hESCs (green / arrows). (F) Double knockdown of cyclin D causes endoderm differentiation and blocks neuroectoderm differentiation. Cyclin D double-knockdown cells were analyzed for germ layer marker expression by western blot. (G) Triple knockdown of cyclin D causes endoderm differentiation. Cyclin D1/3 double-knockdown cells were transfected with a cyclin D2 shRNA construct expressing GFP and then FACS sorted for western blot analyses. UD, undifferentiated cells. Student’s t test was performed. p < 0.05. Scale bar represents 100 μm. See also Figures S2 and S3.
Figure S2
Figure S2
Cyclin D Expression in hESCs and during Germ Layer Specification, Related to Figure 3 (A) Smad2/3 transcriptional activity during progression of the cell cycle. Fucci-hESCs transfected with a reporter for Smad2/3 transcriptional activity (SBE4-luciferase construct) were incubated with Activin A for 3h followed by FACS sorting and analysis of luciferase activity. (B) Cyclin D expression during cell cycle progression in hESCs. Western blot analysis for cyclin D1-D3 expression in FACS sorted Fucci-hESCs. (C) Cyclin D expression in hESCs. Flow cytometry analysis of cyclin D expression in Oct4+ pluripotent cells. (D) Cyclin D expression in hESCs is stable. hESCs were collected at day 3 after three days of splittings and analyzed by western blot. (E) Cyclin D expression in pluripotent cells. Immunofluorescence microscopy of pluripotency markers and cyclin D1-3 in hESCs. (F–K) Cyclin D expression during differentiation of hESCs into neuroectoderm (F, G), endoderm (H, I) and mesoderm (J, K) by Q-PCR and immunostaining, respectively. UD - undifferentiated H9; D1-D9 day 1 to 9. Data shown as mean ± SD (n = 3). Scale bar, 100μm.
Figure S3
Figure S3
Cyclin D Triple Knockdown Causes Loss of Pluripotency, Related to Figure 3 and Table S4 (A) Schematic overview of cyclin D knockdown cell line generation. (B–D) Cyclin D expression in knockdown clones compared to cells transfected with a Scramble shRNA expression vector. Expression of (B) cyclin D1, (C) cyclin D2, (D) cyclin D3 in corresponding knockdown clones. (E) Double knockdown of cyclin D1-D3 decrease neuroectoderm markers and increase endoderm/mesoderm markers. Cyclin D double knockdown cells were analyzed by Q-PCR. (F–H) Differentiation of cyclin D double knockdown cells. Cyclin D double knockdown cells were differentiated into (F) Neuroectoderm, (G) Endoderm or (H) Mesoderm and expression of germ layer markers was analyzed by Q-PCR or western blot. Data are normalized to undifferentiated cells (UD). (G bottom left panel) Protein quantification of western blots by densitometry. (G bottom middle panel) Representative data from endoderm differentiation of cyclin D double knockdown cells. Cells were analyzed by flow cytometry after 3 days of endoderm differentiation. Red – negative control, Blue – Scramble/Scramble cells, Green – Double knockdown of cyclin D1 and cyclin D2. (G bottom right panel) Cyclin D double knockdown increases endoderm differentiation. Cells were analyzed by flow cytometry after 3 days of differentiation. (I) Triple knockdown of cyclin D causes endoderm differentiation. Immunofluorescence microscopy of Sox17, Sox1 and T (red) in cyclin D1/3 double knockdown cells transfected with a cyclin D2 shRNA construct expressing GFP (green). Triple knockdown cells overlap only with Sox17 positive cells (arrows). (J) Schematic representation of cyclin D1-3 function during early differentiation. Cyclin D proteins promote neuroectoderm differentiation while strongly reducing endoderm differentiation and moderately reducing mesoderm differentiation. (K and L) Expression of endoderm markers in cyclin D triple knockdown cells depends on Activin signaling. Triple knockdown cells were treated with Activin/Nodal signaling inhibitor SB-431542 for 48 hr and analyzed by (K) Q-PCR or (L) western blot for marker expression. Scale bar, 100μm. Data shown as mean ± SD (n = 3).
Figure 4
Figure 4
Cyclin D Overexpression in hESCs Induces Neuroectoderm Differentiation (A) Morphology of cyclin D overexpression (OE). Representative colonies of GFP OE and cyclin D OE hESCs. (B and C) Cyclin D OE overexpression causes neuroectoderm differentiation and decreases endoderm markers. Expression of neuroectoderm markers in cyclin D overexpressing cells shown by qPCR (B) or western blot (C). (D and E) Cyclin Ds repress endoderm loci. Luciferase constructs with Sox17 (D) or GSC (E) promoter regions containing Smad2/3 binding sites were cotransfected with cyclin D OE constructs, then differentiated into endoderm for 48 hr and analyzed for luciferase activity. (F) Cyclin Ds repress the initiation of endoderm differentiation in early G1 phase. Fucci-hESCs transfected with cyclin D OE constructs were sorted into early G1 phase and analyzed for marker expression by flow cytometry after endoderm differentiation. (G) Cyclin D knockdown causes the accumulation of Smad2/3 on chromatin. Relative amount of Smad2/3 protein in cytoplasm and on chromatin in cyclin D1-3 knockdown cells compared to Scramble shRNA overexpressing cells. (H) Cyclin D overexpression results in Smad2/3 accumulation in the cytoplasm. Smad2/3 localization in cytoplasm and on chromatin was analyzed in cyclin D1, D2, and D3 overexpressing cells by western blot. All data are shown as mean ± SD. (n = 3). Student’s t test was performed. p < 0.05. See also Figure S4.
Figure S4
Figure S4
Cyclin D Overexpression Induces Neuroectoderm and Blocks Endoderm/Mesoderm, Related to Figure 4 (A) Schematic overview of the approach used to generate cyclin D overexpression (OE) hESC lines. (B–D) Cyclin D overexpression clones. Cyclin D expression in (B) cyclin D1 OE clones, (C) cyclin D2 OE clones or (D) cyclin D3 OE clones compared to OE GFP. All OE cyclin D1, D2 and D3 clones showed a constitutive expression of cyclin D proteins that were similar to endogenous cyclin D levels, thus resembling physiological conditions. (E) Cyclin Ds repress Smad2/3 dependent transcription. H9 cells cotransfected with SBE4-Luc and cyclin D constructs were analyzed for luciferase signal after 48 hr of transfection. (F–H) Overexpression of cyclin D1-D3 results in increased neuroectoderm markers and decreased endoderm/mesoderm markers. Cyclin D OE cells were differentiated into (F) Neuroectoderm, (G) Endoderm or (H) Mesoderm and differentiation markers were analyzed by Q-PCR or western blot. (I and J) Constitutively nuclear Smad2 initiates endoderm differentiation in late G1 cells. Fucci-hESCs transfected with Smad2 constructs were sorted into late G1 phase and analyzed for marker expression by (I) Q-PCR after 6 hr or (J) by flow cytometry 1-2 days after endoderm differentiation. Data are normalized to undifferentiated cells (UD). Scale bar, 100 μm. Data shown as mean ± SD (n = 3).
Figure 5
Figure 5
Cyclin D/CDK4/6 Control Smad2/3 Transcriptional Activity (A) Smad2/3 interacts with cyclin D proteins. Smad2/3 was immunoprecipitated and analyzed for the presence of cyclin D1–3 by western blot. (B) Cyclin D proteins interact with Smad2/3. Cyclin D1–3 were immunoprecipitated and analyzed for the presence of Smad2/3 by western blot. (C) CDK4/6 inhibition by small molecule results in Smad2/3 accumulation on chromatin. hESCs cells were treated with CDK4/6 inhibitor (CDKi or 0.75 μM PD0332991) for 2 hr or 8 hr and then Smad2/3 localization in cytoplasm and on chromatin was analyzed using western blot. (D) Smad2/3 transcriptional activity is repressed in late G1 phase by CDK4/6. Left: schematic overview of the experiment. Right: FUCCI-hESCs were transfected with a Smad2/3-dependent Luciferase expression construct and incubated with Activin A in the presence or absence of 0.75 μM PD0332991. (E and F) CDK4/6 inhibition partially removes the endoderm differentiation blockage from late G1 phase cells. Sorted FUCCI-hESCs were differentiated into endoderm in the presence or absence of 0.75 μM PD0332991 and analyzed by qPCR (E) after 6 hr or flow cytometry (F) after 1–2 days of endoderm differentiation. Student’s t test was performed. p < 0.05.
Figure S5
Figure S5
CDK4/6 Inhibition in hESCs Causes Endoderm Differentiation, Related to Figure 7 (A–D) Cyclin D1 T156A mutant increases endoderm/mesoderm and decreases neuroectoderm differentiation of hESCs. (A) Cyclin D1 T156A overexpressing cells were analyzed by Q-PCR for marker expression or differentiated into (B) Neuroectoderm, (C) Endoderm or (D) Mesoderm and then analyzed by Q-PCR. Data are normalized to undifferentiated cells (UD). Data shown as mean ± SD (n = 3). (E) CDK4/6 inhibition in H9 cell line. hESCs were grown in the presence of CDK4/6 inhibitor 0.75μM PD0332991 for 6 days and analyzed for germ layer marker expression by immunostaining. (F) CDKi-produced endoderm can give rise to pancreatic and hepatic cells. H9 hESCs were differentiated into endoderm with 0.75μM PD0332991 for 6 days and then the resulting cells were grown in culture conditions inducing pancreatic and hepatic differentiation for 12 and 22 days respectively. Marker expression was analyzed by Q-PCR. Conventional endoderm differentiation protocol was used as a positive control for pancreatic and hepatic differentiation. Data shown as mean ± SD (n = 3). (G and H) Immunostaining of negative control cells cultured in the absence of CDKi (G) or positive control cells differentiated with the standard endoderm protocol and stained for endoderm markers (H). (I and J) Immunostaining of negative control cells for liver (I) or pancreatic (J) differentiation. Cells were first cultured in the absence of CDKi and then differentiated into hepatocytes or pancreatic cells and immunostained for the corresponding markers.
Figure 6
Figure 6
Cyclin D-CDK4/6 Regulates Smad2/3 Shuttling in hPSCs by Linker Phosphorylation (A) Smad2/3 intracellular localization and phosphorylation during cell-cycle progression depends on CDK4/6. Cytoplasm and chromatin were isolated from sorted Fucci-hESCs and analyzed by western blot. (B) Smad2/3 phosphorylation by CDK4/6 regulates Smad2/3 localization to chromatin. Cytoplasmic and chromatin fractions were isolated from H9 cells 48 hr after transfection with Flag-tagged Smad2/3 constructs. (C and D) Sorted Smad2/3 linker phosphorylation mutants can initiate endoderm in late G1 phase. Fucci-hESCs transfected with Smad2/3 constructs were sorted into late G1 cells, and analyzed by qPCR after 6 hr of endoderm differentiation (C) or flow cytometry after 1–2 days of endoderm differentiation (D). (E and F) Smad2/3 phosphorylation in linker residues by CDK4/6 blocks Smad2/3 transcriptional activity. FUCCI-hESCs were cotransfected with SBE4-Luc construct together with Smad3 mutant constructs (E) or Smad2 mutant constructs (F), sorted after 48 hr into late G1 phase and analyzed for luciferase activity. CDK4/6 was inhibited by 0.75 μM PD0332991 for 6 hr prior to analysis. Student’s t test was performed. p < 0.05.
Figure 7
Figure 7
CDKi Treatment Induces Differentiation of hPSCs (A) Representative colonies of untreated hESCs and CDKi (0.75 μM PD0332991)-treated cells. (B) CDK4/6 inhibition results in endoderm differentiation. hESCs grown for 6 days in the presence of CDKi (0.75 μM PD0332991) were analyzed for the expression of germ layer markers using immunofluorescence microscopy. (C) CDK4/6 can replace Activin A during endoderm differentiation. H9 cells were incubated in the presence or absence of 0.75 μM CDKi in standard endoderm differentiation conditions and analyzed for Sox17 expression by qPCR. (D and E) Endoderm cells generated by CDKi can give rise to cells expressing hepatic markers. CDKi-produced endoderm was grown for 25 days in culture conditions for hepatic differentiation and then the expression of hepatocyte markers was analyzed using qPCR (D) or immunostaining (E). (F) Endoderm generated by CDKi can give rise to pancreatic cells. CDKi produced endoderm was grown for 18 days in culture conditions for pancreatic differentiation and then the expression of pancreatic markers was analyzed using qPCR (D) or immunostaining (F). Scale bar represents 100 μm. All data are shown as mean ± SD (n = 3). UD, undifferentiated cells. See also Figures S5, S6, S7, and Table S5.
Figure S6
Figure S6
CDK4/6 Inhibition in hIPSCs Causes Endoderm Differentiation, Related to Figure 7 IPSCs were cultured in the presence of 0.75μM PD0332991 for 6 days and analyzed by (A) Q-PCR or (B) immunostaining in IPS40 cell line, by (C) Q-PCR or (D) immunostaining in A1ATD1 cell line and by (E) Q-PCR or (F) immunostaining in BBHX8 cell line. Data shown as mean ± SD (n = 3). Scale bar, 100μm.
Figure S7
Figure S7
hIPSC CDKi-Produced Endoderm Can Give Rise to Pancreatic and Hepatic Cells, Related to Figure 7 (A–D) Analysis of pancreatic differentiation in hIPSCs. IPS40, A1ATD1 and BBHX8 cells were differentiated into endoderm with 0.75μM PD0332991 for 6 days and then further into pancreatic cells. Cells were analyzed by (A) Q-PCR or immunostaining at day 18 (day 12 for Pdx1) in (B) IPS40, (C) A1ATD1 or (D) BBHX8. Conventional endoderm differentiation protocol was used as a positive control. (E–H) Hepatic differentiation of endoderm cells generated from hIPSCs using CDKi. IPS40, A1ATD1 and BBHX8 cells were differentiated into endoderm with 0.75μM PD0332991 for 6 days and then further into hepatocytes. Cells were analyzed by (E) Q-PCR or by immunofluorescence microscopy at day 25 in (F) IPS40, (G) A1ATD1 or (H) BBHX8. Conventional hepatic differentiation protocol was used as a positive control. (I and J) CDK4/6 inhibition improves endoderm differentiation in endoderm-resistant hIPSCs Coxv3 and Tom. Cells were differentiated into endoderm by adding 0.75μM PD0332991 to conventional differentiation conditions for 6 days. (K and L) Cells were differentiated into endoderm with 0.75μM PD0332991 for 6 days and then further into pancreatic cells and analyzed by Q-PCR, or (M) by flow cytometry after endoderm, pancreatic or hepatic differentiation. Data shown as mean ± SD (n = 3). Scale bar, 100μm.

Comment in

References

    1. Brons I.G., Smithers L.E., Trotter M.W., Rugg-Gunn P., Sun B., Chuva de Sousa Lopes S.M., Howlett S.K., Clarkson A., Ahrlund-Richter L., Pedersen R.A., Vallier L. Derivation of pluripotent epiblast stem cells from mammalian embryos. Nature. 2007;448:191–195. - PubMed
    1. Brown S., Teo A., Pauklin S., Hannan N., Cho C.H., Lim B., Vardy L., Dunn N.R., Trotter M., Pedersen R., Vallier L. Activin/Nodal signaling controls divergent transcriptional networks in human embryonic stem cells and in endoderm progenitors. Stem Cells. 2011;29:1176–1185. - PubMed
    1. Calder A., Roth-Albin I., Bhatia S., Pilquil C., Lee J.H., Bhatia M., Levadoux-Martin M., McNicol J., Russell J., Collins T. Lengthened G1 phase indicates differentiation status in human embryonic stem cells. Stem Cells Dev. 2013;22:279–295. - PubMed
    1. Chambers S.M., Fasano C.A., Papapetrou E.P., Tomishima M., Sadelain M., Studer L. Highly efficient neural conversion of human ES and iPS cells by dual inhibition of SMAD signaling. Nat. Biotechnol. 2009;27:275–280. - PMC - PubMed
    1. Chng Z., Teo A., Pedersen R.A., Vallier L. SIP1 mediates cell-fate decisions between neuroectoderm and mesendoderm in human pluripotent stem cells. Cell Stem Cell. 2010;6:59–70. - PubMed

Supplemental References

    1. Pratt T., Sharp L., Nichols J., Price D.J., Mason J.O. Embryonic stem cells and transgenic mice ubiquitously expressing a tau-tagged green fluorescent protein. Dev. Biol. 2000;228:19–28. - PubMed
    1. Rashid S.T., Corbineau S., Hannan N., Marciniak S.J., Miranda E., Alexander G., Huang-Doran I., Griffin J., Ahrlund-Richter L., Skepper J. Modeling inherited metabolic disorders of the liver using human induced pluripotent stem cells. J. Clin. Invest. 2010;120:3127–3136. - PMC - PubMed
    1. Touboul T., Hannan N.R., Corbineau S., Martinez A., Martinet C., Branchereau S., Mainot S., Strick-Marchand H., Pedersen R., Di Santo J. Generation of functional hepatocytes from human embryonic stem cells under chemically defined conditions that recapitulate liver development. Hepatology. 2010;51:1754–1765. - PubMed

Publication types