. 2013 Sep 26;155(1):172-87.
doi: 10.1016/j.cell.2013.09.003.

Mitofusin 2 in POMC neurons connects ER stress with leptin resistance and energy imbalance

Affiliations

Mitofusin 2 in POMC neurons connects ER stress with leptin resistance and energy imbalance

Marc Schneeberger et al. Cell. .

Abstract

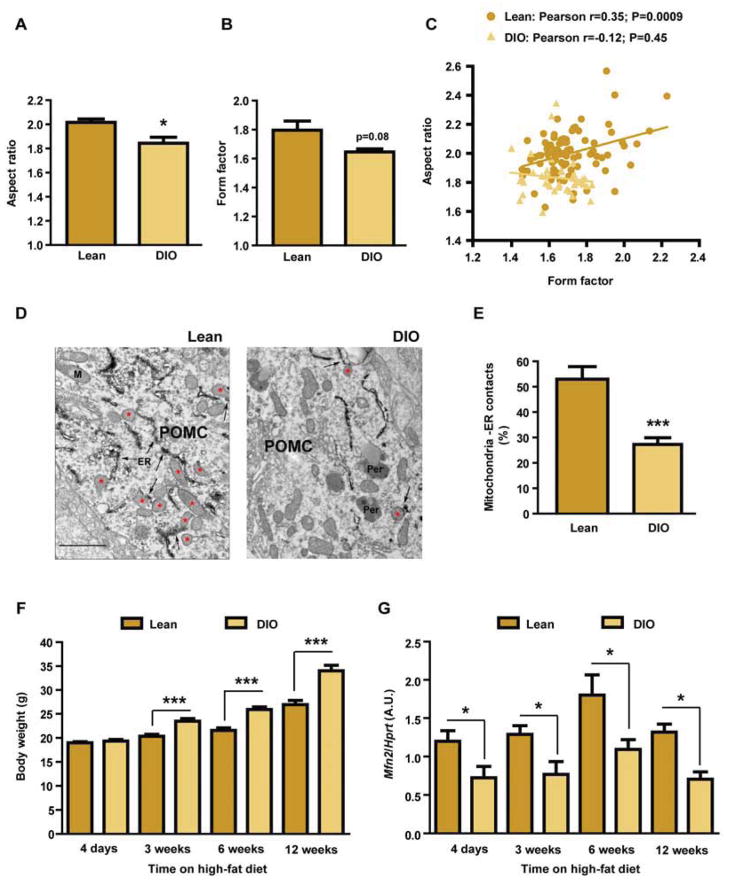
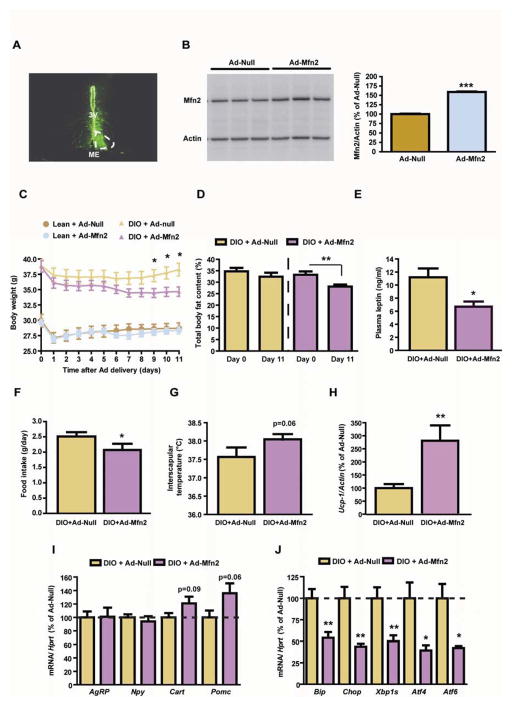
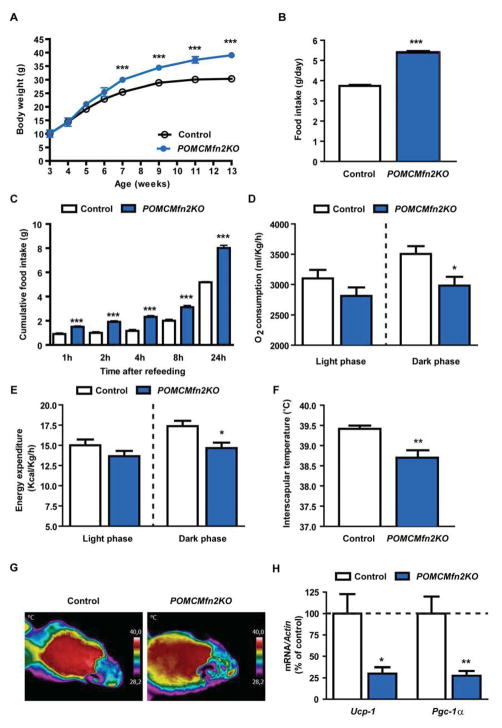
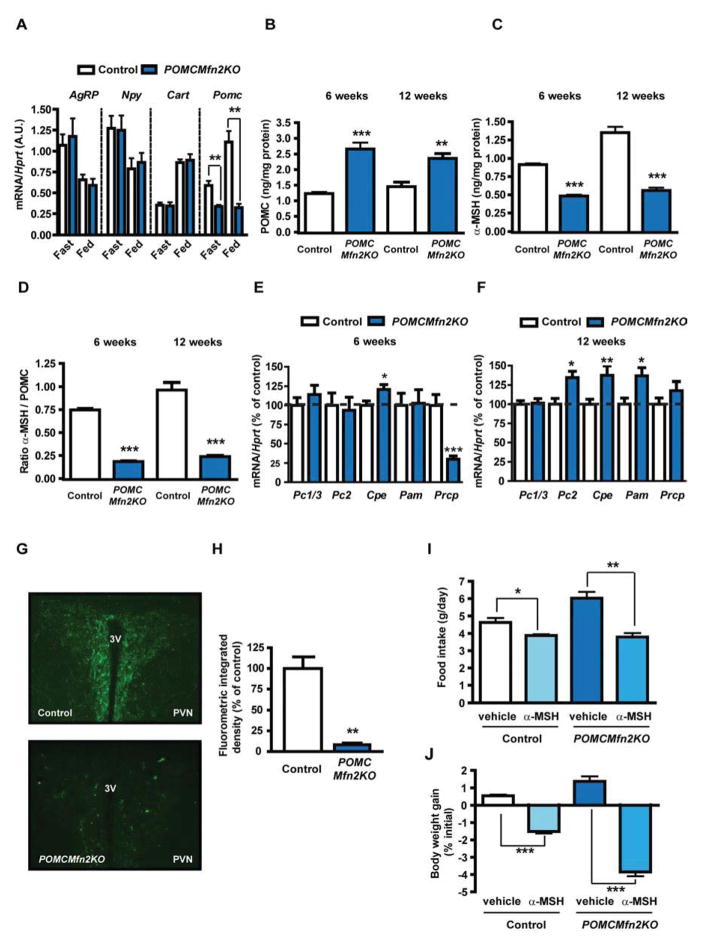
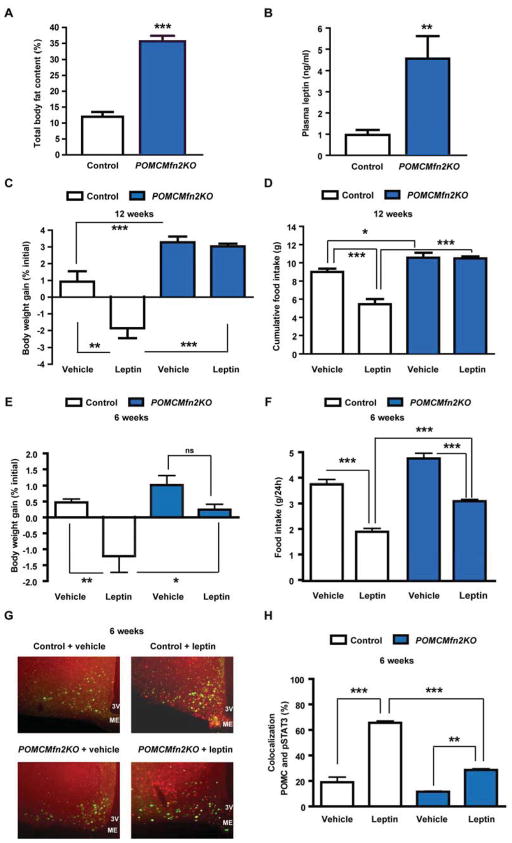
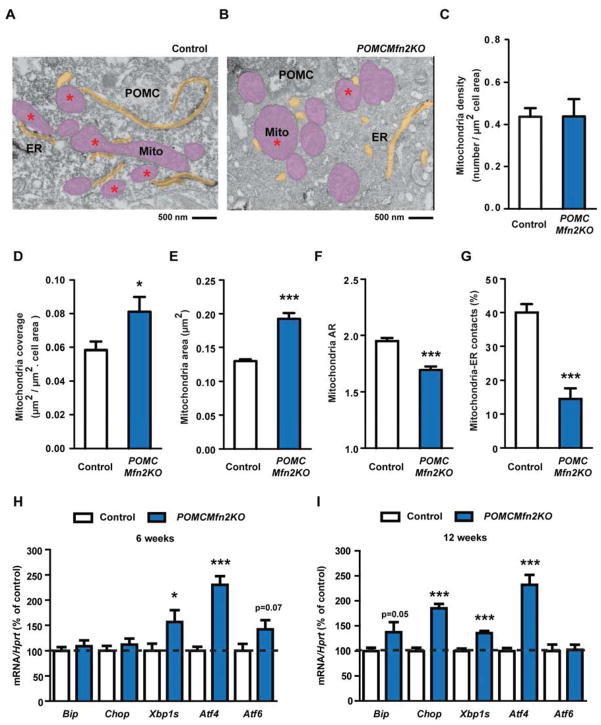
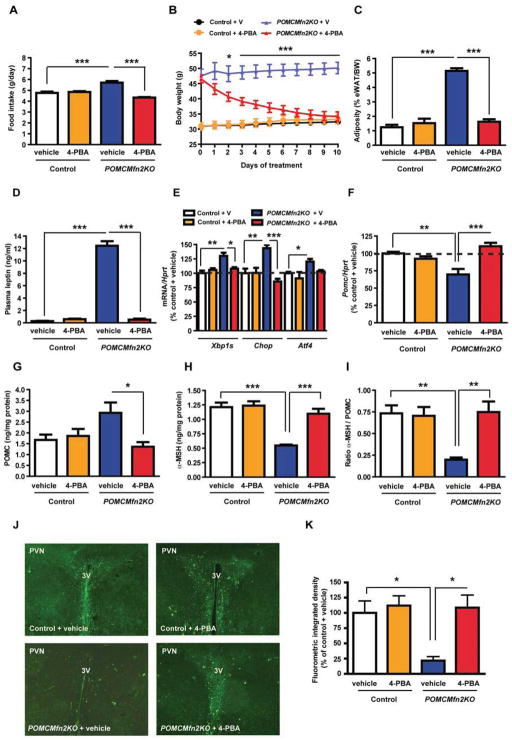
Mitofusin 2 (MFN2) plays critical roles in both mitochondrial fusion and the establishment of mitochondria-endoplasmic reticulum (ER) interactions. Hypothalamic ER stress has emerged as a causative factor for the development of leptin resistance, but the underlying mechanisms are largely unknown. Here, we show that mitochondria-ER contacts in anorexigenic pro-opiomelanocortin (POMC) neurons in the hypothalamus are decreased in diet-induced obesity. POMC-specific ablation of Mfn2 resulted in loss of mitochondria-ER contacts, defective POMC processing, ER stress-induced leptin resistance, hyperphagia, reduced energy expenditure, and obesity. Pharmacological relieve of hypothalamic ER stress reversed these metabolic alterations. Our data establish MFN2 in POMC neurons as an essential regulator of systemic energy balance by fine-tuning the mitochondrial-ER axis homeostasis and function. This previously unrecognized role for MFN2 argues for a crucial involvement in mediating ER stress-induced leptin resistance.


Figures

Figure 1
Figure 1. Mitochondrial network complexity and mitochondria-ER contacts in POMC neurons are altered in DIO mice
(A–C) Mitochondrial network complexity analysis in POMC neurons from 18-week old male C57Bl/6 lean and DIO mice. (D) Representative electron microscopy images and (E) quantification of mitochondria-ER contacts in POMC neurons from male C57Bl/6 lean and DIO mice. Red asterisks show mitochondria in contact with ER (arrows). Note reduced number of mitochondria-ER contacts in POMC neurons from DIO mice. ER: endoplasmic reticulum; Per: peroxisome. (F) Body weight and (G) Mfn2 expression levels in the hypothalamus of lean and DIO mice at different time points during a high-fat diet time-course study (n=7–8/group/time point). Data are expressed as mean ± SEM. *P<0.05. ***P<0.001. See also Figure S1.
Figure 2
Figure 2. Adenoviral-mediated overexpression of Mfn2 in the ARC of DIO mice ameliorates their metabolic disturbances
(A) Localization studies using an Ad-GFP showing specific delivery in the mouse ARC. For comparative purposes infection in one side of the ARC is shown. 3V: third ventricle; ME: median eminence. (B) Mfn2 western blot and densitometric quantification of ARC-enriched lysates 3 days after the delivery of Ad-Null or Ad-Mfn2. Loading control (β-Actin) is shown. (C) Body weight profile, (D) adiposity, (E) plasma leptin, (F) food intake and (G) interscapular temperature. (H) Expression of thermogenic marker Ucp-1 in BAT. Probe for Actin was used to adjust for total RNA content. (I) Hypothalamic expression of neuropeptides and (J) ER stress markers. Probe for Hprt was used to adjust for total RNA content. All studies were conducted in male 18 week old lean and/or DIO mice injected intra-ARC with Ad-Null or Ad-Mfn2 (n=10/group). Data are expressed as mean ± SEM. *P<0.05; **P<0.01.
Figure 3
Figure 3. Mice lacking Mfn2 in POMC neurons are obese due to increased food intake and reduced thermogenesis
(A) Body weight profile on chow diet. (B) Daily food intake in control (n=6) and POMCMfn2KO (n=13) mice. (C) Fast-refeeding test in control (n=6) and POMCMfn2KO (n=13) mice. (D) Daily oxygen consumption and (E) energy expenditure in control (n=7) and POMCMfn2KO (n=8) mice. (F) Basal interscapular temperature adjacent to the BAT depot and (G) representative thermographic images of control (n=6) and POMCMfn2KO (n=7) mice. (H) Gene expression analysis of thermogenic markers in BAT from control (n=6) and POMCMfn2KO (n=6) mice. Probe for Actin was used to adjust for total RNA content. All studies were conducted in male 12–14 week old control and POMCMfn2KO mice. Data are expressed as mean ± SEM. *P<0.05; **P<0.01; ***P<0.001. See also Figure S2.
Figure 4
Figure 4. Loss of Mfn2 in POMC neurons causes defective POMC processing
(A) Neuropeptide expression in the hypothalamus from 12-week old male control (n=6–10) and POMCMfn2KO (n=6) mice under fed and fasting conditions. Probe for Hprt was used to adjust for total RNA content. (B) Total hypothalamic POMC and (C) α-MSH content in 6 and 12-week old male control (n=6) and POMCMfn2KO (n=7) mice. (D) POMC processing as measured by α-MSH/POMC ratio. (E–F) Expression analysis of POMC processing genes in the hypothalamus from 6 and 12-week old male control (n=9–13) and POMCMfn2KO (n=6–8) mice. (G) Representative immunofluorescence images showing α-MSH staining in the PVN from 12-week old male control (n=3) and POMCMfn2KO (n=3) mice and (H) integrated density quantification. (I) Food intake and (J) body weight gain in 12-week old male control (n=4) and POMCMfn2KO (n=5) mice after acute i.c.v. injection of α-MSH. Data are expressed as mean ± SEM. *P<0.05; **P<0.01; ***P<0.001. 3V: third ventricle. PVN: paraventricular nucleus. See also Figure S3.
Figure 5
Figure 5. Deficiency of Mfn2 in POMC neurons leads to primary leptin resistance
(A) Body fat content and (B) plasma leptin in male control (n=6) and POMCMfn2KO (n=7) mice at 12–14 weeks of age. (C–D) Body weight gain and cumulative food intake in 12–14 week old male control (n=7) and POMCMfn2KO (n=8) mice after 3-day leptin injection. (E–F) Daily body weight gain and food intake in 6-week old male control (n=6) and POMCMfn2KO (n=6) mice after an acute leptin sensitivity test. (G–H) Representative images showing double immunofluorescence examining pStat3 in POMC neurons and percentage of colocalization after vehicle or leptin stimulation in 6 week old POMCZ/EG (n=3) and POMCMfn2KOZEG (n=3) mice. Data are expressed as mean ± SEM. *P<0.05; **P<0.01; ***P<0.001. 3V: third ventricle. ME: median eminence. ns: not significant. See also Figures S4.
Figure 6
Figure 6. Deletion of Mfn2 in POMC neurons alters mitochondrial morphology, mitochondrial-ER contacts and induces ER stress
(A–B) Representative electron microscopy images of POMC neurons from 12-week old male control (A) and POMCMfn2KO (B) mice. Mitochondria (Mito: pink areas) and endoplasmic reticulum (ER: yellow areas) are shown. Red asterisk shows mitochondria in contact with ER. (C) Mitochondria density, (D) mitochondria coverage, (E) mitochondria area and (F) mitochondria aspect ratio (AR) in POMC neurons from 12-week old male control (n=5; 1198 mitochondria from 30 POMC neurons) and POMCMfn2KO (n=3; 530 mitochondria from 15 POMC neurons) mice. (G) Percentage of mitochondria-ER contacts in POMC neurons from 12-week old male control (n=5; 32 POMC neurons) and POMCMfn2KO (n=3; 17 POMC neurons) mice. (H) Gene expression analysis of ER-stress markers in the hypothalamus from 6-week old male control (n=10–15) and POMCMfn2KO (n=8–12) mice. (I) Gene expression analysis of ER-stress markers in the hypothalamus from 12-week old male control (n=21–23) and POMCMfn2KO (n=16–18) mice. Probe for Hprt was used to adjust for total RNA content. Data are expressed as mean ± SEM. *P<0.05; ***P<0.001. See also Figures S5.
Figure 7
Figure 7. Restoration of energy homeostasis in POMCMFN2KO mice by 4-phenyl butyric acid (4-PBA) administration
Effects of 10-day i.c.v. 4-PBA administration in 14-week old male control (n=8) and POMCMfn2KO (n=8) mice on: (A) Daily food intake. (B) Body weight. (C) Adiposity. (D) Plasma leptin. (E) Expression of ER stress markers in the hypothalamus (n=4/genotype/treatment). (F) Pomc mRNA expression (n=4/genotype/treatment). (G) Hypothalamic POMC content (n=4/genotype/treatment). (H) Hypothalamic α-MSH content (n=4/genotype/treatment). (I) α-MSH/POMC ratio. (J) Representative immunofluorescence images showing α-MSH staining in the PVN and (K) integrated density quantification (n=3/genotype/treatment). Probe for Hprt was used to adjust for total RNA content. Data are expressed as mean ± SEM. *P<0.05; **P<0.01; ***P<0.001. eWAT: epididymal white adipose tissue; BW: body weight; V: vehicle. 3V: third ventricle. PVN: paraventricular nucleus. See also Figure S6.

Comment in

References

    1. Al-Qassab H, Smith MA, Irvine EE, Guillermet-Guibert J, Claret M, Choudhury AI, Selman C, Piipari K, Clements M, Lingard S, et al. Dominant role of the p110beta isoform of PI3K over p110alpha in energy homeostasis regulation by POMC and AgRP neurons. Cell Metab. 2009;10:343–354. - PMC - PubMed
    1. Bach D, Naon D, Pich S, Soriano FX, Vega N, Rieusset J, Laville M, Guillet C, Boirie Y, Wallberg-Henriksson H, et al. Expression of Mfn2, the Charcot-Marie-Tooth neuropathy type 2A gene, in human skeletal muscle: effects of type 2 diabetes, obesity, weight loss, and the regulatory role of tumor necrosis factor alpha and interleukin-6. Diabetes. 2005;54:2685–2693. - PubMed
    1. Bach D, Pich S, Soriano FX, Vega N, Baumgartner B, Oriola J, Daugaard JR, Lloberas J, Camps M, Zierath JR, et al. Mitofusin-2 determines mitochondrial network architecture and mitochondrial metabolism. A novel regulatory mechanism altered in obesity. J Biol Chem. 2003;278:17190–17197. - PubMed
    1. Baltzer C, Tiefenbock SK, Frei C. Mitochondria in response to nutrients and nutrient-sensitive pathways. Mitochondrion. 2010;10:589–597. - PubMed
    1. Bjorbaek C. Central leptin receptor action and resistance in obesity. J Investig Med. 2009;57:789–794. - PMC - PubMed

Publication types