. 2013 Sep 26;51(6):751-65.
doi: 10.1016/j.molcel.2013.08.048.

BID preferentially activates BAK while BIM preferentially activates BAX, affecting chemotherapy response

Affiliations

BID preferentially activates BAK while BIM preferentially activates BAX, affecting chemotherapy response

Kristopher A Sarosiek et al. Mol Cell. .

Abstract

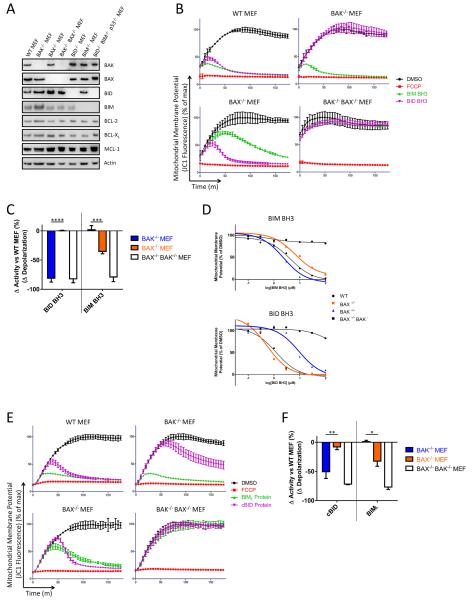
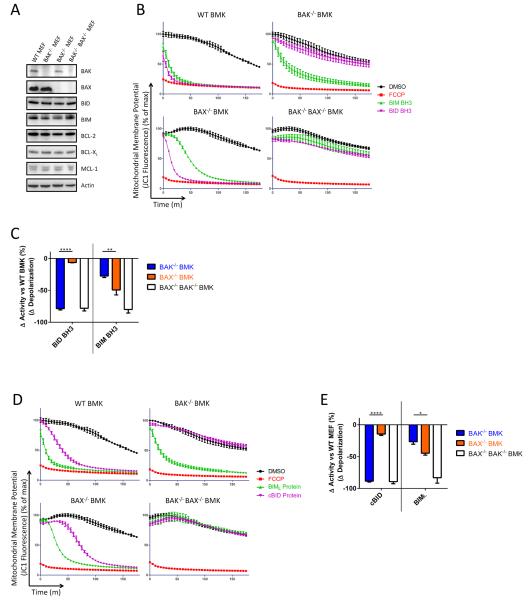
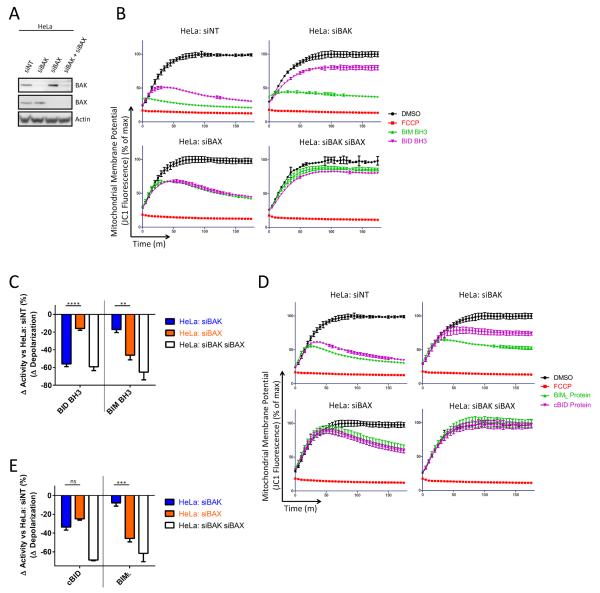
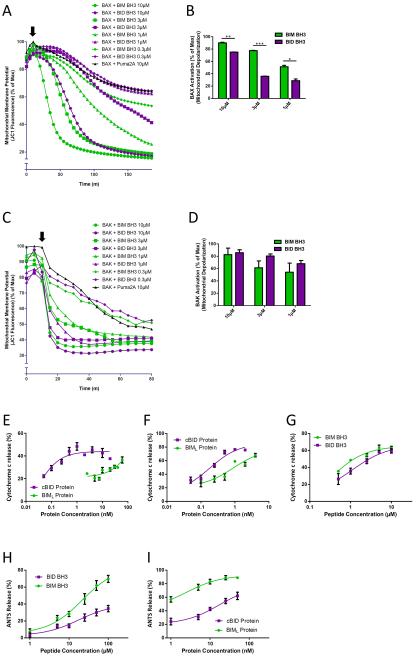
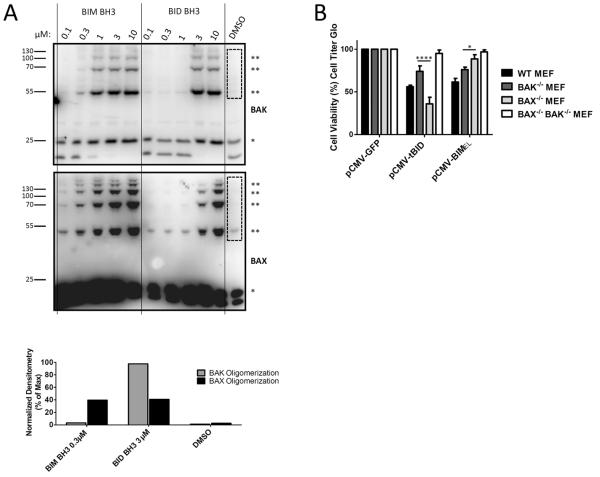
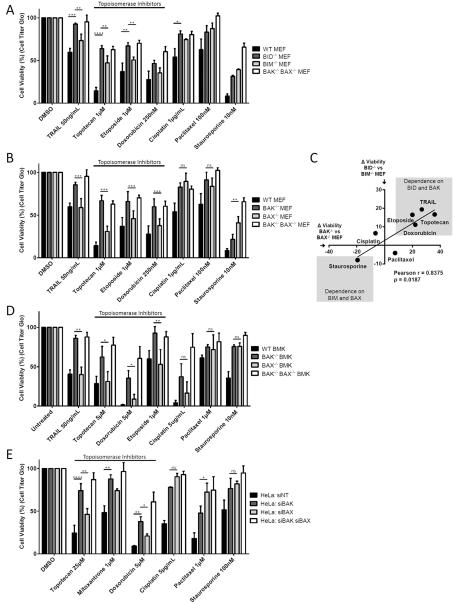
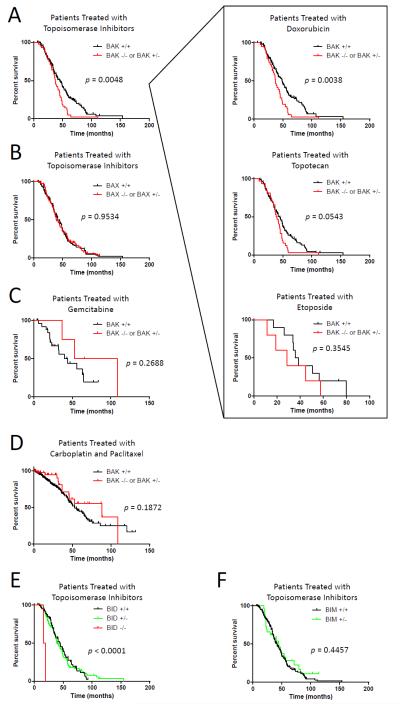
Apoptosis is a highly regulated form of cell death that controls normal homeostasis as well as the antitumor activity of many chemotherapeutic agents. Commitment to death via the mitochondrial apoptotic pathway requires activation of the mitochondrial pore-forming proteins BAK or BAX. Activation can be effected by the activator BH3-only proteins BID or BIM, which have been considered to be functionally redundant in this role. Herein, we show that significant activation preferences exist between these proteins: BID preferentially activates BAK while BIM preferentially activates BAX. Furthermore, we find that cells lacking BAK are relatively resistant to agents that require BID activation for maximal induction of apoptosis, including topoisomerase inhibitors and TRAIL. Consequently, patients with tumors that harbor a loss of BAK1 exhibit an inferior response to topoisomerase inhibitor treatment in the clinic. Therefore, BID and BIM have nonoverlapping roles in the induction of apoptosis via BAK and BAX, affecting chemotherapy response.


Figures

Figure 1
Figure 1
BID and BIM preferentially activate BAK and BAX, respectively, in mouse embryonic fibroblasts (MEFs). (A) Western blotting was performed for the indicted proteins. Representative, 3 IEs (independent experiments). (B) Digitonin-permeabilized MEFs were treated with the mitochondrial potential-sensitive dye JC1 and mitochondrial potential was monitored over 180 minutes in the presence of BIM (10μM) or BID (3μM) BH3 peptides. DMSO served as a negative control (fully polarized mitochondria) while FCCP served as positive control (fully depolarized mitochondria). Representative, 3 IEs. (C) The difference in mitochondrial depolarization by peptides was calculated from (B) and compared. Mean ± SE, 3 IEs. (D) Dose-response curves for BIM and BID BH3 peptide treatment of MEFs for calculation of EC50. Representative, 3 IEs. (E) Mitochondrial polarization was monitored in MEFs in the presence of BIML (30nM) or cBID (30nM) proteins. Representative, 3 IEs. (F) The difference in mitochondrial depolarization by proteins was calculated from (E) and compared. Mean ± SE, 3 IEs. See also Figures S1, S2, and S3 and Table S1.
Figure 2
Figure 2
BID and BIM preferentially activate BAK and BAX, respectively, in baby mouse kidney (BMK) epithelial cells. (A) Western blotting was performed for the indicted proteins. Representative, 2 IEs. (B) Mitochondrial polarization was monitored in digitonin-permeabilized BMKs in the presence of BIM (100μM) or BID (100μM) BH3 peptides. Representative, 3 IEs. (C) The difference in mitochondrial depolarization by peptides was calculated from (B) and compared. Mean ± SE, 3 IEs (D) Mitochondrial polarization was monitored in BMKs of indicated genotype in the presence of BIML (100nM) or cBID (30nM) proteins. Representative, 3 IEs. (E) The difference in mitochondrial depolarization by proteins was calculated from (D) and compared. Mean ± SE, 3 IEs. See also Figure S1.
Figure 3
Figure 3
BID and BIM induce preferential activation of BAK and BAX, respectively, in human cancer cells. (A) HeLa cells were transfected with siRNA that was non-targeting (siNT) or specific for BAX or BAK. Western blotting was used to confirm knockdown of target proteins. Representative, 3 IEs. (B) Mitochondrial polarization was monitored in digitonin-permeabilized HeLa cells in the presence of BIM (100μM)or BID (100μM) BH3 peptides. Representative, 3 IEs. (C) The difference in mitochondrial depolarization by peptides was calculated from (B) and compared. Mean ± SE, 3 IEs (D) Mitochondrial polarization was monitored in HeLa cells in the presence of BIML (100nM) or cBID (30nM) proteins. Representative, 3 IEs. (E) The difference in mitochondrial depolarization by proteins was calculated from (D) and compared. Mean ± SE, 3 IEs. See also Figure S4.
Figure 4
Figure 4
BID preferentially activates BAK while BIM preferentially activates BAX. (A) Mitochondrial polarization was monitored in digitonin-permeabilized BAX−/− BAK−/− MEFs while initially treated over 10 minutes in the presence of recombinant BAX. BIM or BID BH3 peptides were then spiked in (arrow) and mitochondrial polarization continued to be monitored. Addition of PUMA2A peptide served as negative control for background depolarization caused by BAX. Representative, 3 IEs. (B) Percent depolarization was calculated from (A) for comparison of BAX activation induced by BIM and BID BH3 peptides. Mean ± SE, 3 IEs. (C) Mitochondrial polarization was monitored in digitonin-permeabilized BAX−/− BAK−/− MEFs while initially treated for 10 minutes in the presence of recombinant BAK. BIM or BID BH3 peptides were then spiked in (arrow) and mitochondrial polarization continued to be monitored. Representative, 2 IEs. (D) Percent depolarization was calculated from (C) for comparison of BAK activation induced by BIM and BID BH3 peptides. Mean ± SE, 2 IEs. (E) Heavy membranes, including mitochondria, were isolated from WT mouse livers which express BAK, but not BAX. Mitochondria were treated with the indicated concentrations of cBID and BIML protein and cytochrome c release was measured. Mean ± SE, 3 IEs. (F–G) Heavy membranes, including mitochondria, were isolated from BAK−/− mouse livers which do not contain BAX or BAK. Mitochondria were then incubated in the presence of recombinant BAX and indicated concentrations of cBID and BIML proteins (F) or BID and BIM BH3 peptides (G) and cytochrome c release was measured. Mean ± SE, 3 IEs. (H–I) ANTS release was monitored in liposomes in the presence of recombinant BAX and indicated concentrations of BID and BIM BH3 peptides (H) or cBID and BIML proteins (I). Addition of only BAX or BIM/BID alone at highest doses shown yielded a background ANTS release of less than 5%. Mean ± SE, 3 IEs. See also Figure S5.
Figure 5
Figure 5
BID preferentially crosslinks and activates BAK while BIM preferentially crosslinks and activates BAX. (A) Heavy membranes including mitochondria were isolated from MEFs lacking BIM, BID and p53 and were treated with the indicated concentrations of BH3 peptides. Samples were then treated with the crosslinking agent BMH and analyzed by western blotting for crosslinking of BAX and BAK. * = monomeric BAK and BAX; ** = oligomerized BAK and BAX. Densitometry was performed in area indicated by dashed rectangle for comparison of oligomerization efficiency. Representative, 2 IEs. (B) MEFs of the indicated genotype were plated in a 96-well plate and transfected with plasmids (0.1μg/well) encoding either GFP, or untagged tBID or BIMEL in the pCMV vector. After 24 hours, cell viability was assessed using CellTiterGlo. Mean ± SE, 4 IEs. See also Figure S6.
Figure 6
Figure 6
BID and BAK are necessary for maximal effectiveness of topoisomerase inhibitors. (A–B) MEFs were treated with the indicated agents and after 24 hours (TRAIL) or 48 hours (all other agents), viability was assessed by measuring total ATP levels with CellTiterGlo reagent. Mean ± SE, 4 IEs. (C) The dependence of chemotherapeutic agents on BIM, BID, BAX and BAK (difference in viability observed in MEFs from [A] and [B]) was compared. (D) BMK cells were treated with the indicated agents and after 24 hours (TRAIL, doxorubicin and cisplatin) or 48 hours (all other agents), viability was assessed using CellTiterGlo. Mean ± SE, 3 IEs. (E) HeLa cells were transfected with the indicated siRNAs and, 48 hours later, treated with the indicated agents. Viability was assessed at 24 hours for all agents except topotecan and paclitaxel (48 hours) using CellTiterGlo. Mean ± SE 3 IEs. See also Figure S7, S8 and S9.
Figure 7
Figure 7
Patients treated with topoisomerase inhibitors respond poorly when exhibiting a loss of BAK. (A–D) DNA copy number analysis was performed on patients with a confirmed diagnosis of high-grade serous ovarian adenocarcinoma as part of the TCGA study. (A) Overall survival (OS) was compared in patients treated with topoisomerase inhibitors (topotecan, etoposide, mitoxantrone and doxorubicin) that exhibited a loss of one or both alleles of BAK (n=43 patients) and those that had not (n=142). OS was also compared in patients being treated with each topoisomerase inhibitor separately (inset): doxorubicin (BAK+/+ n=113; BAK+/− or BAK−/− n=38), topotecan (BAK+/+ n=88; BAK+/− or BAK−/− n=32), or etoposide (BAK+/+ n=15; BAK+/− or BAK−/− n=5). OS was not compared in patients treated with mitoxantrone due to low number of patients receiving this therapy (n=1). (B) OS was compared in patients treated with topoisomerase inhibitors that exhibited a loss of one or both alleles of BAX (n=85) and those that had not (n=100). (C) OS was compared in patients treated with gemcitabine that exhibited a loss of one or both alleles of BAK (n=4) and those that had not (n=30). (D) OS was compared in patients treated with carboplatin and paclitaxel but not topoisomerase inhibitors that exhibited a loss of one or both alleles of BAK (n=47) and those that had not (n=281). (E) OS was compared in patients treated with topoisomerase inhibitors that exhibited a loss of one (n=102) or both (n=2) alleles of BID and those that had not (n=81). (F) OS was compared in patients treated with topoisomerase inhibitors that exhibited a loss of one allele of BIM (n=29) and those that had not (n=156). No patients exhibited a loss of both alleles of BIM. See also Table S2.

References

    1. Adachi M, Suematsu S, Kondo T. Targeted mutation in the Fas gene causes hyperplasia in peripheral lymphoid organs and liver. Nature Genetics. 1995 - PubMed
    1. Baldwin EL, Osheroff N. Etoposide, Topoisomerase II and Cancer. Current Medicinal Chemistry - Anti-Cancer Agents. 2005;5:10. - PubMed
    1. Biswas SC, Greene LA. Nerve growth factor (NGF) down-regulates the Bcl-2 homology 3 (BH3) domain-only protein Bim and suppresses its proapoptotic activity by phosphorylation. The Journal of Biological Chemistry. 2002;277:49511–49516. - PubMed
    1. Bossy-Wetzel E, Newmeyer DD, Green DR. Mitochondrial cytochrome c release in apoptosis occurs upstream of DEVD-specific caspase activation and independently of mitochondrial transmembrane depolarization. The EMBO Journal. 1998;17:37–49. - PMC - PubMed
    1. Bouillet P, Metcalf D, Huang DC, Tarlinton DM, Kay TW, Köntgen F, Adams JM, Strasser A. Proapoptotic Bcl-2 relative Bim required for certain apoptotic responses, leukocyte homeostasis, and to preclude autoimmunity. Science (New York, N.Y.) 1999;286:1735–1738. - PubMed

Publication types

MeSH terms

Substances