. 2013 Sep 26;51(6):766-79.
doi: 10.1016/j.molcel.2013.08.032.

Structural architecture of the CARMA1/Bcl10/MALT1 signalosome: nucleation-induced filamentous assembly

Affiliations

Structural architecture of the CARMA1/Bcl10/MALT1 signalosome: nucleation-induced filamentous assembly

Qi Qiao et al. Mol Cell. .

Abstract

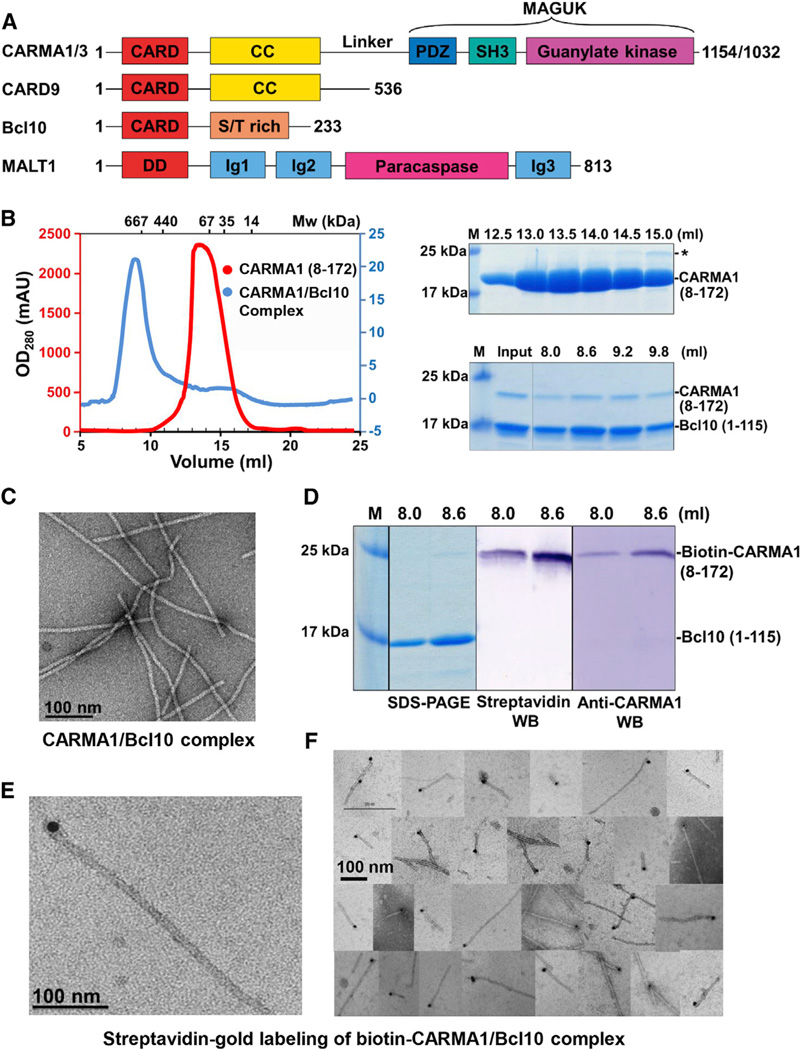
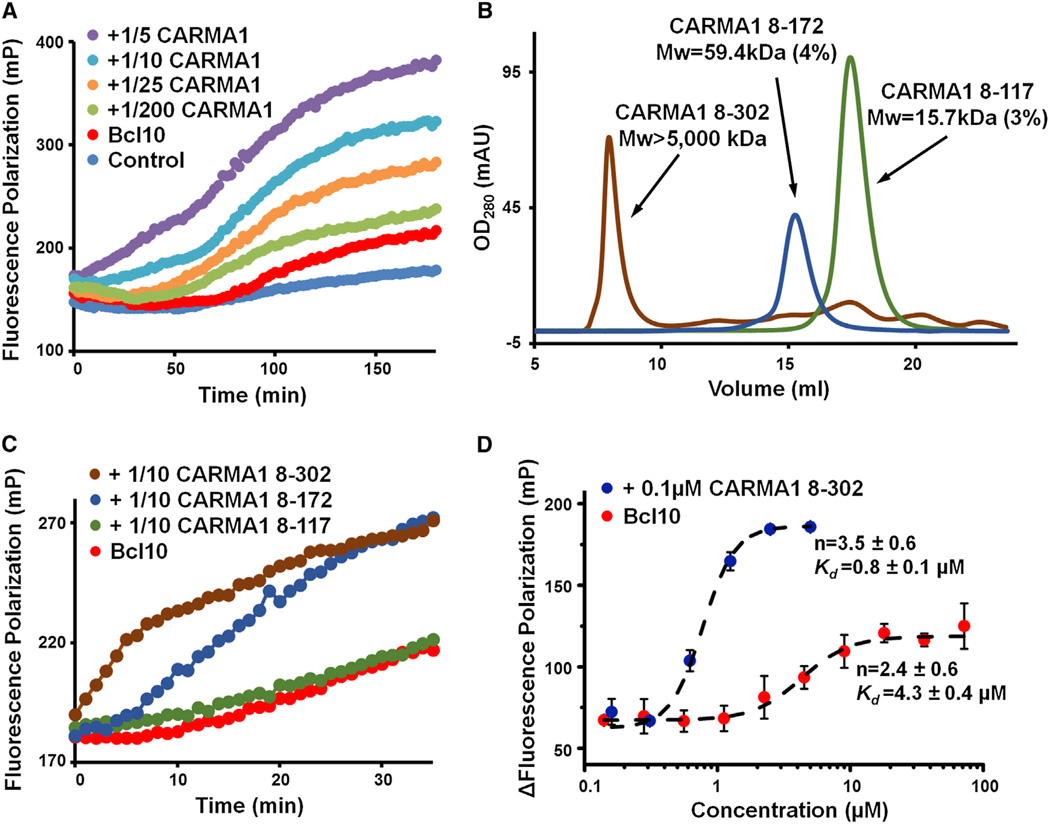
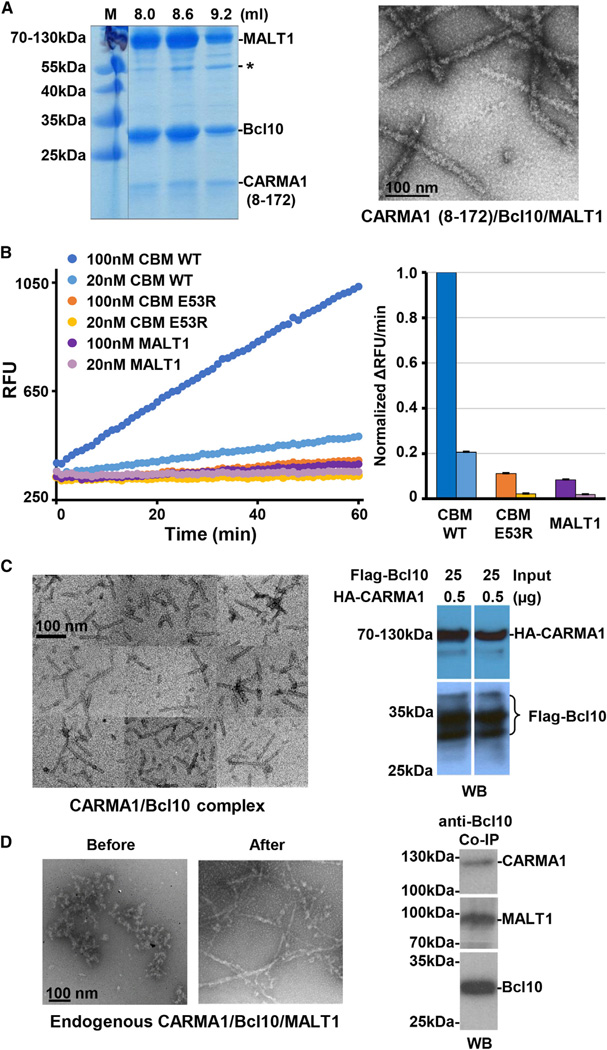
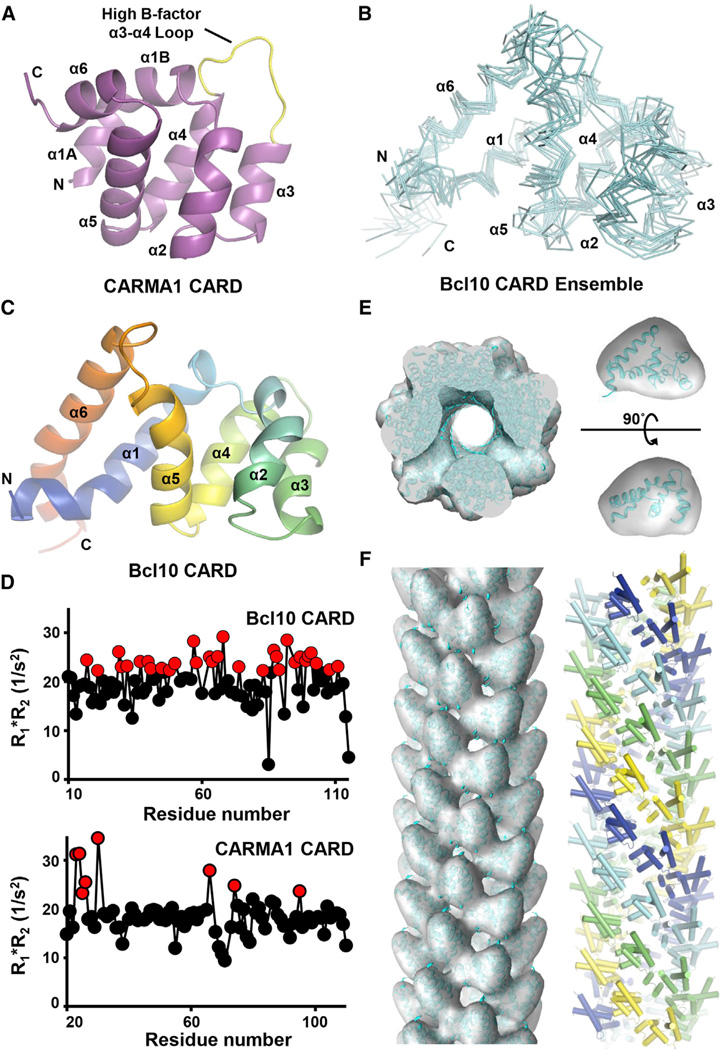
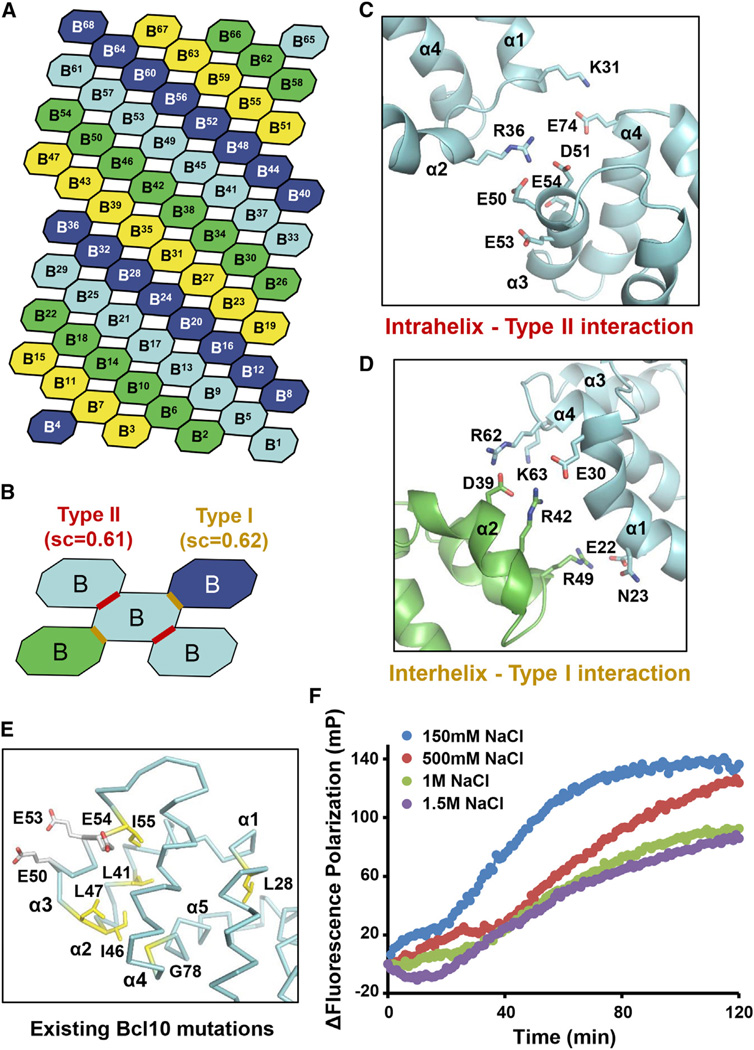
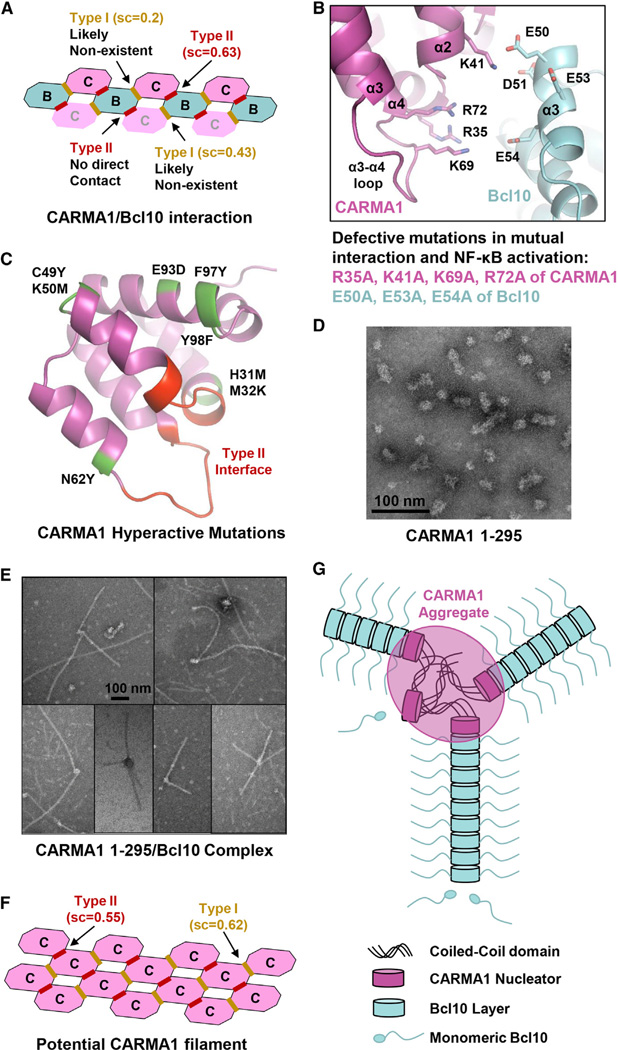
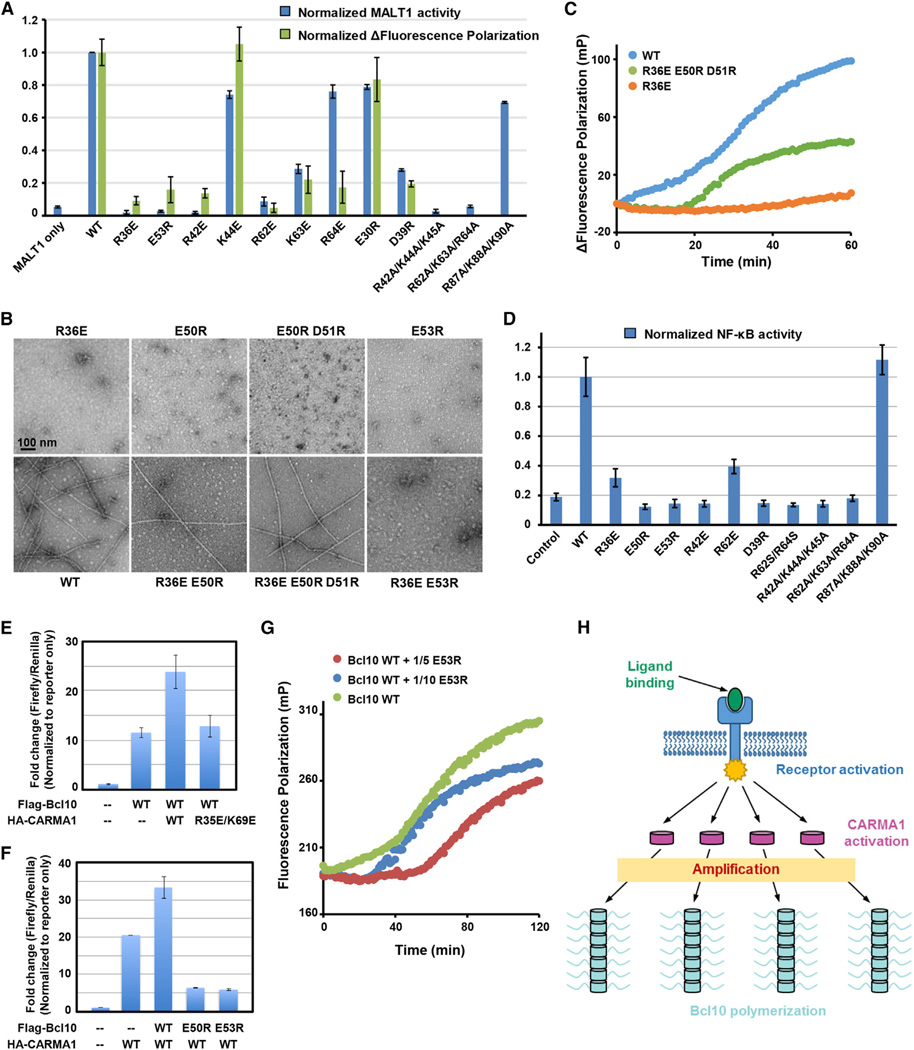
The CARMA1/Bcl10/MALT1 (CBM) signalosome mediates antigen receptor-induced NF-κB signaling to regulate multiple lymphocyte functions. While CARMA1 and Bcl10 contain caspase recruitment domains (CARDs), MALT1 is a paracaspase with structural similarity to caspases. Here we show that the reconstituted CBM signalosome is a helical filamentous assembly in which substoichiometric CARMA1 nucleates Bcl10 filaments. Bcl10 filament formation is a highly cooperative process whose threshold is sensitized by oligomerized CARMA1 upon receptor activation. In cells, both cotransfected CARMA1/Bcl10 complex and the endogenous CBM signalosome are filamentous morphologically. Combining crystallography, nuclear magnetic resonance, and electron microscopy, we reveal the structure of the Bcl10 CARD filament and the mode of interaction between CARMA1 and Bcl10. Structure-guided mutagenesis confirmed the observed interfaces in Bcl10 filament assembly and MALT1 activation in vitro and NF-κB activation in cells. These data support a paradigm of nucleation-induced signal transduction with threshold response due to cooperativity and signal amplification by polymerization.


Figures

Figure 1
Figure 1. The CARMA1/Bcl10 Complex Is Filamentous with End Localization of CARMA1
(A) Domain organizations. Abbreviations are as follows: CARD, caspase recruitment domain; CC, coiled-coil domain; PDZ, PSD95, DLG, and ZO1 homology domain; SH3, Src homology 3 domain; MAGUK, membrane-associated guanylate kinase domain; S/T rich, Ser/Thr rich; DD, death domain; and Ig, immunoglobulin-like domain. The number of residues in each protein is labeled. (B) Gel filtration profiles of CARMA1 and the CARMA1/Bcl10 complex (left) and SDS-PAGE gels of peak fractions (right). Because Bcl10 CARD does not contain Trp residues, the OD280 reading of the complex peak is low (blue, right of the graph). (C) An EM image of the CARMA1 (8–172)/Bcl10 complex. (D) SDS-PAGE and western blots (WB) of biotinylated CARMA1/Bcl10 complex. (E) One EM image of streptavidin gold-labeled biotinylated CARMA1/Bcl10 complex. (F) A collage of EM images of streptavidin gold-labeled biotinylated CARMA1/Bcl10 complex. See also Figure S1.
Figure 2
Figure 2. CARMA1 Nucleates Bcl10 Filaments Cooperatively
(A) Fluorescence polarization assay of Alexa 488-labeled MBP-Bcl10 (C29A/C57A double mutant) in the presence and absence of substoichiometric amounts of CARMA1 (8–172) upon MBP removal by the TEV protease. (B) Elution profiles of three CARMA1 constructs from a Superdex 200 10/300GLgelfiltration column. Multiangle light scattering (MALS) measurements are shown for two of the constructs, with numbers in parentheses representing fitting errors. The molecular mass of CARMA1 (8–302) is estimated from the fractionation limit of Superose 6 (Figure S2B). (C) Same as (A), but with three different CARMA1 constructs. (D) Concentration dependence of Bcl10 polymerization in the presence and absence of CARMA1. N, Hill coefficient. Kd, microscopic dissociation constant. Data are represented as mean ± SD from three independent measurements. See also Figure S2.
Figure 3
Figure 3. CBM Complexes In Vitro and in Cells
(A) SDS-PAGE gel of reconstituted CARMA1/Bcl10/MALT1 complex fractions from gel filtration chromatography (left) and an EM image of the complex (right). Asterisk indicates a contaminant. (B) Paracaspase activities of full-length MALT1, the WT CBM complex, and the CARMA1/E53R Bcl10/MALT1 complex (CBM E53R) using Ac-LRSR-AMC as the substrate. RFU, relative fluorescence unit. Data are represented as mean ± SD from three independent measurements. (C) An EM image of the immunoprecipitated coexpressed HA-CARMA1 and Flag-Bcl10 complex in 293T cells (left) and western blots of anti-Flag immunoprecipitation of coexpressed HA-CARMA1 and Flag-Bcl10 (right). (D) EM images of the immunoprecipitated endogenous CBM complex before and after limited proteolysis (left) and western blots of immunoprecipitation using biotinylated anti-Bcl10 antibody, showing the pull-down of CARMA1 and MALT1 from HBL-1 cell lysates. See also Figure S3.
Figure 4
Figure 4. EM Structure of the Bcl10 Filament
(A) Ribbon diagram of the crystal structure of CARMA1 CARD. Secondary structures and the α3-α4 loop are labeled. (B) Superimposed Cα traces of minimized Bcl10 CARD NMR structures. (C) Ribbon diagram of one Bcl10 CARD NMR model, showing the long α1 and α6 helices and the resulting pear shape of the molecule. The color mode is rainbow. (D) R1*R2 relaxation analysis of Bcl10 and CARMA1 CARDs by NMR. Elevated values indicate the presence of ms-µs chemical exchange. A cutoff value of 21, which is 10% above the maximum calculated R1*R2 product at 600 MHz, is applied. (E) Fitting of Bcl10 CARD structure (cyan) into the segmented EM density (gray, pear shaped in one orientation) and the entire 3D volume of the Bcl10 filament. (F) 3D volume of the Bcl10 filament fitted with Bcl10 CARD structure viewed along the helical axis (left) and the structural model of the Bcl10 filament in which the prominent left-handed four-start helical strands are shown in cyan, blue, yellow, and green, respectively (right). See also Figure S4, Table S1, and Table S2.
Figure 5
Figure 5. Detailed Interactions in the Bcl10 Filament
(A) A schematic model showing the helical symmetry in the Bcl10 filament. Bcl10 subunits are shown by octagons and sequentially labeled from B1 to B68 according to the single-start helical symmetry of 3.6 subunit per turn. The four colors represent the prominent connected left handed four-start helices. (B) Interactions around a Bcl10 subunit (cyan), showing the intrahelix type II and the interhelix type I interactions (marked with red and yellow lines, respectively) and their shape complementarity scores (sc). (C) Detailed intrahelix type II interactions between two subunits in cyan that are shown in (B). (D) Detailed interhelix type I interactions between a cyan subunit and a green subunit that are shown in (B). (E) Mapping of existing mutation sites that compromise Bcl10 function (Li et al., 2012; Yan et al., 1999) onto the structure. Yellow, buried residues; white, surface residues involved in the intrahelix interaction. (F) Bcl10 polymerization under different NaCl concentrations using fluorescence polarization. See also Figure S5.
Figure 6
Figure 6. Detailed Interactions between CARMA1 and Bcl10
(A) Potential types of interactions if CARMA1 continues the helical symmetry in either direction of the Bcl10 filament. Shape complementarity (sc) scores are shown for each of the interfaces. The most probable interface is boxed in red. (B) The modeled type II interactions between CARMA1 and Bcl10, which precisely match previous mutagenesis data (Li et al., 2012). (C) Mapping of existing CARMA1 hyperactive mutation sites that do not disrupt CARMA1 filament formation or Bcl10 interaction (Chan et al., 2013) onto the structure (green). The sites of type II interaction with Bcl10 are shown in red. (D) An EM image of CARMA1 (8–302), showing the heterogeneous clusters of 20–40 nm in size. (E) EM images of CARMA1 (8–302)/Bcl10 filaments showing both single- and multiarmed filaments. (F) Potential CARMA1 filament built based on the Bcl10 filament with reasonable sc scores. (G) A schematic diagram of short CARMA1 filament-mediated Bcl10 polymerization. See also Figure S6.
Figure 7
Figure 7. Structure-Based Bcl10 Mutagenesis In Vitro and in Cells
(A) Summary of effects of Bcl10 mutants in polymerization (green bars) and in MALT1 activation (blue bars) normalized to the WT Bcl10. (B) EM images of defective Bcl10 mutants, and combined Bcl10 mutants that rescued filament formation. (C) FP assays showing recovery of Bcl10 polymerization through mutation complementation. (D) Effects of the similar set of Bcl10 mutants in (A) in induction of NF-κB activity upon expression in 293T cells normalized to the WT Bcl10. (E) NF-κB activity upon expression of Flag-Bcl10 alone and coexpression with WT and mutant HA-CARMA1. (F) NF-κB activity upon expression of HA-CARMA1 alone and coexpression with WT and mutant Flag-Bcl10. (G) Dominant-negative inhibition of WT Bcl10 polymerization by substoichiometric amounts of the E53R mutant of Bcl10. (H) A schematic diagram of nucleation-induced signal amplification as a paradigm in signal transduction. Data in (A), (D), (E), and (F) are represented as mean ± SD from three independent measurements. See also Figure S7.

References

    1. Bentele M, Lavrik I, Ulrich M, Stösser S, Heermann DW, Kalthoff H, Krammer PH, Eils R. Mathematical modeling reveals threshold mechanism in CD95-induced apoptosis. J. Cell Biol. 2004;166:839–851. - PMC - PubMed
    1. Bertin J, Guo Y, Wang L, Srinivasula SM, Jacobson MD, Poyet JL, Merriam S, Du MQ, Dyer MJ, Robison KE, et al. CARD9 is a novel caspase recruitment domain-containing protein that interacts with BCL10/CLAP and activates NF-kappa B. J. Biol. Chem. 2000;275:41082–41086. - PubMed
    1. Chan W, Schaffer TB, Pomerantz JL. A quantitative signaling screen identifies CARD11 mutations in the CARD and LATCH domains that induce Bcl10 ubiquitination and human lymphoma cell survival. Mol. Cell. Biol. 2013;33:429–443. - PMC - PubMed
    1. Coornaert B, Baens M, Heyninck K, Bekaert T, Haegman M, Staal J, Sun L, Chen ZJ, Marynen P, Beyaert R. T cell antigen receptor stimulation induces MALT1 paracaspase-mediated cleavage of the NF-kappaB inhibitor A20. Nat. Immunol. 2008;9:263–271. - PubMed
    1. Dickens LS, Boyd RS, Jukes-Jones R, Hughes MA, Robinson GL, Fairall L, Schwabe JW, Cain K, Macfarlane M. A death effector domain chain DISC model reveals a crucial role for caspase-8 chain assembly in mediating apoptotic cell death. Mol. Cell. 2012;47:291–305. - PMC - PubMed

Publication types

MeSH terms