. 2013 Oct 10;155(2):369-83.
doi: 10.1016/j.cell.2013.08.062. Epub 2013 Sep 26.

The proliferation-quiescence decision is controlled by a bifurcation in CDK2 activity at mitotic exit

Affiliations

The proliferation-quiescence decision is controlled by a bifurcation in CDK2 activity at mitotic exit

Sabrina L Spencer et al. Cell. .

Abstract

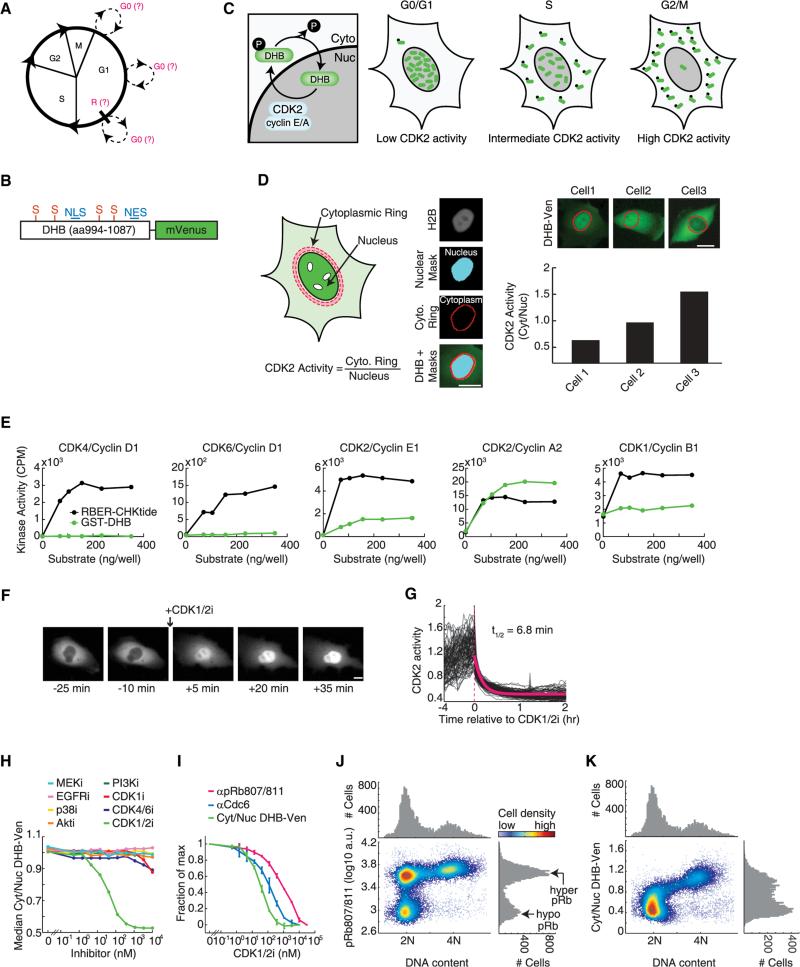
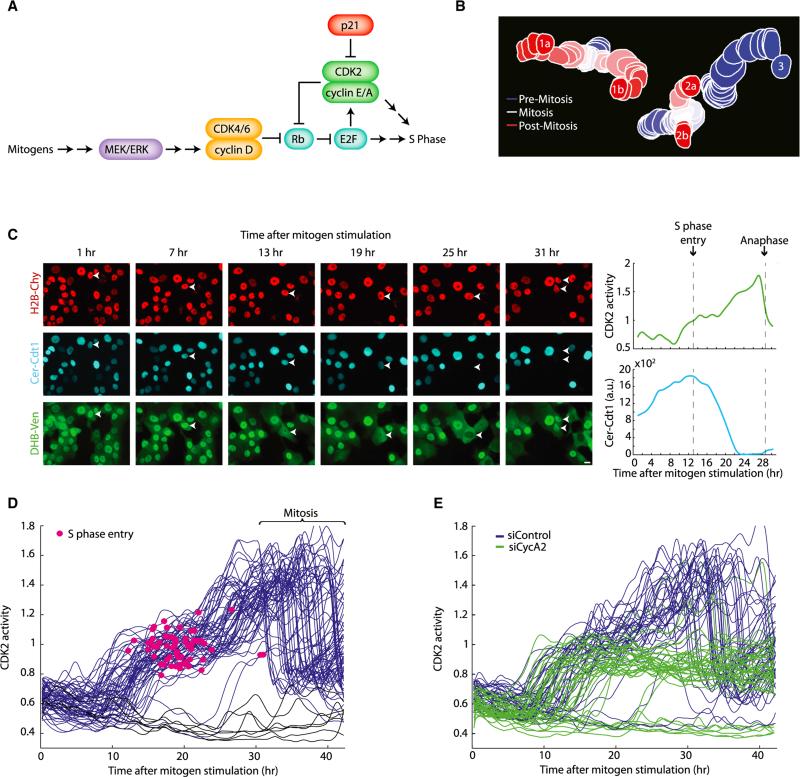
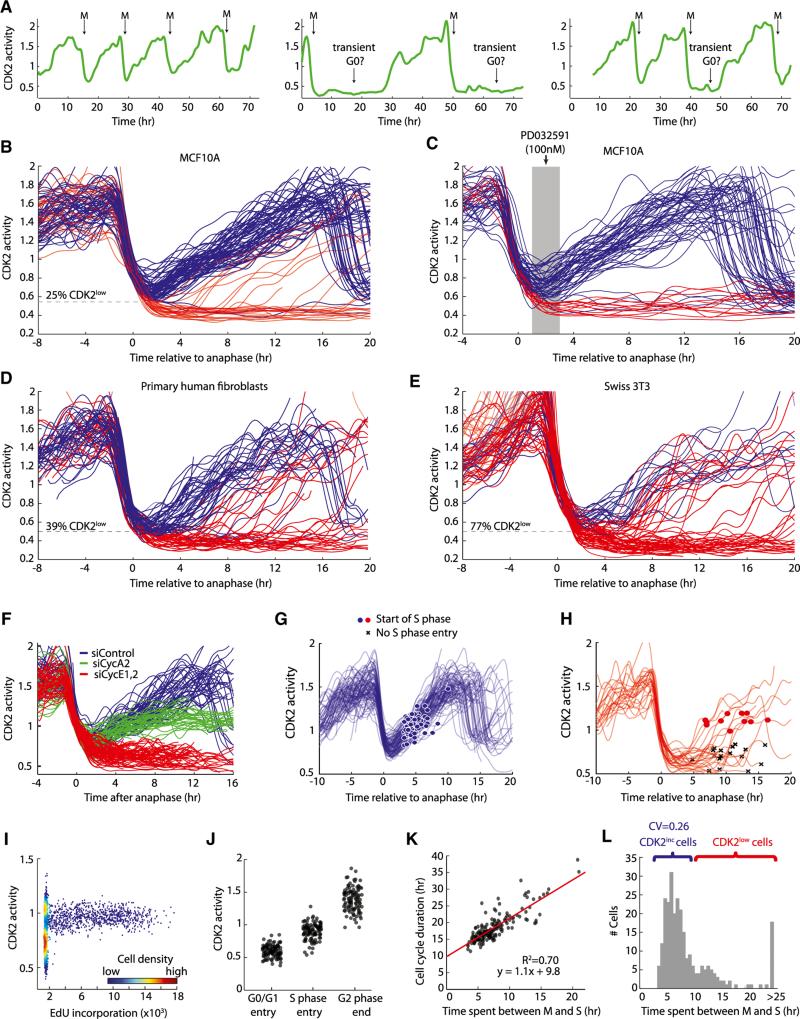
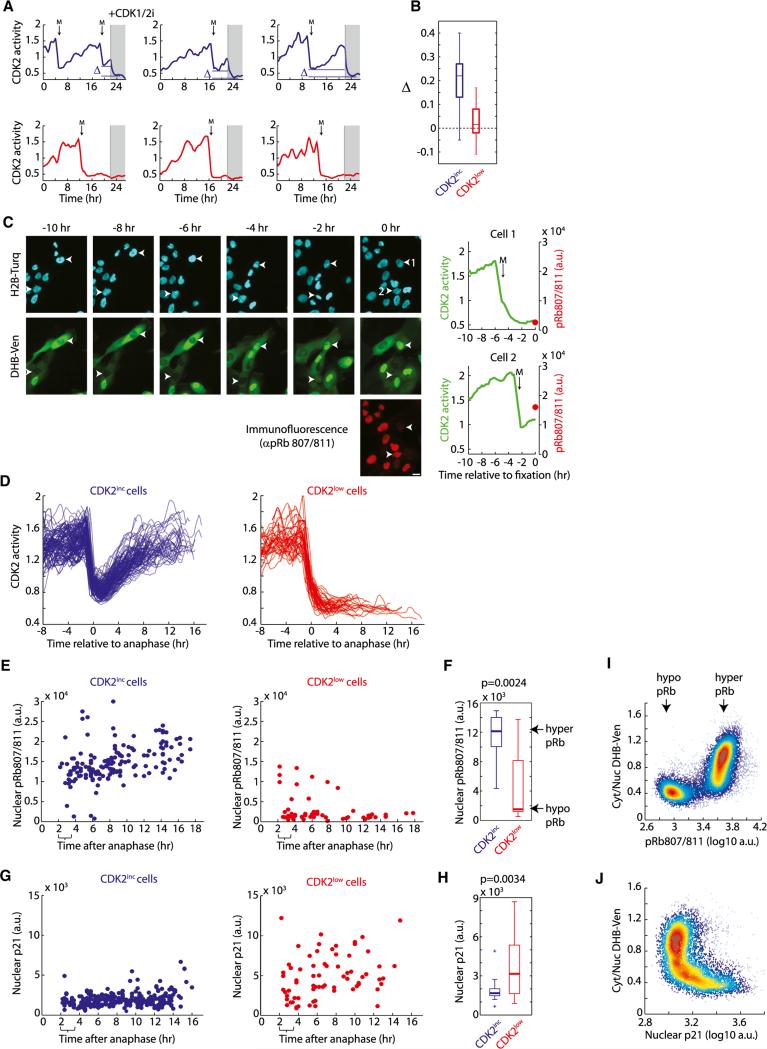
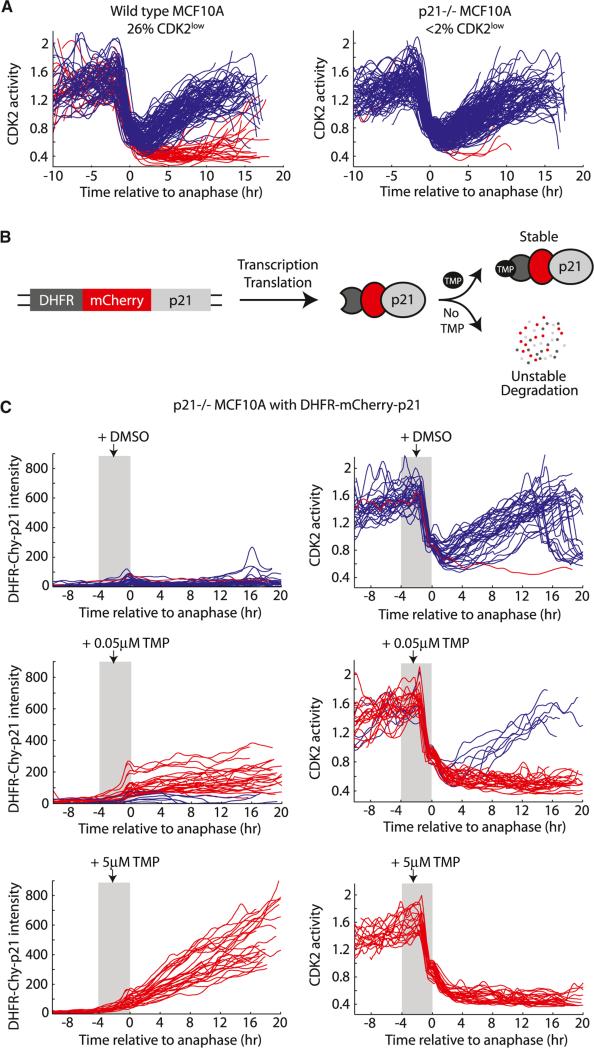
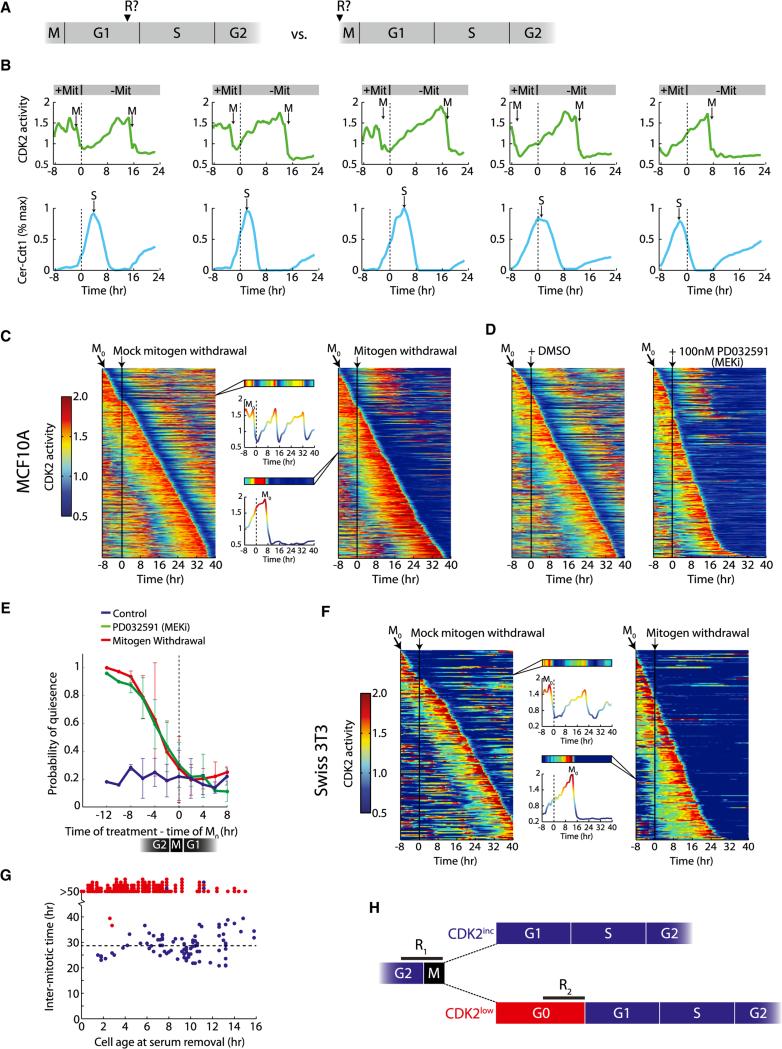
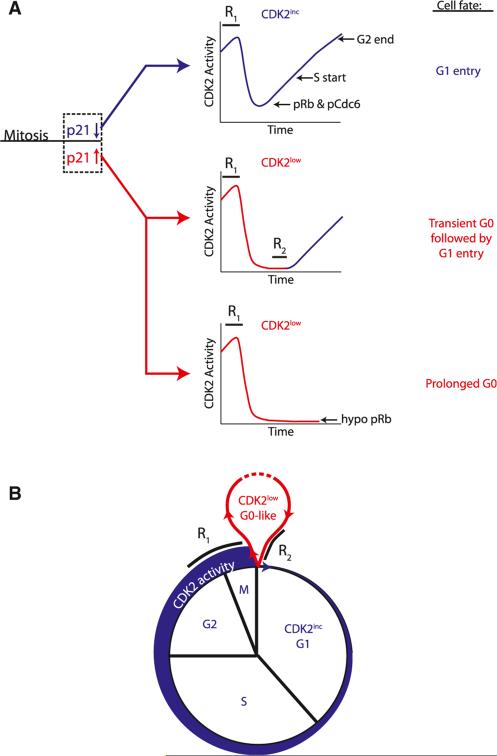
Tissue homeostasis in metazoans is regulated by transitions of cells between quiescence and proliferation. The hallmark of proliferating populations is progression through the cell cycle, which is driven by cyclin-dependent kinase (CDK) activity. Here, we introduce a live-cell sensor for CDK2 activity and unexpectedly found that proliferating cells bifurcate into two populations as they exit mitosis. Many cells immediately commit to the next cell cycle by building up CDK2 activity from an intermediate level, while other cells lack CDK2 activity and enter a transient state of quiescence. This bifurcation is directly controlled by the CDK inhibitor p21 and is regulated by mitogens during a restriction window at the end of the previous cell cycle. Thus, cells decide at the end of mitosis to either start the next cell cycle by immediately building up CDK2 activity or to enter a transient G0-like state by suppressing CDK2 activity.


Figures

Figure 1
Figure 1. Characterization of a Live-Cell Sensor for CDK2 Activity
(A) Cell-cycle diagram showing uncertainty about when entry into G0 occurs and where the restriction point (R) is positioned. (B) Schematic of sensor. NLS, nuclear localization signal; NES, nuclear export signal; S, CDK consensus phosphorylation site on serine. (C) Schematic of CDK2 phosphorylation-mediated translocation of DHB-Ven. (D) Method used to obtain the cytoplasmic to nuclear ratio of DHB-Ven. Cell nuclei were identified using fluorescent H2B images to obtain a mask. The nuclear component of DHB-Ven was determined using this mask, whereas the cytoplasmic component of DHB-Ven consisted of a ring around the nuclear mask. See Extended Experimental Procedures. (E) Purified GST-DHB (aa994–1087) at six different concentrations was used in an in vitro kinase activity assay as a substrate for five different cyclin-CDK complexes. Conditions were selected to be in a range known to work with the established artificial positive control, RBER-CHKtide. Note that CDK1/cyclin B has a high level of basal autophosphorylation. See Extended Experimental Procedures. (F) Images of DHB-Ven in a single cell before and after treatment with 10 μM CDK1/2 inhibitor. (G) DHB-Ven traces in individual MCF10A cells before (imaged every 12 min) and after (imaged every 2 min) treatment with 10 μM CDK1/2 inhibitor (red dashed line). The half-life was derived from an exponential fit to the average of individual traces (red curve). (H) In vivo response of DHB-Ven to titration of eight different kinase inhibitors. Cells were treated with the inhibitors for 30 min in 96-well plate format, fixed, and imaged to obtain the median of single-cell Cyt/Nuc DHB-Ven signals in each well. (I) Comparison of DHB-Ven and two other CDK2 substrates, Cdc6 and Rb, to a titration of CDK1/2 inhibitor. Cells were treated with the inhibitor for 30 min in 96-well plate format, fixed, stained with antibodies (anti-phosphorylated Rb at serine 807/811 [pRb807/811] or anti-Cdc6; Cdc6 translocates from the nucleus to the cytoplasm in response to CDK2 phosphorylation) and imaged to obtain the median of single-cell Cyt/Nuc DHB-Ven signals, median of single-cell Cyt/Nuc Cdc6 signals or median of single-cell pRb signals in each well. Error bars represent the standard deviation of duplicate wells. (J and K) Density scatter plot of pRb807/811 versus DNA content (J) or Cyt/Nuc DHB-Ven versus DNA content (K) in single cells obtained by fixed-cell imaging. Single-parameter histograms are shown above and to the right. Scale bars throughout this manuscript are 10 μm. All data are from MCF10A cells. See also Figure S1.
Figure 2
Figure 2. A Variable Delay in CDK2 Activation in Cells Emerging from Mitogen Starvation
(A) Literature-based schematic of the signaling pathway involved in emergence from mitogen starvation. Mitogens promote upregulation of cyclin D, which binds to CDK4/6 to initiate phosphorylation of Rb. This initiates the release of E2F from its Rb-bound state, freeing it to upregulate cyclin E, cyclin A, CDK2, and other genes needed for S phase. p21 inhibits CDK2. (B) Tracking of three cells, two of which divide, over 25 frames (5 hr). (C) Left: images of MCF10A cells emerging from mitogen starvation. An arrow marks the cell tracked in the plot on the right. Top: H2B-Cherry; middle, Cerulean-Cdt1; bottom, DHB-Venus. Right, traces of the cell marked with the arrow in the images. Cer-Cdt1 is degraded at the start of S phase (vertical dashed line) (Sakaue-Sawano et al., 2008); at this time, the Cyt/Nuc ratio of DHB-Ven is about one. (D) Traces of CDK2 activity in individual cells emerging from 45 hr of mitogen starvation that do (blue) or do not (black) enter S phase during the imaging period. Because there were always a few cells that were not properly starved, only cells with DHB-Ven Cyt/Nuc < 0.8 at t = 0 are included in the plot. A red dot marks the start of S phase (induction of Cer-Cdt1 degradation) for each cell. (E) Traces of CDK2 activity in individual cells emerging from mitogen starvation. Cells were treated for 6 hr with a nontargeting siRNA (blue) or with a pool of four siRNAs against cyclin A2 (green). Cells were then starved for 45 hr then restimulated with full growth media and subjected to time-lapse imaging. Only cells with DHB-Ven Cyt/Nuc < 0.8 at t = 0 are included in the plot. All data are from MCF10A cells. See also Figure S2 and Movie S1.
Figure 3
Figure 3. Bifurcation in CDK2 Activity upon Exit from Mitosis
(A) Single-cell traces of CDK2 activity in proliferating cells. CDK2 activity drops rapidly at mitosis (M) and either immediately builds up again or remains low for a variable amount of time, reminiscent of a G0-like state. (B–E) Single-cell traces of CDK2 activity aligned computationally to the time of anaphase for MCF10A (B and C), Hs68 primary human fibroblasts (D), or murine Swiss 3T3 fibroblasts (E). Traces were colored red if, 2 hr after anaphase the Cyt/Nuc ratio of DHB-Ven fell below 0.55 (MCF10A) or 0.5 (Hs68); otherwise traces were colored blue. The dashed line marks the cutoff used for the red/blue color scheme. Due to higher noise in Swiss 3T3 traces, we used an expanded rule for these cells in which traces were colored red if the Cyt/Nuc ratio of DHB-Ven fell below 0.5 at 2 hr after anaphase or below 0.6 at 6 hr after anaphase; otherwise traces were colored blue. This red/blue color scheme is used in all subsequent figures. In (C), MCF10A cells were preimaged for 8 hr, and then treated with 100 nM MEKi (PD032591). Only cells that had completed anaphase 1–3 hr prior to addition of MEKi are plotted. MEKi remained in the media for the rest of the imaging period. (F) Single-cell traces of CDK2 activity aligned computationally to the time of anaphase for cells treated with nontargeting siRNA (blue), siRNAs targeting cyclin A2 (green) or cyclin E1 and E2 (red). Cells were incubated with siRNAs for 6 hr, washed, and immediately subjected to time-lapse imaging. (G and H) Traces of CDK2 activity aligned computationally to the time of anaphase. The start of S phase (induction of Cer-Cdt1 degradation) is marked with blue or red dots. Cells not yet in S phase at the end of the movie are marked with black Xs. (I) Density scatter plot of CDK2 activity versus EdU incorporation (a marker for DNA synthesis). (J) CDK2 activity in single cells at the start of G0/G1 (1 hr after nuclear envelope reformation), at the start of S phase (scored using Cer-Cdt1), or at the end of G2 phase (last frame before nuclear envelope breakdown). (K) Scatter plot showing the total duration of the cell cycle (intermitotic time) as a function of the M-to-S interval in individual cells (n = 176). The start of S phase was scored using Cer-Cdt1; mitosis was scored using H2B-Chy. Fit was obtained by linear regression; R represents the Pearson correlation coefficient. (L) Histogram of time spent between mitosis and the start of S phase for individual MCF10A cells (n = 250). Brackets mark CDK2inc cells (blue) or cells that pass through the CDK2low state (red). CV, coefficient of variation. All data are from MCF10A cells except (D) and (E). See also Figure S3 and Movie S2.
Figure 4
Figure 4. CDK2inc Cells Begin G1 with Residual CDK2 Activity, Hyperphosphorylated Rb, and Low p21
(A) CDK2 activity in cells treated with 10 μM CDK1/2 inhibitor after 22 hr of imaging. The difference between CDK2 activity at mitotic exit and after drug addition is marked as D. (B) Boxplot of Δ. Δ is close to zero for CDK2low cells indicating no residual CDK2 activity at mitotic exit. (C) Time-lapse imaging of CDK2 activity in asynchronous cells was followed by immunofluorescence staining for pRb807/811 (left). The immunofluorescence image was precisely aligned to the time-lapse imaging movie using a custom jitter correction algorithm. This enabled matching of the CDK2 activity trace of each cell to its phospho-Rb level at the end of the movie (right). (D) Example traces of CDK2 activity for CDK2inc and CDK2low cells used in (E)–(H). For clarity, cells were excluded if they emerged from the CDK2low state or had a second mitosis. (E and G) Time-lapse imaging of CDK2 activity in asynchronous cells was followed by fixation and immunofluorescence staining for pRb807/811 (E) or p21 (G) as described in (C). Phospho-Rb levels (E) or p21 levels (G) were then reconstructed as a function of time since anaphase for CDK2inc cells (blue dots) and CDK2low cells (red dots). Brackets mark the time window (2–3.5 hr after anaphase) used in the boxplots in (F) and (H). (F and H) Boxplots comparing phospho-Rb staining (F) or p21 staining (H) in CDK2inc and CDK2low cells selected to be within 2 to 3.5 hr after anaphase. A rank-sum test was used to obtain p values. (I and J) Density scatter plot of Cyt/Nuc DHB-Ven versus pRb807/811 (I) or versus p21 (J) obtained by fixed-cell imaging in asynchronously cycling cells. All data are from MCF10A cells. See also Figure S4 and Movie S3.
Figure 5
Figure 5. The Bifurcation in CDK2 Activity Is Controlled by p21
(A) Single-cell traces of CDK2 activity in parental MCF10A and p21–/– MCF10A aligned to the time of anaphase. (B) Design of the DHFR-mCherry-p21 construct. (C) p21–/– MCF10A cells expressing DHFR-mCherry-p21 were preimaged for 6 hr, and then treated with DMSO or with 0.05 μM or 5 μM TMP. Traces were aligned to the time of anaphase and only cells that were treated with TMP 0–4 hr prior to anaphase (gray shaded region) were selected for plotting. Left column, DHFR-mCherry-p21 intensity in single cells over time. Right column, consequent CDK2 activity in the same single cells over time. Traces were colored blue if a buildup of CDK2 activity occurred after mitosis, otherwise traces were colored red. See also Figure S5.
Figure 6
Figure 6. Mitogenic Stimuli during the Previous Cell Cycle Control CDK2 Activation and Commitment to the Next Cell Cycle
(A) The following experiments are aimed at determining whether cell-cycle commitment occurs in late G1 as posited by the restriction point model (left) or at the end of the previous cell cycle (right). (B) Cells were preimaged in full growth media, washed three times, and then transferred to media without mitogens after 8 hr (dashed line at t = 0). CDK2 activity builds up even when mitogens are removed as early as 25 min after anaphase (leftmost cell). Top, single-cell traces of CDK2 activity. Bottom, corresponding normalized traces of Cer-Cdt1 used to determine the start of S phase. Mit, mitogens. (C and F) Heatmap of CDK2 activity in MCF10A cells (C) or Swiss 3T3 cells (F) sorted computationally by the time of mitosis (M0). Each row in the heatmap represents the CDK2 activity trace of a single cell over time. After 8 hr of preimaging, cells were washed and put back in full growth media (mock, left, vertical black line) or washed and put in starvation media (right, vertical black line). (D) Same as (C), except instead of removing mitogens after 8 hr of preimaging, MCF10A cells were treated with DMSO (left, vertical black line), or treated with 100 nM MEKi (PD032591) in full growth media. (E) Probability of quiescence following M0, for the case of mitogen withdrawal (red), addition of 100 nM MEKi (green), or control (blue). A cell was considered quiescent if, 6 hr after M0, the DHB-Ven Cyt/Nuc ratio was less than one. Error bars are standard deviation from duplicate experiments. (G) For each Swiss 3T3 cell, the time between the last mitosis and the time serum was removed was recorded (cell age at serum removal), as well as the length of the subsequent cell cycle (intermitotic time). Points are red if CDK2 activity was not yet building up when mitogens were removed; points are blue if CDK2 activity was already building up when mitogens were removed. (H) Schematic of key decision points in cell-cycle commitment based on our data. Cells integrate mitogenic stimuli during a restriction window (R1) at the end of the previous cell cycle and choose between CDK2inc and CDK2low fates upon completion of mitosis. CDK2low cells face a second decision point (R2) in which they can re-enter the cell cycle by building up CDK2 activity. All data are from MCF10A cells except (F) and (G). See also Figure S6 and Movie S4.
Figure 7
Figure 7. Model for Cell-Cycle Commitment and Transitions between G0 and G1
(A) Cells choose between CDK2inc and CDK2low fates during a restriction window (R1) at the end of the previous cell cycle. Suppression of p21 protein during this period sends cells into the CDK2inc state upon completion of mitosis. These cells are born into G1, committed to the cell cycle, with low p21, residual CDK2 activity, hyperphosphorylated Rb, and enter S phase in 5–7 hr. Elevation of p21 protein at the end of the previous cycle sends cells into the CDK2low state upon completion of mitosis. These cells are born into a transient or prolonged G0-like state with high p21, no residual CDK2 activity, and hypophosphorylated Rb. These cells remain sensitive to mitogen withdrawal and are not committed to the cell cycle until they pass a second restriction window (R2) prior to the buildup of CDK2 activity. (B) Upon exit from mitosis, cells execute a quiescence-proliferation decision by choosing between a CDK2low, G0-like state (red), and a CDK2inc, G1 state (blue).

Comment in

  • Cell cycle: Making an early decision.
    Minton K. Minton K. Nat Rev Mol Cell Biol. 2013 Nov;14(11):691. doi: 10.1038/nrm3687. Epub 2013 Oct 16. Nat Rev Mol Cell Biol. 2013. PMID: 24129417 No abstract available.

References

    1. Abbas T, Dutta A. p21 in cancer: intricate networks and multiple activities. Nat. Rev. Cancer. 2009;9:400–414. - PMC - PubMed
    1. Bachman KE, Blair BG, Brenner K, Bardelli A, Arena S, Zhou S, Hicks J, De Marzo AM, Argani P, Park BH. p21(WAF1/CIP1) mediates the growth response to TGF-beta in human epithelial cells. Cancer Biol. Ther. 2004;3:221–225. - PubMed
    1. Buchkovich K, Duffy LA, Harlow E. The retinoblastoma protein is phosphorylated during specific phases of the cell cycle. Cell. 1989;58:1097–1105. - PubMed
    1. Chassot AA, Lossaint G, Turchi L, Meneguzzi G, Fisher D, Ponzio G, Dulic V. Confluence-induced cell cycle exit involves pre-mitotic CDK inhibition by p27(Kip1) and cyclin D1 downregulation. Cell Cycle. 2008;7:2038–2046. - PubMed
    1. Chen PL, Scully P, Shew JY, Wang JY, Lee WH. Phosphor-ylation of the retinoblastoma gene product is modulated during the cell cycle and cellular differentiation. Cell. 1989;58:1193–1198. - PubMed

Publication types

Substances