. 2013 Oct 17;5(1):99-113.
doi: 10.1016/j.celrep.2013.08.031. Epub 2013 Sep 26.

Circadian and circalunar clock interactions in a marine annelid

Affiliations

Circadian and circalunar clock interactions in a marine annelid

Juliane Zantke et al. Cell Rep. .

Abstract

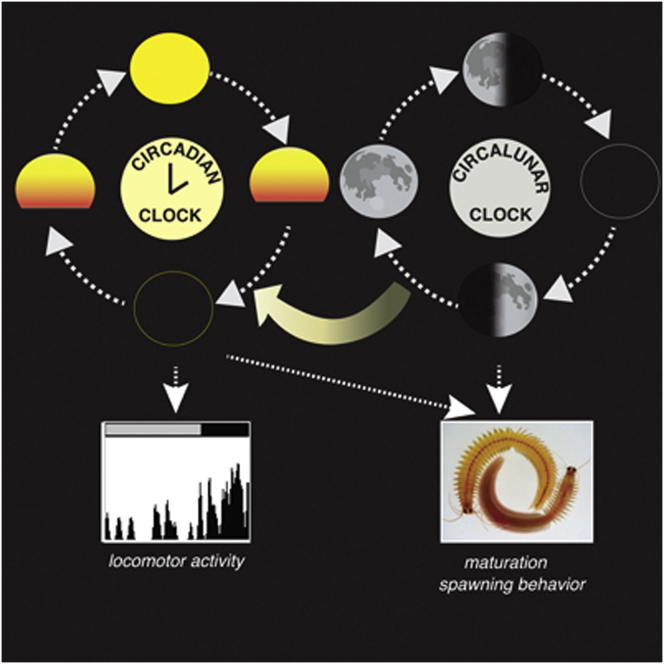
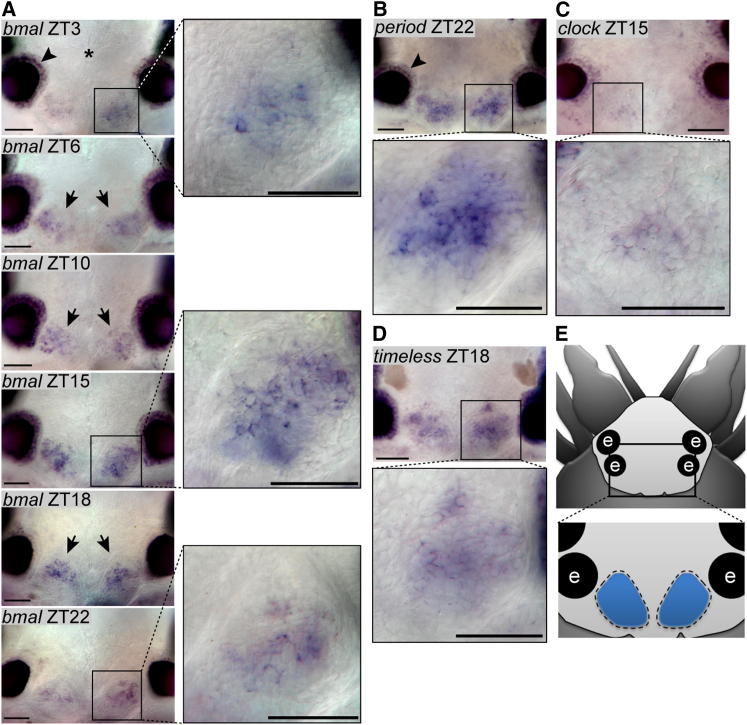
Life is controlled by multiple rhythms. Although the interaction of the daily (circadian) clock with environmental stimuli, such as light, is well documented, its relationship to endogenous clocks with other periods is little understood. We establish that the marine worm Platynereis dumerilii possesses endogenous circadian and circalunar (monthly) clocks and characterize their interactions. The RNAs of likely core circadian oscillator genes localize to a distinct nucleus of the worm's forebrain. The worm's forebrain also harbors a circalunar clock entrained by nocturnal light. This monthly clock regulates maturation and persists even when circadian clock oscillations are disrupted by the inhibition of casein kinase 1δ/ε. Both circadian and circalunar clocks converge on the regulation of transcript levels. Furthermore, the circalunar clock changes the period and power of circadian behavior, although the period length of the daily transcriptional oscillations remains unaltered. We conclude that a second endogenous noncircadian clock can influence circadian clock function.


Figures

None
Graphical abstract
Figure 1
Figure 1
Circalunar Reproductive Periodicity of Platynereis dumerilii Is Entrained by Light and Controlled by a Clock Mechanism (A) Premature adult (>2 months of age) as used in subsequent molecular and behavioral experiments is shown. (B) Mature male and female as counted for the quantification of mature worms during mating dance are shown. (C) Schematization of illumination conditions is shown. Daylight, yellow bars; nights without moon (new moon [NM]), black bars; nights with dim light simulating full moon (FM), light yellow bar. For “lunar” free-running experiments, the dim nocturnal light signal is omitted (FR-FM, free-running full moon; FR-NM, free running new moon). Illumination conditions used on x axis encode for 1; number of days, 2; day/night (in vertical direction). (D and E) Light-entrained lab cultures exhibit maturation peaks comparable to nature (Figure S1). Nocturnal illumination in phase (D) and out of phase (E) with the natural moon is shown. (F) Maturation synchronization continues for several months under circalunar free-running conditions after entrainment with dim nocturnal light (see C); dashed line indicates decreasing amplitude. (G) Fourier analysis of free-running full moon spawning data shown in (F) reveals a 30-day period length, corresponding to the length of one lunar month. (H) Worms grown under constant light (same light intensity during day/night) or without nocturnal illumination show no synchronization in maturation.
Figure 2
Figure 2
Platynereis Circadian Clock Gene Orthologs Show Circadian Oscillations on the RNA Level (A–J) Temporal profiles of clock gene RNA expression in Platynereis heads sampled under NM (A–E) circadian light regimen and constant darkness (F–J) are shown. Values are means ± SEM, n = 5–16 (A–E), n = 6 (F–J); four to five heads/n. The p value was determined by one-way ANOVA. See Figures S2B–S2G for additional circadian clock genes. (K) Platynereis L-cry transcript levels fluctuate, but do not show regular cycling patterns over 4 days (n = 2). (L) Light decreases Pdu-L-Cry, but not Pdu-tr-Cry, levels in S2 cells. Dp-Cry1 and Dp-Cry2 serve as positive and negative controls, respectively. V5 epitope-tagged Pdu-L-Cry, Pdu-tr-Cry, Dp-Cry1, Dp-Cry2 was coexpressed with GFP. After a 6 hr light pulse (gray bars) or constant darkness (black bars), cell extracts were collected, western blotted, and probed with anti-V5 and anti-GFP (see Figure S2H). CRY levels were quantified by densitometry of antibody staining after normalization with GFP. The dark value for each CRY was plotted as 100%. Data are means ± SEM; n = 3 independent transfections. Significant differences were assessed by Student’s t test (∗∗p < 0.01; ∗∗∗∗p < 0.0001). (M) Platynereis tr-Cry, but not the closely related Pdu-L-Cry or Pdu-6-4-photolyase, strongly inhibit Pdu-CLK:Pdu-BMAL-mediated transcription in a luciferase reporter gene assays. The monarch butterfly per E-box-containing enhancer (DpPer4Ep-Luc) was used in the absence (control) or presence of Pdu-clock/Pdu-bmal plasmids (350 ng each). Dp-cry1 and Dp-cry2 serve as positive and negative controls, respectively. Data are means ± SEM; n = 4–8 independent transfections. Significant differences were determined by Student’s t test (∗∗∗∗p < 0.0001).
Figure 3
Figure 3
Platynereis Circadian Clock Gene Orthologs Are Confined to a Specific Brain Nucleus (A–D) Whole-mount in situ hybridization of circadian clock genes on premature adult Platynereis heads is shown. Arrows point at the morphologically visible border of the medial brain nuclei expressing the genes. See also magnified view as indicated by the box; dorsal view, anterior to the top. For additional circadian clock genes, sense controls and expression of nonclock genes, see Figures S3A–S3F. Arrowheads indicate expression in eyes. Scale bar represents 50 μm, and asterisk indicates the position of major brain neuropil. (E) Scheme of worm head indicating area is shown. Circadian clock gene expressing brain nuclei are indicated as blue ovals. e, adult eyes.
Figure 4
Figure 4
The Circalunar Clock Affects Circadian-Clock-Controlled Activity Rhythms (A) Mean locomotor activity (hourly average ± SEM) shows higher nocturnal activity in Platynereis in NM under 16:8LD circadian illumination over the course of 3 days (N = 12 rhythmic animals). Active behaviors were counted as 1, inactive as 0. See Figures S4A–S4C for details on active versus inactive behaviors and recoding setup. (B) Quantification of average locomotor activity per hour of day hours (yellow bar) versus night hours (black bar) of 3 consecutive days is shown. Error bars represent ±SEM. Significant differences were determined by Student’s t test (∗∗∗∗p < 0.0001). (C) Percentage of present period length of individual worms under NM/LD conditions is shown. See individual periodograms in Figure S4J. (D) Average periodogram (N = 12) for NM/LD conditions shows a dominant period of 24 hr and an additional 12 hr peak. The red line indicates the significant p level = 0.05. (E) Actograms and their corresponding periodogram of 3 individual worms recorded under NM/LD conditions are shown. (F) Platynereis locomotor activity cycles continue in NM under complete darkness (DD) over at least 3 consecutive days (N = 10 rhythmic animals) showing a higher nocturnal activity. NM/DD: worms were entrained normally with circadian and circalunar illumination conditions. Recordings were performed during NM in complete darkness. See (A) for scoring details and Figure S4E for activity cycles including arrhythmic animals and Figures S4H and S4K for periodogram analysis. (G) Mean locomotor activity cycles continue in FR-FM under normal light/dark (LD) conditions showing an increase in daily locomotor activity (N = 18 rhythmic animals). See (A) for scoring details and Figure 1C for details on illumination. See Figures S4F and S4L for activity cycles including arrhythmic animals and periodogram analysis, respectively. (H) Platynereis daily locomotor activity in FR-FM under complete darkness (DD) is flattened and displays a shorter period of about 18 hr (N = 15 rhythmic animals). See Figures S4G and S4M for activity cycles including arrhythmic animals and periodogram analysis, respectively. (I) Quantification of average locomotor activity per hour of day hours (yellow bar) versus night hours (black bar) comparing NM/LD versus FR-FM/LD versus FR-FM/DD is shown. Worms under FR-FM/LD are nocturnal, but exhibit higher daily locomotor activity than during NM/LD. Worms in FR-FM under complete darkness (DD) show no nocturnal activity anymore, but an increase in daily activity. Error bars represent ±SEM. Significant differences were determined by Student’s t test (∗∗∗p < 0.001; ∗∗∗∗p < 0.0001). (J) Summary of Lomb-Scargle periodogram analyses of time series of locomotor activity observed under different circadian and circalunar conditions over the course of 3 days (see Figure 1C) is shown. Period and Power were calculated for all rhythmic worms. N, number of worms analyzed; R, rhythmic; WR, weakly rhythmic; AR, arrhythmic; see Experimental Procedures for classification. Data from three independent NM, DD, FR-FM experiments and from two independent FR-FM/DD were pooled, respectively. (K) Worms in NM versus FR-FM show significant differences in circadian activity period length. Error bars represent ±SEM. Significant differences were determined by Student’s t test (p < 0.05; ∗∗p < 0.01; ∗∗∗p < 0.001). (L–N) Percentage of present period lengths of individual worms is shown. (L) Under the NM/DD condition, the circadian period is reduced to 40%. Worms show additional longer and shorter periods. (M) Under the FR-FM/LD condition, worms display additional periods of about 9 hr and 18 hr, which are not present in NM under LD or DD (compare C and L). (N) In the FR-FM under DD condition, worms show an increase in period lengths of about 18 hr and 9 hr, decreasing the percentage of other periods (compare C, L, and M).
Figure 5
Figure 5
The Circalunar Clock Influences Circadian Clock Gene Expression (A–D) Temporal profiles of clock gene RNA expression in Platynereis heads sampled during NM (blue) and FR-FM (pink) at the indicated Zeitgeber time point (ZT) are shown. See Figure 1C for detailed information on the circalunar-light regimen. Values are means ± SEM, NM n = 5–16, FR-FM n = 3–10; four to five heads per n. The p value was determined by one-way ANOVA. (A′–D′) Overall daily transcript levels calculated as area under the curve (AUC) based on 24 hr expression data shown in (A)–(D) are shown. Values are means ± SEM; NM n = 6–16, FR-FM n = 3–10. The p value was determined by one-way ANOVA. Significant differences were determined by Wilcoxon signed rank test (p < 0.05; ∗∗∗p < 0.001); four to five heads per n. (E) Whole mount in situ hybridization shows an increase of pdp1, clock, and period levels at FR-FM versus NM in the oval shaped circadian clock gene expressing forebrain domain (compare Figures 3A–3E). See Figure S5 for analyses of additional circadian clock genes.
Figure 6
Figure 6
The Circalunar Clock Is Independent of Circadian Clock Oscillations (A) A dual oscillator model could explain circalunar clock function. A circadian (24 hr, length of the solar day) and circalunidian (24.8 hr, length of a lunar day) oscillator function together to generate monthly (29.5 days) periods. (B and C) Circadian clock gene transcriptional oscillations are severely affected under PF-670462 treatment compared to nontreated controls (dashed line). Values are means ± SEM; n = 3; four to five heads per n. See Figure S6 for additional circadian clock genes. (D) Behavioral analyses (one behavioral score per minute of a 10 min interval per hour) as described in Figures S4A and S4B from one representative example of untreated controls (active behavior, indicated by arrows, mainly restricted to the dark phase) versus PF-670462-treated worms (active behavior distributed). (E) PF-670462 abolishes rhythmic circadian locomotor activity in Platynereis. Worms were recorded under 16:8LD circadian illumination (see Figure 4A for a nontreated comparison). (F and G) Periodogram analyses of individual worms show that PF-670462 treated animals are in majority arrhythmic (AR). No worm was rhythmic (R), and few worms remaining weakly rhythmic (WR) showed a strongly altered period length of 17 hr. (H and I) Circalunar spawning cycles are maintained in control (H) and under PF-670462 treatment (I). Collection data from five independent experiments were pooled.
Figure 7
Figure 7
Circadian and Circalunar Clock Model in Platynereis Proposed interaction of separate circadian and circalunar oscillators in Platynereis dumerilii is shown. Solid blue line indicates impact of the circalunar oscillator on the transcriptional regulation of circadian clock gene expression resulting in elevated levels of pdp1, period, clock, and timeless. The impact of the circalunar clock on the circadian clock genes can be direct or indirect on one or all of these genes.
Figure S1
Figure S1
Synchronized Spawning Behavior of Platynereis dumerilii, Related to Figure 1 Numbers of mature animals oscillate in accordance with the lunar cycle. Figure redrawn from Hauenschild (1955).
Figure S2
Figure S2
Platynereis L-Cry and tr-Cry Represent Members of the Light Receptive and Transcriptional Repressor-type Cryptochrome Groups, Respectively, Related to Figure 2 (A) Platynereis L-Cry and tr-Cry represent members of the light receptive and transcriptional repressor-type Cryptochrome groups, respectively. Maximum likelihood and neighbor joining trees group Pdu-L-Cry and Pdu-tr-Cry into the different classes with high branch support. The topology of the ML tree is shown, support values are given as ML/NJ at critical branches. Branch colors: green- vertebrates, red- lophotrochozoa, dark blue- insects, gray- plants, black- bacteria. (B–G) Temporal profiles of clock gene RNA expression from Platynereis heads; (B-D) NM under circadian light regime (E-G) NM under constant darkness. n = 5-15 (B-D); n = 3-6 (E-G); 4-5 heads/n. Values are means ± SEM p value determined by one-way ANOVA. (H) Example of one of the western blots used for the quantification shown in (Figure 2L). 6h: 6hr light puls; c: dark control. Related to Figure 2.
Figure S3
Figure S3
Specific Expression of Platynereis Circadian Clock Gene Orthologs in the Medial Forebrain, Related to Figure 3 (A–C) Whole mount in situ hybridization (WMISH) of period, L-cry and pdp1 on premature adult Platynereis heads. Timeline for period expression anti-correlates with Pdu-bmal expression timeline (see Figure 3A). Dotted oval outlines circadian clock gene expressing, oval-shaped nucleus. Dorsal views, anterior up. Compare to Figures 3A–3E. (D and E) WMISHs of period and bmal sense controls. Arrows point at oval-shaped brain nucleus expressing circadian clock genes. (F) WMISHs of non-circadian transcription factors pax6 and nk2.1 show that the co-expression of circadian clock genes in the oval-shaped nucleus is specific. (G–J) Co-localization of circadian clock gene expression with ciliary photoreceptor cells. Arrows point at the large cilia of the ciliary photoreceptors, counterstained by the anti-acetylated tubulin antibody, visualizing stabilized microtubules (Arendt et al., 2004). (G) DIC image. (H) Fluorescent image visualizing the anti-acetylated tubulin antibody staining (red). (I) Overlay of N and O. (J) scheme of P. (K) Expression of bmal in cells of the adult eye as revealed by WMISH on a Platynereis eye color mutant. (L) WMISH of ck1 delta/epsilon shows co-expression with Platynereis circadian clock genes in the oval-shaped nucleus (see magnified view). In addition ck1 delta/epsilon expressing cells are located anterior and posterior to the neuropil (arrow). Dorsal views, anterior up, asterisk- position of major brain neuropil. e- adult eye. Scale bar 50μm. Related to Figure 3.
Figure S4
Figure S4
Platynereis Circadian Locomotor Activity under Laboratory Conditions, Related to Figure 4 (A) Types of activities scored as either active (1) or inactive (0) for analyses of Platynereis circadian locomotor behavior. (B) Recording set-up closed (large image), open (small image) showing LED infrared array (white box), camera and the control recording device for light and temperature ( = HOBO temperature tight 28000DP logger), arrow). (C) Spectral analysis of white light LED's (OSRAM 24V) used in the black box set up (visible light spectrum). (D–G) Mean locomotor activity (hourly average ± SEM) over 3 consecutive days containing rhythmic and arrhythmic animals, (D) N = 14, (E) N = 17, (F) N = 22, (G) N = 24. Compare to Figures 4A and 4F–4H. (H) Average periodogram for NM/DD conditions using Lomp-Scargle analysis. NM/DD: worms were entrained normally with circadian and circalunar illumination conditions. Recordings were performed during NM in complete darkness. Compare to Figures 4F, 4J, and 4L. (I) Frequency power was calculated for all rhythmic animals. Worms under NM LD/DD versus FR-FM LD/DD show significant differences in strength of the rhythm. Error bars represent ±SEM. Student’s t test. p < 0.05, ∗∗p < 0.01, ∗∗∗p < 0.001. (J–M) Individual Lomp-Scargle periodograms arranged according to increased period length for (J) NM/LD, (K) NM/DD, (L) FR-FM/LD, (M) FR-FM/DD, see D–G for illumination. Red line indicates significant p-level = 0.05. Period length > 29 were excluded from the 3 day analysis (indicated by dotted line) R; rhythmic, WR; weakly rhythmic, AR; arrhythmic. Related to Figure 4.
Figure S5
Figure S5
Circadian Transcriptional Regulation of timeless Is under Circalunar Clock Control, Related to Figure 5 (A–D) Temporal profiles of clock gene RNA expression measured by qPCR under NM and FR-FM conditions from Platynereis heads. See Figure 1C for detailed information on circalunar-light regime. Values are means ± SEM, NM n = 5-15, FR-FM n = 3-11; 4-5 heads/n. p-value determined by one-way ANOVA. (A′–D′) Overall daily transcript levels calculated as area under the curve (AUC) based on 24h expression data shown in (A–D). Significant differences by Wilcoxon signed rank test. p < 0.05. (E) Expression of timeless increases in the circadian core brain domains in FR-FM compared to NM. Scale bar 50μm. Oval- outline of circadian clock brain area (also compare to Figures 3A–3E). (F–H) Temporal profiles of clock gene mRNA expression under FR/NM (gray graph) resemble that of NM and FR-FM. Values are means ± SEM, FR-NM n = 3. Data for NM and FR-FM re-plotted from Figures 5B–5D. (F′–H′) Area under the curve (AUC) based on 24h data shown in (F–H). Platynereis overall expression dynamics of clock and period are significantly decreased in FR-NM (gray bar) compared to FR-FM and are similar to NM (FR-NM n = 3; 4-5 heads/n). Data for NM and FR-FM re-plotted from Figure 5B'-D'. Significant differences by Wilcoxon signed rank test. p < 0.05, ∗∗∗p < 0.001. Related to Figure 5.
Figure S6
Figure S6
PF-670462 Treatment Disrupts Circadian Transcript Oscillations, Related to Figure 6 (A–E) Clock gene transcriptional oscillations are severely affected under PF-670462 treatment compared to non-treated controls (dashed line). Values are means ± SEM; n = 3; 4-5 heads/n. Related to Figure 6.

Comment in

  • Biological clocks: riding the tides.
    de la Iglesia HO, Johnson CH. de la Iglesia HO, et al. Curr Biol. 2013 Oct 21;23(20):R921-3. doi: 10.1016/j.cub.2013.09.006. Curr Biol. 2013. PMID: 24156810 Free PMC article.

References

    1. Antoch M.P., Song E.J., Chang A.M., Vitaterna M.H., Zhao Y., Wilsbacher L.D., Sangoram A.M., King D.P., Pinto L.H., Takahashi J.S. Functional identification of the mouse circadian Clock gene by transgenic BAC rescue. Cell. 1997;89:655–667. - PMC - PubMed
    1. Arendt D., Tessmar-Raible K., Snyman H., Dorresteijn A.W., Wittbrodt J. Ciliary photoreceptors with a vertebrate-type opsin in an invertebrate brain. Science. 2004;306:869–871. - PubMed
    1. Aschoff J.E. Volume 4. Plenum Press; New York: 1981. (Handbook of Behavioral Neurobiology).
    1. Bachleitner W., Kempinger L., Wülbeck C., Rieger D., Helfrich-Förster C. Moonlight shifts the endogenous clock of Drosophila melanogaster. Proc. Natl. Acad. Sci. USA. 2007;104:3538–3543. - PMC - PubMed
    1. Backfisch B., Veedin Rajan V.B., Fischer R.M., Lohs C., Arboleda E., Tessmar-Raible K., Raible F. Stable transgenesis in the marine annelid Platynereis dumerilii sheds new light on photoreceptor evolution. Proc. Natl. Acad. Sci. USA. 2013;110:193–198. - PMC - PubMed

Supplemental References

    1. Larkin M.A., Blackshields G., Brown N.P., Chenna R., McGettigan P.A., McWilliam H., Valentin F., Wallace I.M., Wilm A., Lopez R. Clustal W and Clustal X version 2.0. Bioinformatics. 2007;23:2947–2948. - PubMed
    1. Schmidt H.A., Strimmer K., Vingron M., von Haeseler A. TREE-PUZZLE: maximum likelihood phylogenetic analysis using quartets and parallel computing. Bioinformatics. 2002;18:502–504. - PubMed
    1. Vinh S., Von Haeseler A. IQPNNI: moving fast through tree space and stopping in time. Mol. Biol. Evol. 2004;21:1565–1571. - PubMed

Publication types

LinkOut - more resources