. 2013 Oct 17;39(4):722-32.
doi: 10.1016/j.immuni.2013.08.028. Epub 2013 Sep 26.

Control of T helper 2 responses by transcription factor IRF4-dependent dendritic cells

Affiliations

Control of T helper 2 responses by transcription factor IRF4-dependent dendritic cells

Yan Gao et al. Immunity. .

Abstract

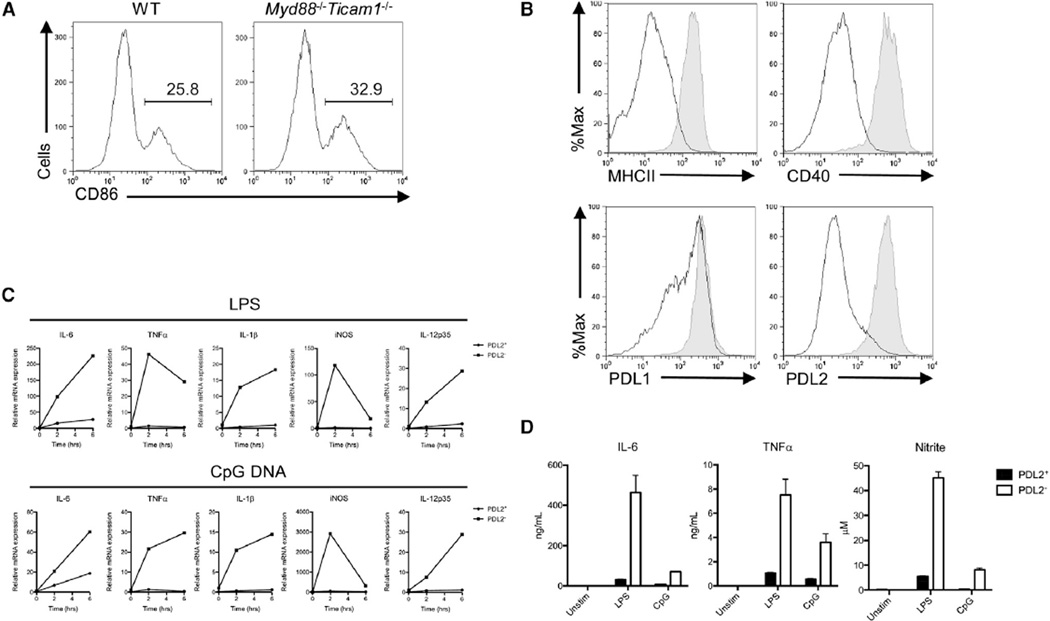
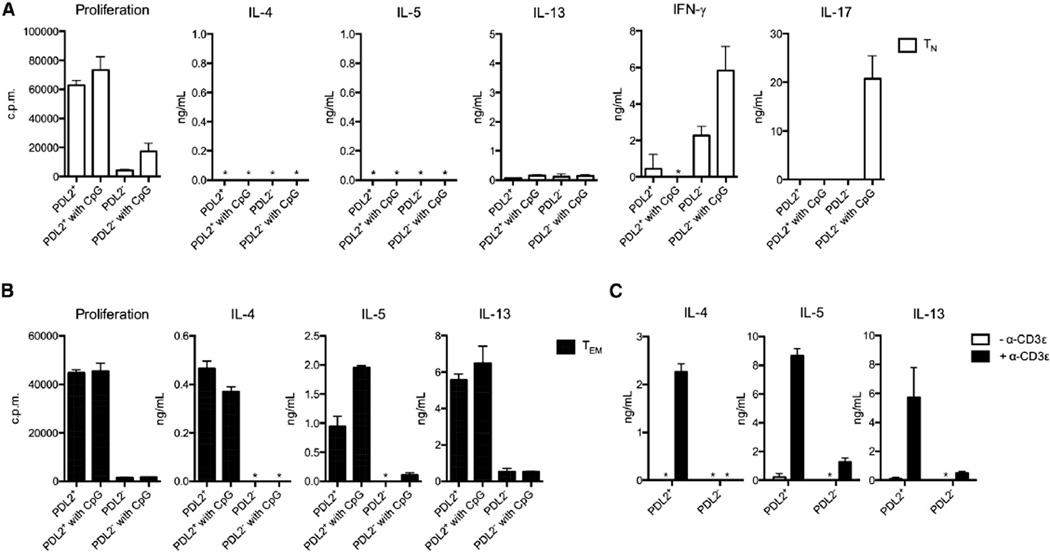
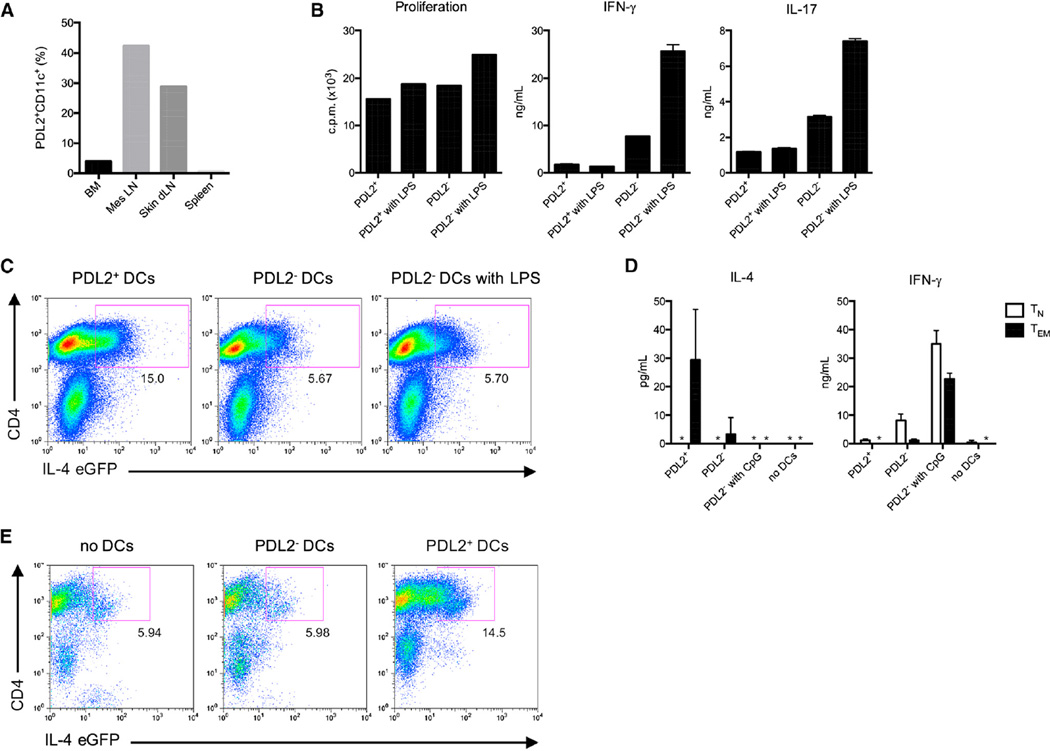
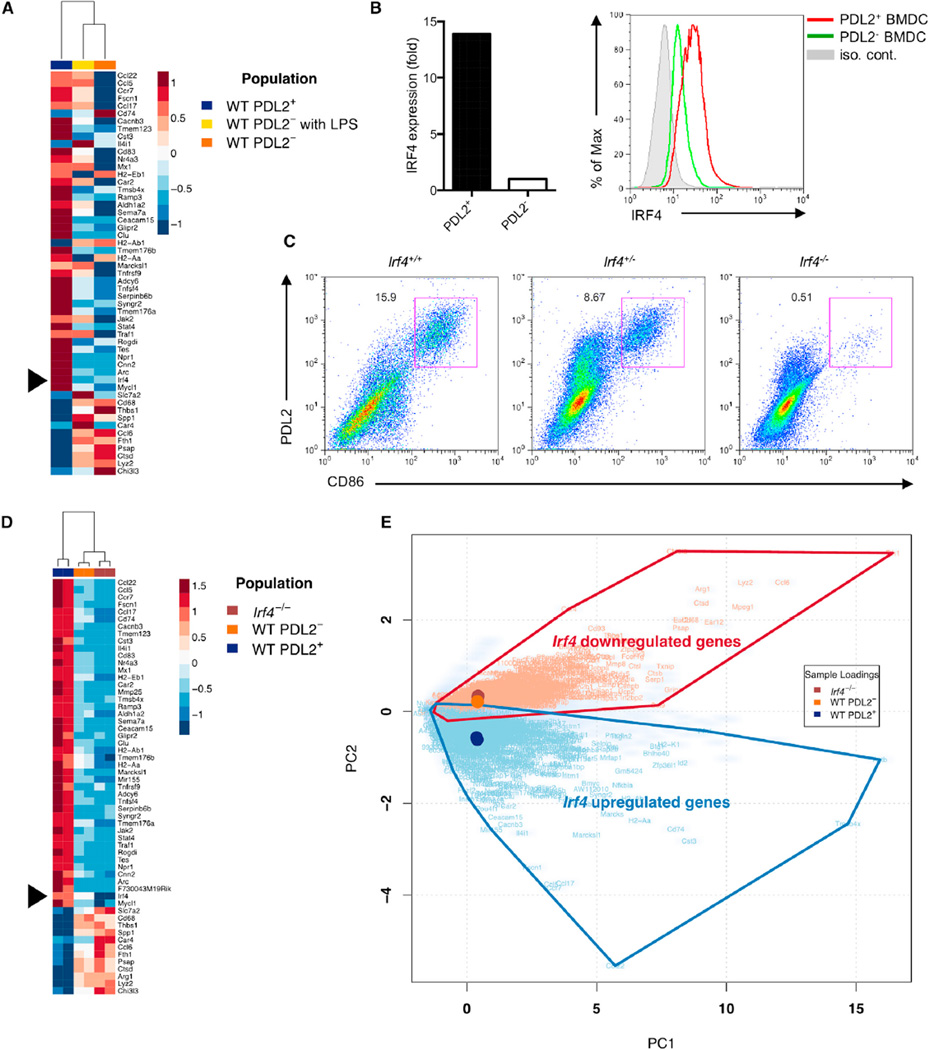
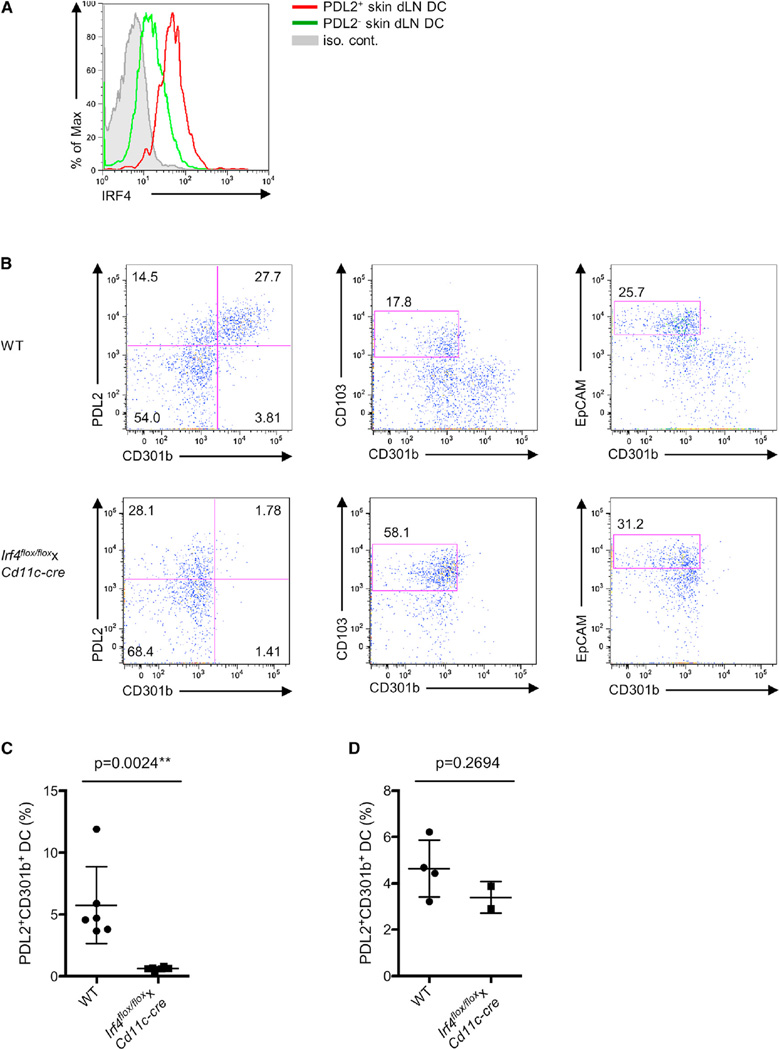
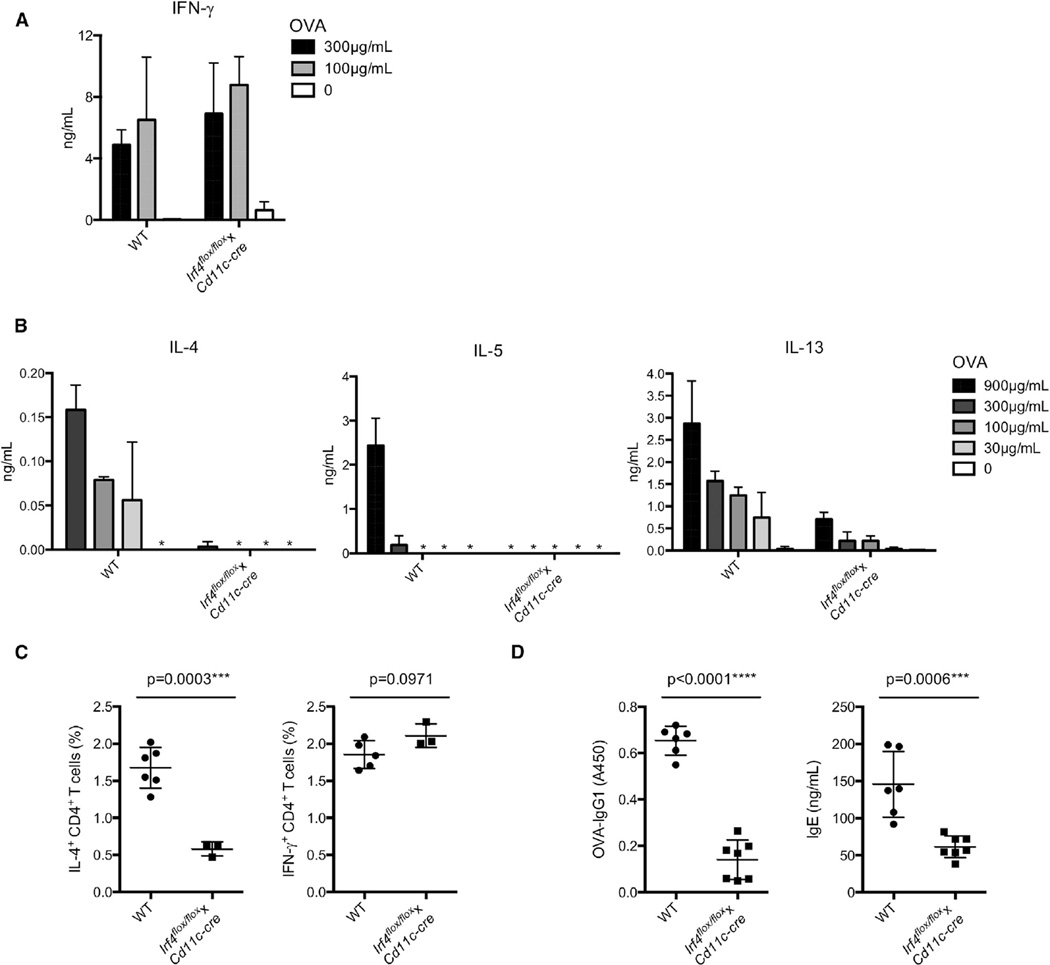
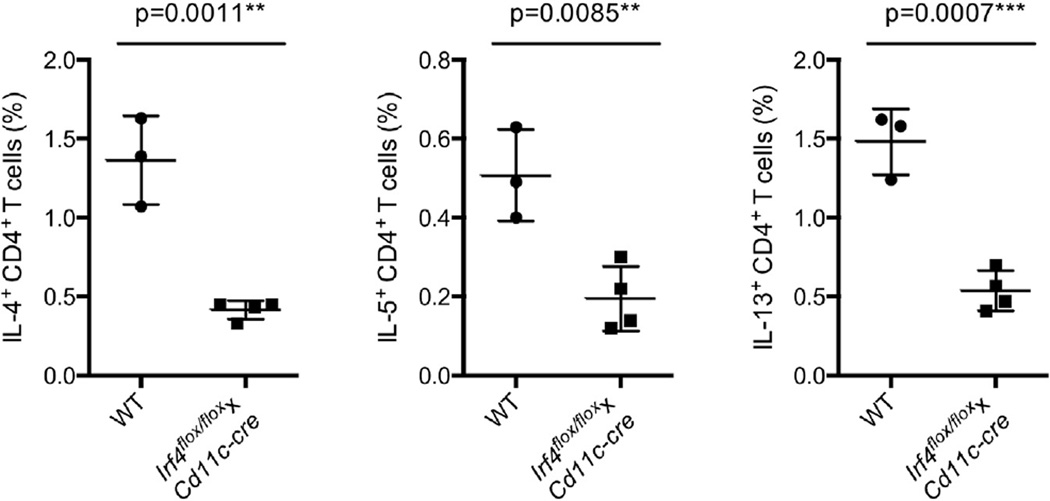
CD4⁺ T cell differentiation is regulated by specialized antigen-presenting cells. Dendritic cells (DCs) produce cytokines that promote naive CD4⁺ T cell differentiation into T helper 1 (Th1), Th17, and inducible T regulatory (iTreg) cells. However, the initiation of Th2 cell responses remains poorly understood, although it is likely that more than one mechanism might be involved. Here we have defined a specific DC subset that is involved in Th2 cell differentiation in vivo in response to a protease allergen, as well as infection with Nippostrongylus brasiliensis. We have demonstrated that this subset is controlled by the transcription factor interferon regulatory factor 4 (IRF4), which is required for their differentiation and Th2 cell-inducing function. IRF4 is known to control Th2 cell differentiation and Th2 cell-associated suppressing function in Treg cells. Our finding suggests that IRF4 also plays a role in DCs where it controls the initiation of Th2 cell responses.


Figures

Figure 1
Figure 1. Bone-Marrow-Derived PDL2+ Dendritic Cells Are Phenotypically Mature and Hyporesponsive to Proinflammatory Stimuli
(A) Percentages of CD86hi BMDCs in GM-CSF-supplemented bone-marrow cultures from WT C57BL/6 and Myd88−/− Ticam1−/− mice. Gated on CD11c+ cells. (B) Cell-surface expression of maturation markers (MHCII, CD40) and B7 family members (PDL1, PDL2) by CD86hi (shaded) and CD86lo (solid line) BMDCs. (C) Induction of proinflammatory genes (IL-6, TNF-α, IL-1β, iNOS, and IL-12p35) in PDL2+ and PDL2 BMDCs stimulated with LPS or CpG DNA. PDL2+ and PDL2 DC subsets were sorted from GM-CSF-supplemented bone-marrow cultures at day 5 and stimulated with LPS or CpG DNA for indicated times. Data are representative of three independent experiments. (D) Secretion of proinflammatory cytokines (IL-6, TNF-α) and nitric oxide by PDL2+ and PDL2 BMDCs stimulated with LPS or CpG DNA. Sorted PDL2+ and PDL2 BMDCs were stimulated with LPS or CpG DNA for 24 hr. IL-6 and TNF-α amounts in the supernatant were measured by ELISA, and NO production was measured by the Greiss assay as nitrite concentration. Data are representative of three independent experiments, and bar graphs show mean ± SD. See also Figure S1.
Figure 2
Figure 2. PDL2+ BMDCs Induce Th2 Responses in Effector or Memory CD4 T Cells
(A) Proliferation and cytokine production by naive CD4+ T cells (TN) cultured with PDL2+ or PDL2 BMDCs in the presence of soluble purified α-CD3 antibody and CpG DNA, where indicated. Cytokines in the supernatant from cocultures at day 3 or 4 were measured by ELISA. Proliferation was measured by incorporation of [3H]-thymidine during the last 16 hrs of coculture (cpm). *, not detected (same hereafter). Data are representative of at least three independent experiments, and bar graphs show mean ± SD. (B) Proliferation and cytokine production by effector or memory CD4+ T cells (Tem) stimulated with BMDCs, same as above (A). Data are representative of at least three independent experiments, and bar graphs show mean ± SD. (C) Dependence on TCR engagement for the effector or memory Th2 cell response induced by PDL2+ BMDCs. Tem cells were cocultured with PDL2+ or PDL2 BMDCs in the presence or absence of α-CD3ε. Data are represented as mean ± SD. See also Figure S2.
Figure 3
Figure 3. PDL2+ DCs Are Present in Skin-Draining Lymph Nodes and Regulate Effector or Memory Th2 Response
(A) Percentage of PDL2+ DCs in different lymphoid organs in vivo during homeostasis. BM, bone marrow; Mes LN, mesenteric lymph nodes; skin dLN, skin-draining lymph nodes. (B) Proliferation and cytokine production by total splenic CD4+T cells stimulated for 3–4 days with PDL2+ or PDL2 skin dLN DCs, plus or minus LPS stimulation. Data are representative of at least three independent experiments, and bar graphs show mean ± SD. (C) IL-4-eGFP expression by total CD4+ T cells from 4get mice stimulated with skin dLN PDL2+ or PDL2 DCs. Data are representative of three independent experiments. (D) IL-4 and IFN-γ secretion by Tn and Tem cells stimulated with skin dLN DCs. Data are representative of three independent experiments, and bar graphs show mean ± SD. (E) IL-4-eGFP expression by Tem cells from 4get mice stimulated with skin dLN DCs. Data are representative of two independent experiments. See also Figure S3.
Figure 4
Figure 4. IRF4 Expression Is Critical for the Development of Bone-Marrow-Derived PDL2+ DCs
(A) Microarray analysis of log2 transformed expression amounts from three BMDC populations (PDL2+, PDL2, and LPS stimulated PDL2). Irf4 is indicated. Genes displayed correspond to those identified as significant by RNA-Seq analysis. (B) IRF4 mRNA and protein expression in PDL2+ BMDCs was examined by real-time RT-PCR and flow cytometry, respectively. Data are representative of at least three independent experiments. (C) Percentages of PDL2+ BMDCs in WT, Irf4+/− and Irf4−/− bone-marrow cultures. Data are representative of three independent experiments. (D and E) RNA-seq analysis of gene expression in three BMDC populations (WT PDL2+, WT PDL2, and Irf4−/−). Heatmap of square root transformed RPKM values for genes with PC2 scores greater than a designated absolute threshold value of ± 2.38 (D). Biplot derived from PCA analysis of gene summarized RPKM values (cloudy blue) plotted according to two PCs that account for > 80% of total sample variance (E). PC1 describes overall expression and PC2 describes differential expression between populations. Sample loading vectors and the symbols of overlapping, differentially expressed genes (Benjamini-Hochberg adjusted p value < 10−50 by negative binomial testing) are displayed. See also Figure S4.
Figure 5
Figure 5. IRF4 Expression Is Critical for the Presence of PDL2+ CD301b+ DCs in Skin dLNs
(A) IRF4 protein expression in PDL2+ skin dLN DCs were examined by flow cytometry. (B) MHCIIhi CD11c+ DCs from skin dLNs of WT and Irf4flox/floxxCd11c-cre mice were examined by flow cytometry for PDL2, CD301b, CD103, and EpCAM expression. The percentages of PDL2+ CD301b+ and PDL2+ CD301b DCs (left), dermal CD103+ DCs (middle), and EpCAM+ Langerhans cells (right) were shown as indicated. Data are representative of three independent experiments. (C) Percentages of PDL2+ CD301b+ DCs in the skin dLNs of WT and Irf4flox/floxxCd11c-cre mice. Data are represented as mean ± SD. **p < 0.01. (D) Percentages of PDL2+ CD301b+ DCs in the ear dermis of WT and Irf4flox/floxxCd11c-cre mice. Data are represented as mean ± SD.
Figure 6
Figure 6. IRF4 Expression in DCs Is Essential for the Papain-Induced Th2 Cell Response
(A and B) LPS-induced Th1 cell response (A) and papain-induced Th2 cell response (B) in WT and Irf4flox/floxxCd11c-cre mice. WT and Irf4flox/floxxCd11c-cre mice were immunized subcutaneously with OVA plus either LPS or papain as Th1 and Th2 cell-inducing adjuvants, respectively. CD4+ T cells were sorted from inguinal and popliteal LNs at day 6 and stimulated with irradiated splenic APCs and titrating doses of OVA for 4 days. IFN-γ (for LPS response) and IL-4, IL-5, and IL-13 (for papain response) production was measured by ELISA. Data are representative of at least three independent experiments, and bar graphs show mean ± SD. (C) Percentages of IL-4- or IFN-γ-producing CD4+ T cells in draining inguinal and popliteal LNs in WT and Irf4flox/floxxCd11c-cre mice 6 days after subcutaneous immunization with OVA plus papain. Data are represented as mean ± SD. ***p < 0.001. (D) OVA-specific IgG1 and total IgE amounts in the serum were measured by ELISA in WT and Irf4flox/floxxCd11c-cre mice at day 21 after subcutaneous immunization with OVA plus papain at day 0 and day 14. Data are represented as mean ± SD. ***p < 0.001, ****p < 0.0001.
Figure 7
Figure 7. IRF4 Expression in DCs Is Essential for Th2 Cell Responses Induced after Infection with Nippostrongylus Brasiliensis
Percentages of IL-4-, IL-5-, and IL-13-producing CD4+ T cells in draining mesenteric LNs in WT and Irf4flox/floxxCd11c-cre mice 7 days after subcutaneous infection with Nippostrongylus brasiliensis. Data are represented as mean ± SD. **p < 0.01, ***p < 0.001.

Comment in

References

    1. Bajana S, Roach K, Turner S, Paul J, Kovats S. IRF4 promotes cutaneous dendritic cell migration to lymph nodes during homeostasis and inflammation. J. Immunol. 2012;189:3368–3377. - PMC - PubMed
    1. Bell BD, Kitajima M, Larson RP, Stoklasek TA, Dang K, Sakamoto K, Wagner KU, Reizis B, Hennighausen L, Ziegler SF. The transcription factor STAT5 is critical in dendritic cells for the development of TH2 but not TH1 responses. Nat. Immunol. 2013;14:364–371. - PMC - PubMed
    1. Borkowski TA, Nelson AJ, Farr AG, Udey MC. Expression of gp40, the murine homologue of human epithelial cell adhesion molecule (Ep-CAM), by murine dendritic cells. Eur. J. Immunol. 1996;26:110–114. - PubMed
    1. Caton ML, Smith-Raska MR, Reizis B. Notch-RBP-J signaling controls the homeostasis of CD8- dendritic cells in the spleen. J. Exp. Med. 2007;204:1653–1664. - PMC - PubMed
    1. Ciofani M, Madar A, Galan C, Sellars M, Mace K, Pauli F, Agarwal A, Huang W, Parkurst CN, Muratet M, et al. A validated regulatory network for Th17 cell specification. Cell. 2012;151:289–303. - PMC - PubMed

Publication types

MeSH terms