. 2013 Oct 24;52(2):221-33.
doi: 10.1016/j.molcel.2013.08.036. Epub 2013 Sep 26.

Cooperative control of holliday junction resolution and DNA repair by the SLX1 and MUS81-EME1 nucleases

Affiliations

Cooperative control of holliday junction resolution and DNA repair by the SLX1 and MUS81-EME1 nucleases

Dennis Castor et al. Mol Cell. .

Abstract

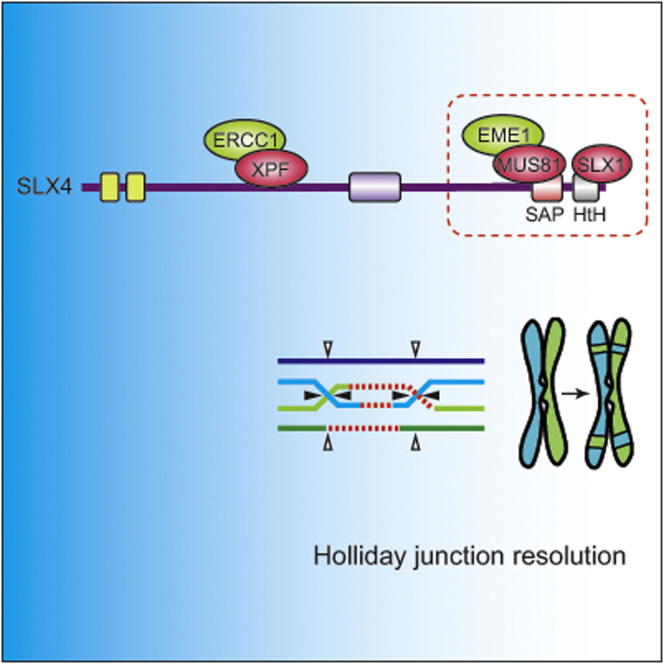
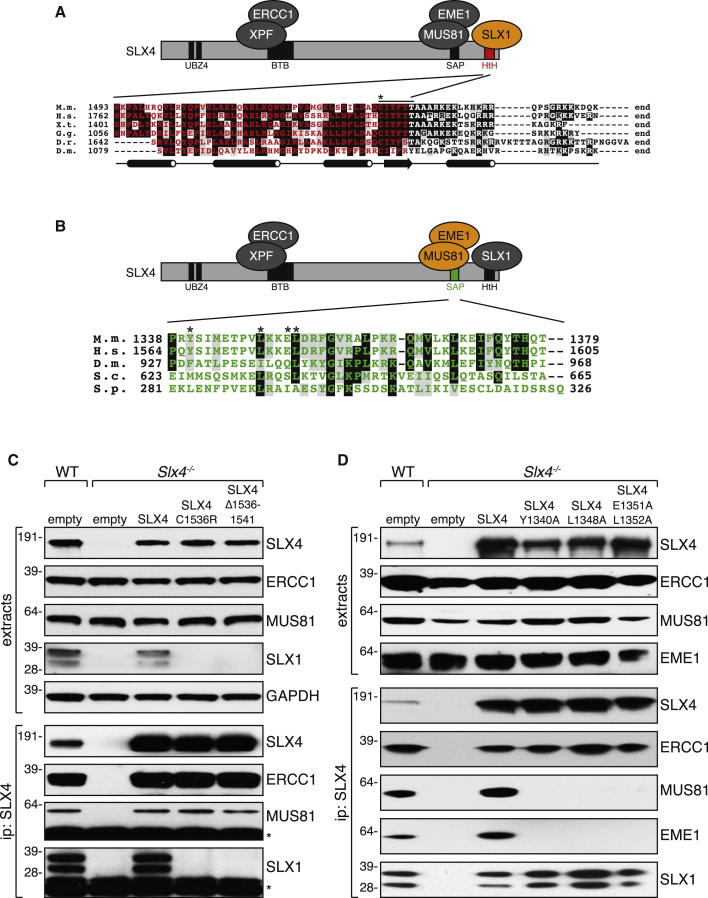
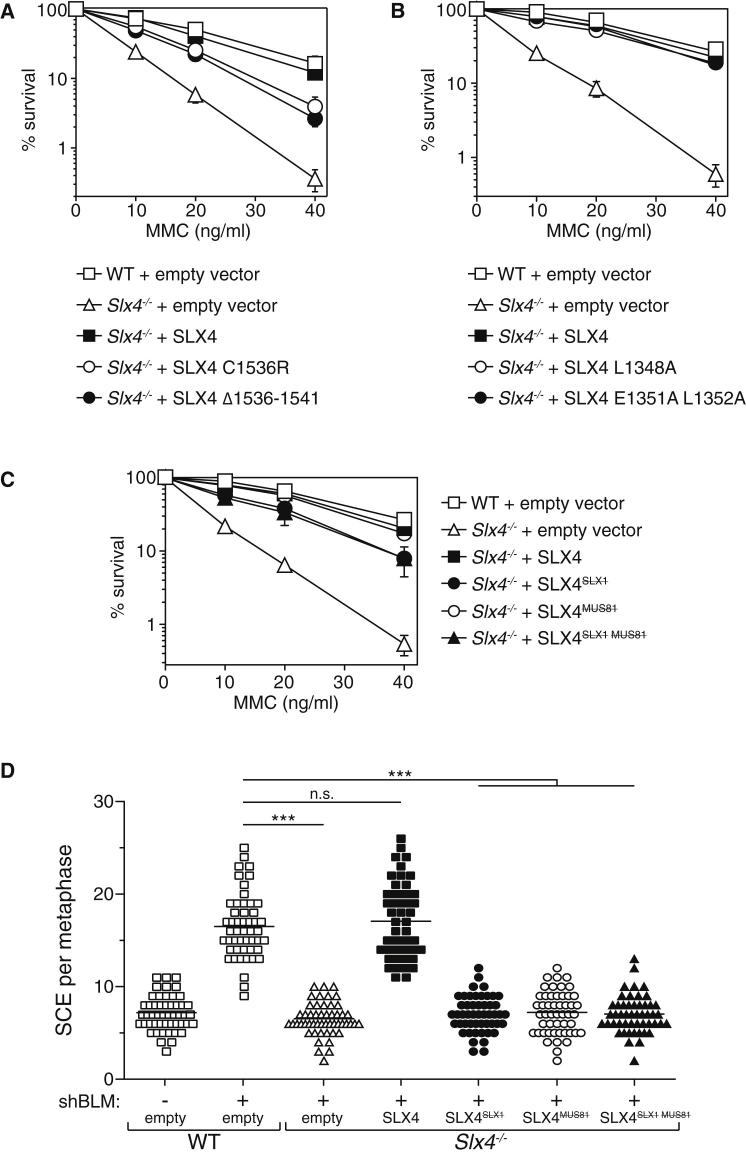
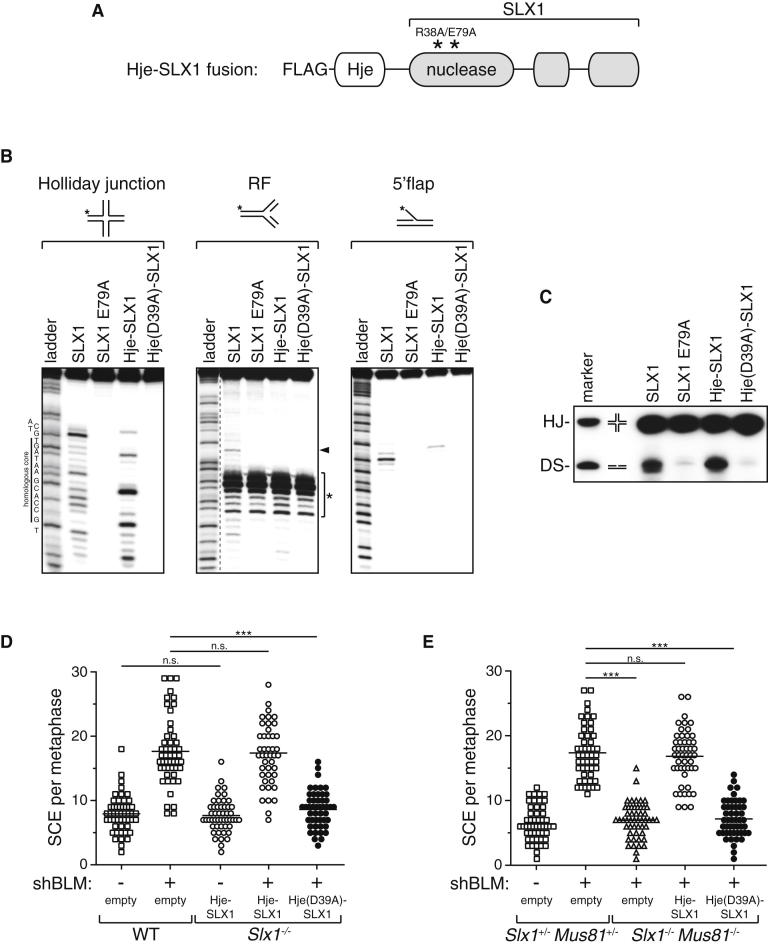
Holliday junctions (HJs) are X-shaped DNA structures that arise during homologous recombination, which must be removed to enable chromosome segregation. The SLX1 and MUS81-EME1 nucleases can both process HJs in vitro, and they bind in close proximity on the SLX4 scaffold, hinting at possible cooperation. However, the cellular roles of mammalian SLX1 are not yet known. Here, we use mouse genetics and structure function analysis to investigate SLX1 function. Disrupting the murine Slx1 and Slx4 genes revealed that they are essential for HJ resolution in mitotic cells. Moreover, SLX1 and MUS81-EME1 act together to resolve HJs in a manner that requires tethering to SLX4. We also show that SLX1, like MUS81-EME1, is required for repair of DNA interstrand crosslinks, but this role appears to be independent of HJ cleavage, at least in mouse cells. These findings shed light on HJ resolution in mammals and on maintenance of genome stability.


Figures

None
Graphical abstract
Figure 1
Figure 1
SLX1 Is Involved in the Repair of DNA ICLs (A) Western blot analysis of MEF extracts from wild-type (WT), Slx1−/−, and Slx4−/− mice. Two separate Slx1−/− MEF clones were tested. (See also Figures S1 and S2.) (B) Clonogenic survival analysis of MEFs exposed to genotoxins. For each genotype, cell viability of untreated cells is defined as 100%. Data are represented as mean ± SEM, n = 3. (See also Figure S3.) (C) HEK293 cells stably expressing tetracycline-inducible (“+”) GFP-tagged mouse SLX4 were transfected with mouse SLX1 (WT), SLX1 active site mutant E79A, or left untransfected (“−”). Cell extracts were subjected to western blotting (left panel). Anti-FLAG immunoprecipitates were incubated with a synthetic radiolabeled four-way junction containing a 12 bp homologous core. Reaction products were subjected to denaturing PAGE (right panel). (D) Western blot analysis of Slx1−/− MEFs complemented with untagged versions of wild-type SLX1, SLX1 E79A, or empty vector (top panels). Extracts were subjected to immunoprecipitation with anti-SLX4 antibodies, and precipitates were probed with the antibodies indicated (bottom panels). , IgG light chain. (E) Clonogenic survival analysis of complemented Slx1−/− MEFs from (D) exposed to increasing doses of MMC. For each genotype, cell viability of untreated cells was defined as 100%. Data are represented as mean ± SEM, n = 3.
Figure 2
Figure 2
Defective HJ Resolution in Slx1−/− Cells (A) Representative image of a metaphase spread for SCE analysis in MEFs after depletion of BLM with shRNA-expressing retroviruses. SCE events are indicated by arrowheads. (B) Western blot analysis of MEFs, of the genotypes indicated, infected with retroviruses expressing a BLM-specific shRNA (+) or with virus prepared with empty vector as control (−). (C) Scatterplot of SCE frequencies in MEFs depleted of BLM as described in (B). Fifty metaphases were analyzed for each condition, and significance was calculated using one-way ANOVA (∗∗∗p < 0.0001) followed by Bonferroni’s Multiple Comparison Test. Each point represents the total number of SCEs in a single mitotic spread. The horizontal line in each data set represents mean SCE frequency. (D) Same as (C) except that Slx1−/− MEFs infected with viruses expressing SLX1, SLX1 E79A, or empty virus were analyzed. Significance was calculated as above; ∗∗∗p < 0.0001; n.s., nonsignificant. (E) Scatterplot of SCE frequencies in wild-type, Slx1−/−, and Slx4−/− MEFs after exposure to increasing concentrations of MMC. Fifty metaphases were counted for each condition. Each point represents the total number of SCEs in a single mitotic spread. The horizontal line in each data set represents mean SCE frequency. (F) Same as (E) except that the data were plotted as fold increase over untreated cells. Data are represented as mean ± SEM. Experimental significance was calculated using an unpaired t test; ∗∗p < 0.01; ∗∗∗p < 0.001.
Figure 3
Figure 3
SLX1 and MUS81 Act Epistatically in HJ Resolution (A) Scatterplot of SCE frequencies in MEFs of the genotypes indicated after exposure to 10 ng/ml MMC. Fifty metaphases were counted for each condition and significance was calculated using a one-way ANOVA (∗∗∗p < 0.0001) followed by Bonferroni’s Multiple Comparison Test. Each point represents the total number of SCEs in a single mitotic spread. The horizontal line in each data set represents the mean SCE frequency. (B) Clonogenic survival analysis of MEFs of the genotypes indicated exposed to MMC. For each genotype, cell viability of untreated cells was defined as 100%. Data are represented as mean ± SEM, n = 3. (See also Figure S4.) (C) Western blot analysis of MEFs, of the genotypes indicated, infected with retroviruses expressing a BLM-specific shRNA (+). Viruses prepared with empty vector served as control (−). (D) Cells from (C) were analyzed for SCE frequencies. Fifty metaphases were counted for each condition and significance was calculated as in (A). Each point represents the total number of SCEs in a single mitotic spread. The horizontal line in each data set represents mean SCE frequency.
Figure 4
Figure 4
SLX4 Mutations that Prevent Interaction with SLX1 and MUS81 (A) Alignment of the C terminus of SLX4 from different species. The HtH domain is highlighted in red. The black line above the alignment refers to the six amino acid deletion in SLX4 that abolished interaction with SLX1, and the asterisk indicates Cys1536. Jalpred3-based secondary structure prediction is indicated below the alignment with barrels representing α helices and the arrow a β sheet. M.m., Mus musculus; H.s., Homo sapiens; X.t., Xenopus tropicalis; G.g., Gallus gallus; D.r., Danio rerio; D.m., Drosophila melanogaster. (B) Alignment of the SAP domain of SLX4 from different species (highlighted in green). Tyr1340, Leu1348, Glu1351, and Leu1352 are indicated with asterisks. S.c., Saccharomyces cerevisiae; S.p., Saccharomyces pombe. (C) Slx4−/− MEFs were infected with retroviruses expressing SLX4 wild-type (SLX4), SLX4 C1536R, or SLX4 Δ1536-1541. Extracts were subjected to western blot analysis (upper panels) or immunoprecipitation with anti-SLX4 antibodies (lower panels). (D) Same as (C) except that Slx4−/− MEFs were infected with retroviruses expressing SLX4 wild-type (SLX4), SLX4 bearing alanine mutations at Y1340, L1348, or E1351+L1352.
Figure 5
Figure 5
HJ Resolution Requires Binding of SLX1 and MUS81-EME1 to SLX4 (A) Clonogenic survival analysis of Slx4−/− MEFs stably expressing SLX4 wild-type (SLX4), SLX4 C1536R, or SLX4 Δ1536-1541, exposed to MMC. For each genotype, cell viability of untreated cells was defined as 100%. Wild-type MEFs and Slx4−/− MEFs infected with empty virus were used as controls. Data are represented as mean ± SEM, n = 3. (B) Same as (A) except that SLX4 bearing alanine mutations at L1348 or E1351+L1352 were examined. (C) Clonogenic analysis as in (A) and (B) except that SLX4 mutations C1536R (SLX4SLX1) and E1351A+L1352A (SLX4MUS81) were combined to prevent interaction with both SLX1 and MUS81 (SLX4 SLX1MUS81). (See also Figure S5.) (D) Scatterplot of SCE frequencies in MEFs infected with retroviruses expressing a BLM-specific shRNA or control virus (−). The following MEFs were examined: Slx4−/− MEFs infected with SLX4 wild-type or mutants of SLX4, i.e., SLX4SLX1, SLX4MUS81, or SLX4SLX1MUS81. Wild-type MEFs and Slx4−/− MEFs infected with viruses prepared from empty vector were used as control. Fifty metaphases were counted for each condition and significance was calculated using one-way ANOVA (∗∗∗p < 0.0001) followed by Bonferroni’s Multiple Comparison Test. Each point represents the total number of SCE in a single mitotic spread. The horizontal line in each data set represents mean SCE frequency.
Figure 6
Figure 6
HJs Are Physiological Substrates of SLX1 and MUS81 (A) Schematic diagram of a Hje-SLX1 fusion protein. The SLX1 nuclease domain was mutated (R38A E79A) to inactivate it and fused to an archaeal resolving enzyme Hje known to cleave Holliday junctions preferentially. (B) HEK293 cells stably expressing GFP-tagged SLX4 were transfected with SLX1 wild-type or SLX1 E79A, Hje-SLX1, or Hje (D39A)-SLX1. Anti-FLAG immunoprecipitates were incubated with synthetic DNA structures: mobile Holliday junction (b strand-labeled Jbm5), replication fork (RF)-like structure (b strand-labeled), or 5′ flap (a3 strand-labeled). Reaction products were subjected to denaturing PAGE. Sequencing ladders were obtained by subjecting the corresponding substrates to Maxam and Gilbert‘s purine-specific reaction. Lower exposure is shown for the RF sequencing ladder. (See also Figure S6.) (C) Same as (B) except the products from the HJ reaction were subjected to nondenaturing PAGE. HJ and duplex DNA (DS) of the same size as the predicted products of symmetrical cleavage of the HJ were run in parallel as markers. (D) Scatterplot of SCE frequencies in MEFs infected with retroviruses expressing a BLM-specific shRNA (+) or with control virus (−). The following MEFs were examined: Slx1−/− MEFs infected with Hje-SLX1, Hje (D39A)-SLX1, or empty virus. Wild-type MEFs infected with empty virus were used as control. Fifty metaphases were counted for each condition and significance was calculated using one-way ANOVA (∗∗∗p < 0.0001; n.s., nonsignificant) followed by Bonferroni’s Multiple Comparison Test. Each point represents the total number of SCEs in a single mitotic spread. The horizontal line in each data set represents mean SCE frequency. (E) Same as (D) except that Slx1−/−Mus81−/− MEFs expressing Hje-SLX1, Hje (D39A)-SLX1, or empty virus were examined.

Comment in

References

    1. Agostinho A., Meier B., Sonneville R., Jagut M., Woglar A., Blow J., Jantsch V., Gartner A. Combinatorial regulation of meiotic holliday junction resolution in C. elegans by HIM-6 (BLM) helicase, SLX-4, and the SLX-1, MUS-81 and XPF-1 nucleases. PLoS Genet. 2013;9:e1003591. - PMC - PubMed
    1. Andersen S.L., Bergstralh D.T., Kohl K.P., LaRocque J.R., Moore C.B., Sekelsky J. Drosophila MUS312 and the vertebrate ortholog BTBD12 interact with DNA structure-specific endonucleases in DNA repair and recombination. Mol. Cell. 2009;35:128–135. - PMC - PubMed
    1. Auerbach A.D. Fanconi anemia and its diagnosis. Mutat. Res. 2009;668:4–10. - PMC - PubMed
    1. Bailly A.P., Freeman A., Hall J., Déclais A.C., Alpi A., Lilley D.M., Ahmed S., Gartner A. The Caenorhabditis elegans homolog of Gen1/Yen1 resolvases links DNA damage signaling to DNA double-strand break repair. PLoS Genet. 2010;6:e1001025. - PMC - PubMed
    1. Bakker S.T., de Winter J.P., te Riele H. Learning from a paradox: recent insights into Fanconi anaemia through studying mouse models. Dis. Model. Mech. 2013;6:40–47. - PMC - PubMed

Publication types

MeSH terms