Review
. 2013 Sep 27;65(4):1257-317.
doi: 10.1124/pr.112.007138. Print 2013.

Mu opioids and their receptors: evolution of a concept

Affiliations
Review

Mu opioids and their receptors: evolution of a concept

Gavril W Pasternak et al. Pharmacol Rev. .

Abstract

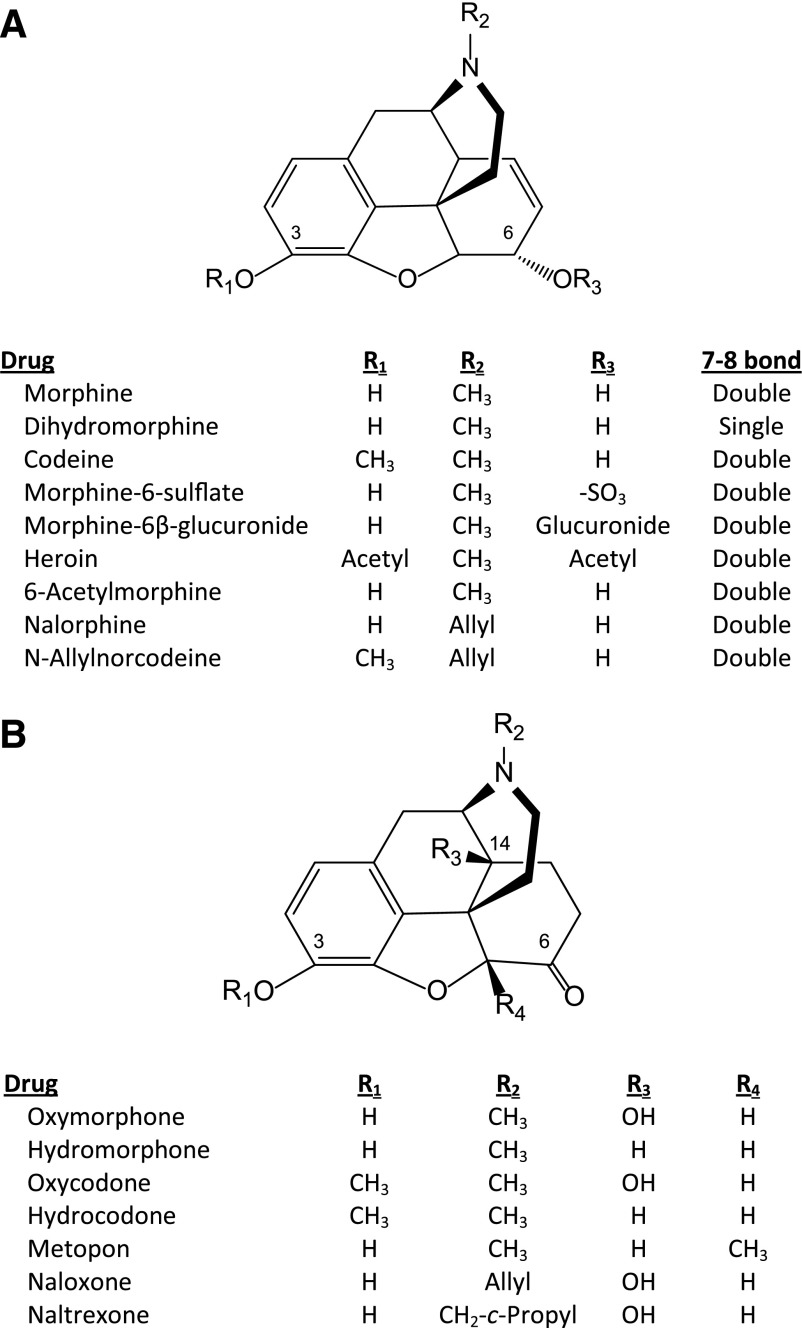
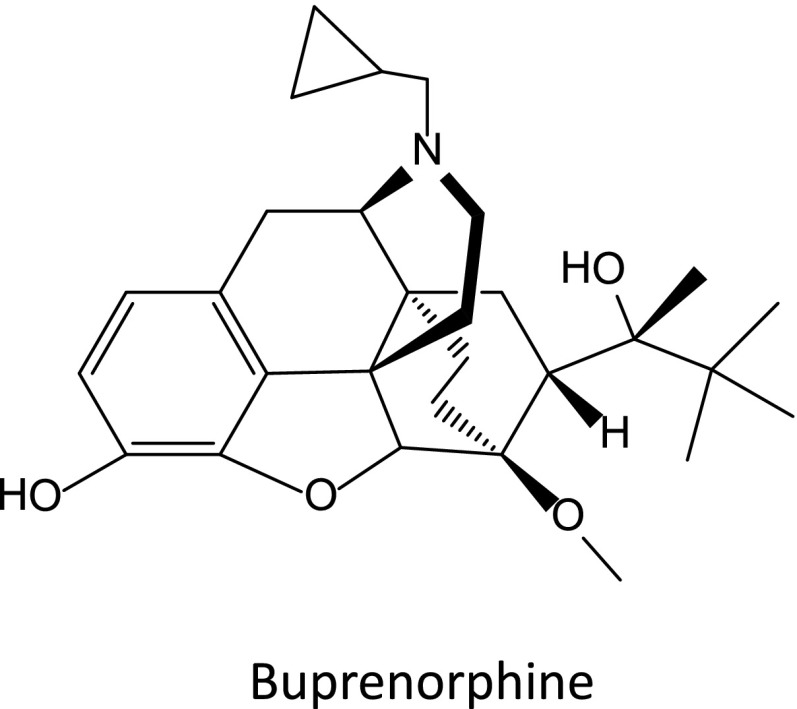
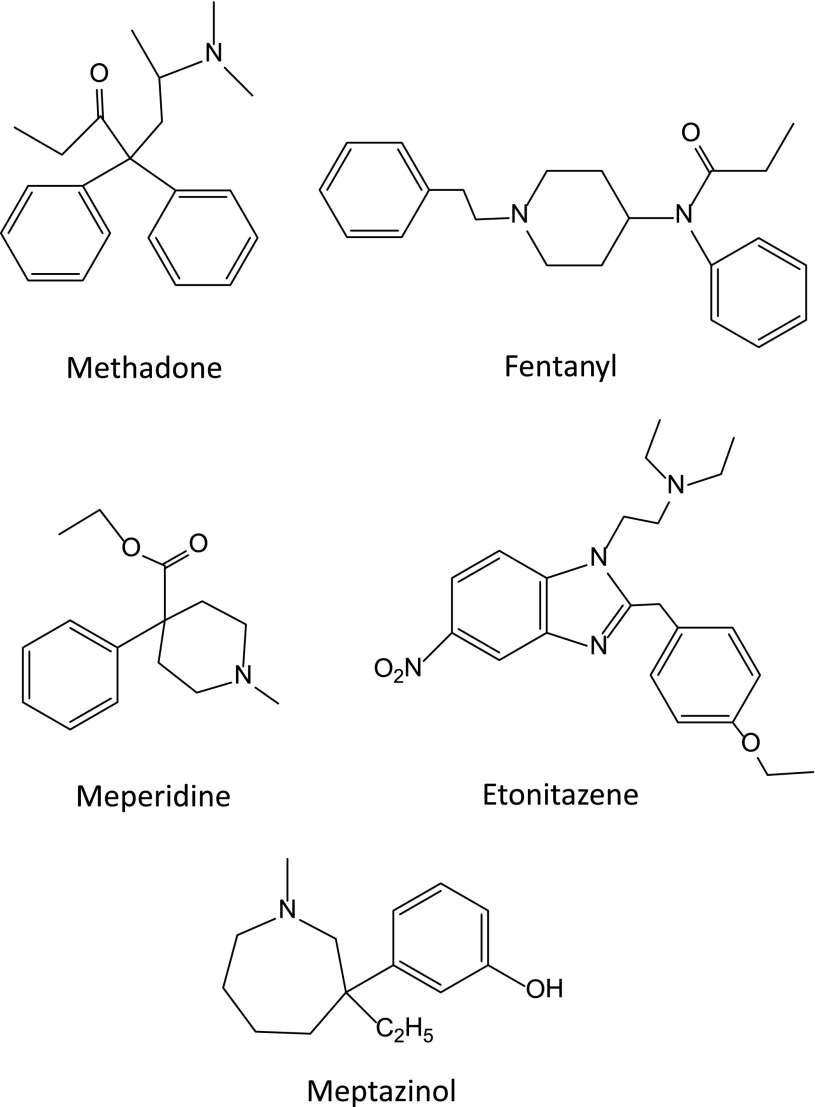
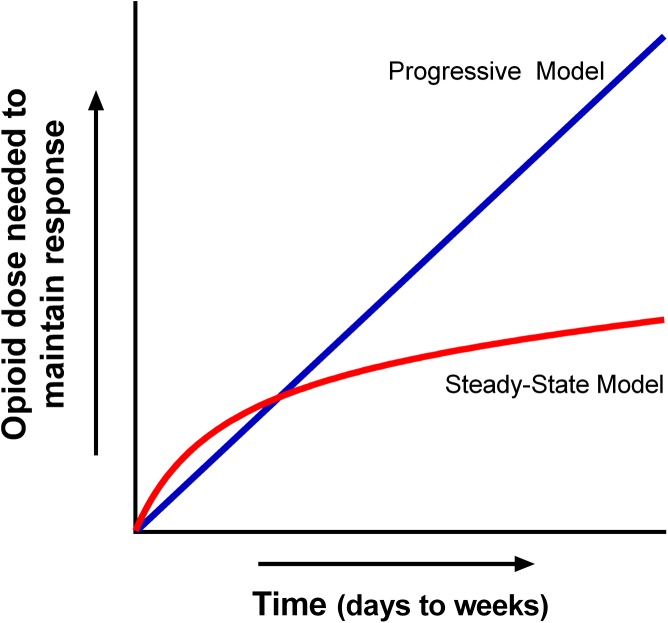
Opiates are among the oldest medications available to manage a number of medical problems. Although pain is the current focus, early use initially focused upon the treatment of dysentery. Opium contains high concentrations of both morphine and codeine, along with thebaine, which is used in the synthesis of a number of semisynthetic opioid analgesics. Thus, it is not surprising that new agents were initially based upon the morphine scaffold. The concept of multiple opioid receptors was first suggested almost 50 years ago (Martin, 1967), opening the possibility of new classes of drugs, but the morphine-like agents have remained the mainstay in the medical management of pain. Termed mu, our understanding of these morphine-like agents and their receptors has undergone an evolution in thinking over the past 35 years. Early pharmacological studies identified three major classes of receptors, helped by the discovery of endogenous opioid peptides and receptor subtypes-primarily through the synthesis of novel agents. These chemical biologic approaches were then eclipsed by the molecular biology revolution, which now reveals a complexity of the morphine-like agents and their receptors that had not been previously appreciated.


Figures

Fig. 1.
Fig. 1.
Selected 4,5α-epoxymorphinan compounds.
Fig. 2.
Fig. 2.
Selective opioid antagonists.
Fig. 3.
Fig. 3.
Morphinan.
Fig. 4.
Fig. 4.
Ketocyclazocine.
Fig. 5.
Fig. 5.
Buprenorphine.
Fig. 6.
Fig. 6.
Other opioid structures.
Fig. 7.
Fig. 7.
Neuroscience Research Program Meeting. Photograph of the attendees at the Neuroscience Research Program meeting in Boston, MA, May 19–21, 1974. Seated (left to right): Gavril W. Pasternak, William Bunney, John Hughes, Hans Kosterlitz, Steven Matthysse, Francis O. Schmitt, Solomon H. Snyder, Avram Goldstein, E. Leong Way, Vincent P. Dole, and Aki Takemori. Middle row (left to right): L. Everett Johnson, Frederic G. Worden, Robert D. Hall, Candace D. Pert, Yvonne M. Homsy, Parvati Dev, Huda Akil, Floyd E. Bloom, Agu Pert, Peter A. Mansky, William H. Sweet, Albert Herz, William R. Martin, and Harriet Schwenk. Top row (left to right): Ian Creese, David J. Mayer, Eric J. Simon, Leslie Iversen, Diana Schneider, Pedro Cuatrecasas, Horace Loh, Arnold J. Mandell, Arthur E. Jacobson, Jose M. Musacchio, and Lars Terenius. From Snyder and Matthysse (1975).
Fig. 8.
Fig. 8.
Two hypothetical models of opioid tolerance. In the Progressive Model tolerance continues to increase over the full duration of the drug administration. In the Steady-state Model, tolerance increases, but reaches a steady state that can be maintained over long periods of time. Adapted from Pasternak (2007).
Fig. 9.
Fig. 9.
Opioid analgesia in CXBK mice. With use of the radiant heat tailflick assay, the indicated opiates were given at equianalgesic doses to either CD-1 or CXBK mice, and the responses were determined. Adapted from the literature (Rossi et al., 1996; Chang et al., 1998).
Fig. 10.
Fig. 10.
Phylogency of mu-opioid receptors. Overview of the species variations in MOR-1. (A) Schematic of species. (B) Comparison of exons 4, 7, 11 in mammals. From Pan and Pasternak (2011).
Fig. 11.
Fig. 11.
Crystal structure of MOR-1. The crystal structure of MOR-1 was determined with β-funaltrexamine covalently attached within the binding pocket. (A) Side view of the crystal structure of MOR-1 with β-funaltrexamine docked within the binding pocket. Note that the binding pocket involves TM3, TM5, TM6, and TM7 and that the C and N termini have been truncated. (B) View from extracellular side (top) and form the intracellular side (bottom). Reprinted by permission from Macmillan Publishers Ltd: [Manglik A, Kruse AC, Kobilka TS, Thian FS, Mathiesen JM, Sunahara RK, Pardo L, Weis WI, Kobilka BK, and Granier S (2012) Crystal structure of the µ-opioid receptor bound to a morphinan antagonist. Nature 485:321–326].
Fig. 12.
Fig. 12.
Crystal structure of the binding pocket of MOR-1 with β-funaltrexamine. The crystal structure of MOR-1 was determined with β-funaltrexamine covalently attached within the binding pocket. The left is a side view of the structure with a “transection” of the receptor to show the docking of the ligand. The view on the right is looking at the docking of the ligand from the extracellular surface. Reprinted by permission from Macmillan Publishers Ltd: [Manglik A, Kruse AC, Kobilka TS, Thian FS, Mathiesen JM, Sunahara RK, Pardo L, Weis WI, Kobilka BK, and Granier S (2012) Crystal structure of the µ-opioid receptor bound to a morphinan antagonist. Nature 485:321–326].
Fig. 13.
Fig. 13.
Crystallization of MOR-1 dimers. Schematic showing the dimerization structure of MOR-1. The formation of homodimers involves interactions between TM5 and TM6. Oligomerization forms from interactions of the homodimers through TM1, TM2, and helix 8. Reprinted by permission from Macmillan Publishers Ltd: [Manglik A, Kruse AC, Kobilka TS, Thian FS, Mathiesen JM, Sunahara RK, Pardo L, Weis WI, Kobilka BK, and Granier S (2012) Crystal structure of the µ-opioid receptor bound to a morphinan antagonist. Nature 485:321–326].
Fig. 14.
Fig. 14.
Amino acid sequence of MOR-1 in mice, rats, and humans. The predicted amino acid sequences of MOR-1 in mice, rats, and humans are shown. The transmembrane domains are shown by the underlined regions. The exon junctions are also indicated. The consensus sequences are shown below the individual species.
Fig. 15.
Fig. 15.
Schematic of human, mouse and rat OPRM1. A schematic representation of the OPRM1 gene in humans, mice, and rats is shown. The exon and intron distances are not drawn to scale. Exons and introns are shown as boxes and horizontal lines, respectively. Intron sizes are indicated as kilobases (kb). The exon and intron distances are not drawn to scale. Promoters are indicated by arrows. Exons are numbered based upon the published data (Pan and Pasternak, 2011).
Fig. 16.
Fig. 16.
Schematic of MOR-1 splicing in the mouse. A composite schematic of the various splice variants of mMOR-1 reported in the literature is shown (Pan and Pasternak, 2011). Variants are grouped as full length, 7TM, 6TM, and 1TM with the predicted structure shown to the right and the exons color coded to match the splicing schematic. Predicted protein sequences for the spliced sequences for the variant are documented in Tables 13–15. The exon composition of mMOR-1Eii, mMOR-1Eiii and mMOR-1Eiv is identical to that of mMOR-1E, except for an insertion of exon 19 between exons 7 and 8. Their predicted protein sequences, however, are identical to mMOR-1E due to termination of translation in exon 6. Only partial sequences were reported for mMOR-1Eii and mMOR-1Vi (Doyle et al., 2007b).
Fig. 17.
Fig. 17.
Schematic of MOR-1 splicing in the rat. A composite schematic of the various splice variants of rMOR-1 reported in the literature is shown. Variants are grouped as full length, 7TM, 6TM, and 1TM with the predicted structure shown to the right and the exons color coded to match the splicing schematic. Predicted protein sequences for the spliced sequences for the variant are documented in Tables 13–15.
Fig. 18.
Fig. 18.
Schematic of MOR-1 splicing in humans. A composite schematic of the various splice variants of hMOR-1 reported in the literature is shown. Variants are grouped as full length, 7TM, 6TM, and 1TM with the predicted structure shown to the right and the exons color coded to match the splicing schematic. Predicted protein sequences for the spliced sequences for the variant are documented in Tables 13–15.
Fig. 19.
Fig. 19.
Schematic of the OPRM1 gene promoters in mice. Exons 11 and 1 are indicated by black boxes. The 5′-flanking regions and defined promoter regions are shown by lines. Transcription start points (tsp) and translation start codon (ATG) are indicated by arrows. Cis-acting elements that bind to corresponding trans-acting factors are shown by boxes of various shapes/colors along the promoter regions. TATA, TATA-binding protein; AP-1, activator protein 1; AP-2, activator protein 2; CCAAT, CCAAT box binding factors; C/EBP, CCAAT/enhancer-binding proteins; cMyc/Max, cMyc and Max factors; NRSE, neurorestrictive silencer element; Oct-1, octamer-1; Sp1, specificity protein 1; Sp3, specificity protein 3; CRE, cyclic adenosine monophosphate (cAMP) response element binding protein; 34 bp, 34-bp element; Sox, Sry-like high-mobility-group box gene; PARP1, poly(ADP-ribose polymerase 1; PCBP, polyC-binding protein; STAT1, signal transducers and activators of transcription type 1.
Fig. 20.
Fig. 20.
Regional mRNA splice variants. The regional distribution of the indicated splice variants was determined using RT-PCR, with β2-microglobulin as an internal control. Adapted from Pan et al. (1999, 2001).
Fig. 21.
Fig. 21.
Opiate analgesia in an exon 1 MOR-1 knockout mouse. With use of the radiant heat tailflick assay, dose-response curves were carried out in wild-type and exon 1 MOR-1 knockout mouse with the indicated opiate. Adapted from Schuller et al. (1999).
Fig. 22.
Fig. 22.
Structure of IBNtxA.
Fig. 23.
Fig. 23.
In vivo pharmacology of IBNtxA. (A) IBNtxA analgesia was assessed in wild-type (WT) or triple knockout (KO) mice with a disruption of exon 1 in MOR-1, DOR-1, and KOR-1. ED50 values: WT 0.22 mg/kg (0.13, 0.32); Triple KO 0.39 mg/kg (0.15, 0.58). (B) Analgesia was assessed with a fixed dose of IBNtxA (0.5 mg/kg) in wild-type, triple knockout (see above) and exon 11 knockout mice. (C) Respiratory rates were determined following saline or either IBNtxA (2.5 mg/kg) or morphine (20 mg/kg) at doses 5-fold greater than their analgesic ED50. (D) Conditioned place preference was carried out with saline, IBNtxA, or morphine in a 2-compartment. In contrast to morphine, IBNtxA did not produce place preference. Adapted from Majumdar et al. (2011).
Fig. 24.
Fig. 24.
[125I]BNtxA binding. (A) Saturation studies were carried out with [125I]BNtxA mouse brain membranes from either wild-type mice with blockers or triple KO mice. (B) [125I]BNtxA binding was determined in E1, E11, or E2 MOR-1 KO mice in the presence of mu (CTAP), kappa1, U50,488H (kappa1), or delta (DPDPE) blockers, whereas the triple KO mice were assayed without blockers. Adapted from Majumdar et al. (2011).

References

    1. Abbadie C, Gultekin SH, Pasternak GW. (2000a) Immunohistochemical localization of the carboxy terminus of the novel mu opioid receptor splice variant MOR-1C within the human spinal cord. Neuroreport 11:1953–1957 - PubMed
    1. Abbadie C, Pan Y-X, Drake CT, Pasternak GW. (2000b) Comparative immunohistochemical distributions of carboxy terminus epitopes from the mu-opioid receptor splice variants MOR-1D, MOR-1 and MOR-1C in the mouse and rat CNS. Neuroscience 100:141–153 - PubMed
    1. Abbadie C, Pan Y-X, Pasternak GW. (2000c) Differential distribution in rat brain of mu opioid receptor carboxy terminal splice variants MOR-1C-like and MOR-1-like immunoreactivity: evidence for region-specific processing. J Comp Neurol 419:244–256 - PubMed
    1. Abbadie C, Pan Y-X, Pasternak GW. (2004) Immunohistochemical study of the expression of exon11-containing mu opioid receptor variants in mouse brain. Neuroscience 127:419–430 - PubMed
    1. Abbadie C, Pasternak GW. (2001) Differential in vivo internalization of MOR-1 and MOR-1C by morphine. Neuroreport 12:3069–3072 - PubMed

Publication types