. 2013 Nov;14(11):1173-82.
doi: 10.1038/ni.2714. Epub 2013 Sep 29.

Hypoxia-inducible factors enhance the effector responses of CD8(+) T cells to persistent antigen

Affiliations

Hypoxia-inducible factors enhance the effector responses of CD8(+) T cells to persistent antigen

Andrew L Doedens et al. Nat Immunol. 2013 Nov.

Abstract

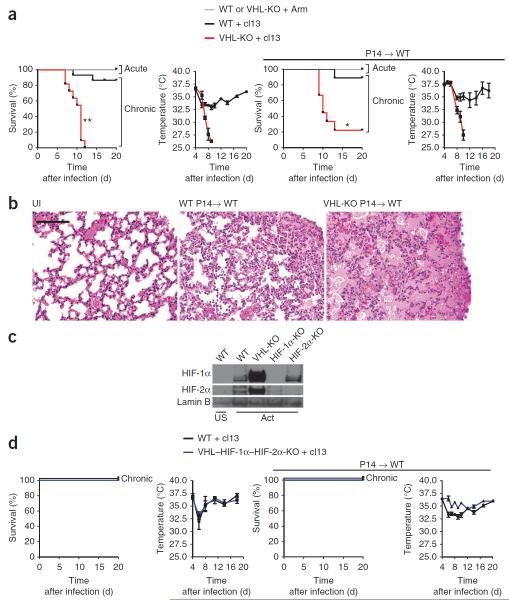
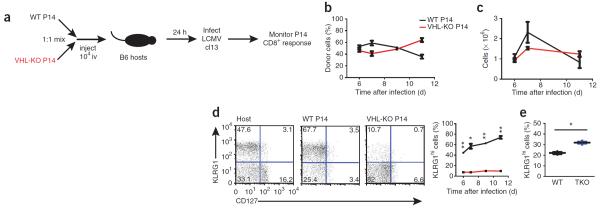
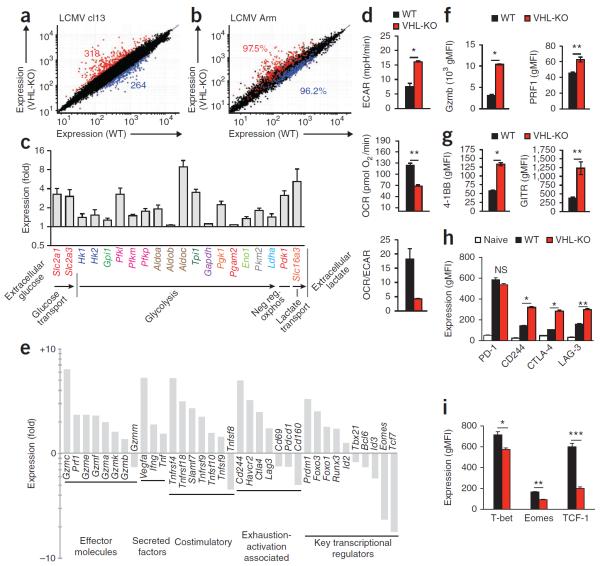
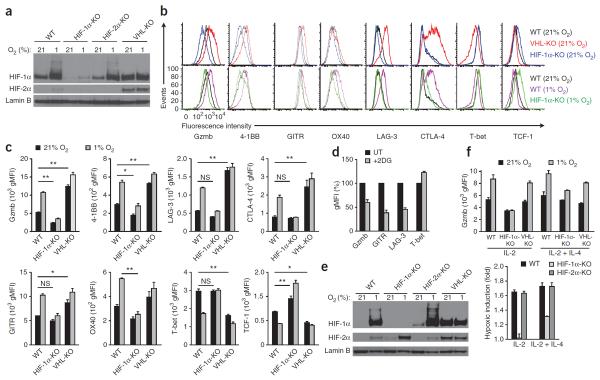
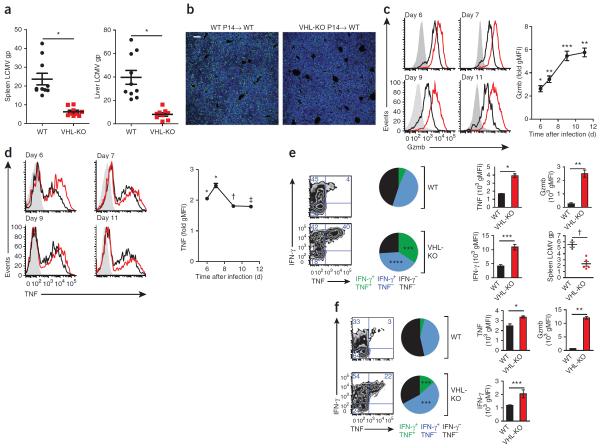
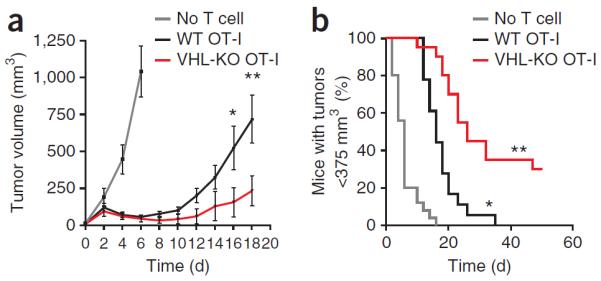
Cytolytic activity by CD8(+) cytotoxic T lymphocytes (CTLs) is a powerful strategy for the elimination of intracellular pathogens and tumor cells. The destructive capacity of CTLs is progressively dampened during chronic infection, yet the environmental cues and molecular pathways that influence immunological 'exhaustion' remain unclear. Here we found that CTL immunity was regulated by the central transcriptional response to hypoxia, which is controlled in part by hypoxia-inducible factors (HIFs) and the von Hippel-Lindau tumor suppressor VHL. Loss of VHL, the main negative regulator of HIFs, led to lethal CTL-mediated immunopathology during chronic infection, and VHL-deficient CTLs displayed enhanced control of persistent viral infection and neoplastic growth. We found that HIFs and oxygen influenced the expression of pivotal transcription, effector and costimulatory-inhibitory molecules of CTLs, which was relevant to strategies that promote the clearance of viruses and tumors.


Figures

Figure 1
Figure 1
VHL-deficient CD8+ T cells mediate HIF-1α–HIF-2α–dependent death during persistent viral infection. (a) Survival of wild-type (Vhlfl/fl) mice (WT) or VHL-deficient (Vhlfl/fldLck) mice (VHL-KO) after acute infection with LCMV Armstrong (+ Arm) or chronic infection with LCMV clone 13 (+ cl13) (far left) and core body temperature of those mice after chronic infection with LCMV clone 13 (middle left), as well as survival (middle right) and core body temperature (far right) of wild-type host mice given ~1 × 10⁴ VHL-sufficient (WT) or VHL-deficient (VHL-KO) P14 CD8+ T cells (P14→WT), then infected 1 d later as at left. Pooled sample size (host mice): survival (left), n = 15 (wild type) or 11 (VHL-deficient); survival (right), n = 9 (wild-type cells) or 9 (VHL-deficient cells); body temperature, n ≥ 3 per time point. *P =0.003 and **P < 0.001, wild-type versus mutant during chronic infection (log-rank (Mantel-Cox) test). (b) Perimortal lung pathology in wild-type host mice (n = 4) given no cells and left uninfected (UI) or given 1 × 10⁴ VHL-sufficient P14 CD8+ T cells (WT P14→WT) or VHL-deficient P14 CD8+ T cells (VHL-KO P14→WT), then infected 1 d later with LCMV clone 13 and assessed 9 d later. Scale bar, 100 μm. (c) Immunoblot analysis of HIF-1α, HIF-2α and lamin B (loading control throughout) in nuclear extracts of purified wild-type, VHL-deficient (VHL-KO), Hif1afl/flCd4-Cre (HIF-1α-KO) or Epas1fl/flTie2-Cre (HIF-2α-KO) CD8+ T cells left unstimulated (US) or activated for 55 h in vitro with anti-CD3 plus anti-CD28. (d) Survival and core body temperature as in a, but with wild-type and VHL–HIF-1α–HIF-2α-deficient (VHL–HIF-1α–HIF-2α-KO) mice (left) or in wild-type hosts after transfer of wild-type P14 or VHL–HIF-1α–HIF-2α-deficient P14 cells (P14WT; right). Pooled sample size (mice): survival (left), n = 3 (wild type) or 3 (VHL–HIF-1α–HIF-2α-deficient); survival (right), n = 5 (wild-type cells) or 8 (VHL–HIF-1α–HIF-2α-deficient cells); body temperature, n ≥ 3 mice per time point. Data are pooled from three experiments (a,d; error bars, s.e.m.) or are representative of two experiments (b,c).
Figure 2
Figure 2
Increased HIF-1α and HIF-2α activity alters CD8+ T cell differentiation during persistent infection. (a) Experimental protocol for bd: congenically distinct VHL-sufficient P14 CD8+ T cells (WT P14) and VHL-deficient P14 CD8+ T cells (VHL-KO P14) were injected intravenously (iv) together (1 × 10⁴ of each cell type, mixed at a ratio of 1:1) into wild-type B6 hosts (n = 3), followed by infection of the hosts 24 h later with LCMV clone 13. (b) Abundance of transferred VHL-sufficient and VHL-deficient donor cells in the peripheral blood of host mice. (c) Absolute number of VHL-sufficient and VHL-deficient P14 CD8+ T cells recovered from spleen of host mice. (d) Expression of CD127 and KLRG1 by host CD8+ T cells (Host) and by VHL-sufficient or VHL-deficient P14 donor CD8+ cells on day 7 of infection, assessed by flow cytometry (left), and frequency of KLRG1hi donor cells in host mice (right). Numbers in quadrants (left) indicate percent cells in each. *P = 0.0004 and **P < 0.0001 (unpaired Student's t-test). (e) Frequency of KLRG1hi donor cells in hosts given cotransfer of VHL–HIF-1α–HIF-2α-sufficient (WT) and VHL–HIF-1α–HIF-2α-deficient (TKO) P14 CD8+ T cells, followed by infection with LCMV clone 13 (as in a) and analysis 7 d later. Each symbol represents an individual mouse; small horizontal lines indicate the mean. *P = 0.002 (unpaired Student's t-test). Data are representative of three experiments with similar results (error bars, s.e.m.).
Figure 3
Figure 3
Gene expression by VHL-deficient CTLs reveals an augmented effector phenotype with increased glycolysis, activation-associated receptors and alterations of key transcription factors. (a,b) Microarray analysis of gene expression (mean) by KLRG1lo VHL-sufficient (WT) or VHL-deficient (VHL-KO) P14 CD8+ T cells sorted from a host mouse (n = 2) after cotransfer (as in Fig. 2a), assessed on day 7 of infection of the recipient with LCMV clone 13 (a) or on day 6 of acute infection of the recipient with LCMV Armstrong (b); numbers in plots indicate total genes upregulated (red) or downregulated (blue) in VHL-deficient cells relative to their expression in wild-type cells (a; with a cutoff of a twofold change in expression, and coefficient of variation of 0.8) or frequency of genes regulated as in a (b). (c) Expression of transcripts involved in the glycolytic pathway and negative regulation of oxidative phosphorylation (Neg reg oxphos) in VHL-deficient cells relative to their expression in VHL-sufficient cells, both sorted from a host mouse (after cotransfer) on day 7 of infection with LCMV clone 13 (as in a). (d) Proton production (ECAR), oxygen consumption (OCR) and OCR/ECAR ratio of wild-type and VHL-deficient CD8+ T cells (n = 4 mice per genotype) activated with anti- CD3 and anti-CD28 and then incubated with IL-2 in vitro. *P = 0.0005 and **P < 0.0001 (Student's unpaired t-test). (e) Expression of transcripts involved in various pathways (below plot) in VHL-deficient cells relative to their expression in VHL-sufficient cells, both sorted from a host mouse (after cotransfer) on day 7 of infection with LCMV clone 13 (as in a). (fh) Expression of granzyme B and perforin (f), 4-1BB and GITR (g), and PD-1, CD244, CTLA-4 and LAG-3 (h) by KLRG1lo VHL-deficient and VHL-sufficient P14 cells from host mice (n = 3) on day 6 of infection with LCMV clone 13, assessed by flow cytometry and presented as geometric mean fluorescence intensity (gMFI); Naive (h), naive (CD44lo) wild-type CD8+ T cells from the same host. *P < 0.0001 and **P = 0.008 (f), *P < 0.0001 and **P = 0.002 (g) and *P < 0.0001 and **P = 0.0003 (h) (all unpaired Student's t-test). (i) Expression of transcription factors by P14 CD8+ T cells after cotransfer into host mice (n = 3) and infection of the hosts for 7 d with LCMV clone 13 as in a, assessed by intracellular immunostaining followed by flow cytometry with gating on KLRG1lo cells. *P = 0.02, **P < 0.0001 and ***P = 0.002 (unpaired Student's t-test). Data are from one experiment (ac,e; error bars (c), range) or are representative of three experiments (d,fi; error bars, mean and s.e.m.).
Figure 4
Figure 4
Oxygen, HIF-1α and HIF-2α regulate essential effector, activation-inhibitory and differentiation-associated proteins of T cells. (a) Immunoblot analysis of HIF-1α, HIF-2α and lamin B in nuclear extracts of wild-type, Hif1afl/flCd4-Cre, Epas1fl/flTie2-Cre and VHL-deficient CD8+ T cells activated in vitro with anti-CD3 plus anti-CD28, followed by population expansion for 96 h in IL-2 and incubation for 6 h in normoxia (ambient air; ~21% O2) or hypoxia (1% oxygen). (b) Flow cytometry of cell-surface or intracellular proteins in wild-type, Hif1afl/flCd4-Cre and VHL-deficient cell populations activated and expanded as in a, followed by 36 h (Gzmb, LAG-3, T-bet and TCF-1) or 12 h (4-1BB, GITR and OX40) of normoxic or hypoxic incubation (as in a). (c) Geometric mean fluorescence intensity of the results in b (n = 3 mice per genotype). *P < 0.01 and **P < 0.001 (two-way analysis of variance with Bonferroni's post-hoc test). (d) Expression of Gzmb, GITR, LAG-3 and T-bet in wild-type CD8+ splenocyte populations (n = 3 mice) activated and expanded as in a, then incubated for 48 h in 1% oxygen with 1 mM 2-deoxy-d-glucose (+2DG), presented relative to that of cells not treated with 2-deoxy-d-glucose (UT), set as 100%. (e) Immunoblot analysis of nuclear extracts of CD8+ T cells activated as in a, followed by incubation with IL-2 and IL-4 for population expansion and then culture for 17 h in normoxia or hypoxia. (f) Expression of granzyme B in cells (n = 3 mice per genotype) activated as in a, followed by incubation for 24 h in IL-2 alone or IL-2 plus IL-4, with or without hypoxia (top), and induction of granzyme B expression during hypoxia relative to its expression during normoxia (bottom). Data are representative of three experiments (a, and b,c (Gzmb, LAG-3, T-bet and TCF-1)) or two experiments (b,c (4-1BB, GITR and OX40) and d; mean and s.e.m. in c; error bars (d), s.e.m.) or three experiments with similar results (e,f; error bars, s.e.m.).
Figure 5
Figure 5
CD8+ T cells with enhanced HIF activity sustain expression of effector molecules, are refractory to exhaustion and demonstrate superior control of persistent viral infection. (a) Quantitative PCR analysis of the abundance of mRNA encoding LCMV glycoprotein (LCMV gp) in spleen and liver tissue from wild-type B6 hosts given transfer of 1 × 10⁴ VHL-sufficient or VHL-deficient P14 CD8+ T cells, followed by infection with LCMV clone 13 and analysis 7 d later, presented relative to that of control mRNA encoding HPRT. Sample size: n = 10 (host mice given VHL-sufficient P14 cells) or 9 (host mice given VHL-deficient P14 cells). Each symbol represents an individual mouse; small horizontal lines indicate the mean (± s.e.m.). *P < 0.0001 (unpaired Student's t-test). (b) Immunofluorescence microscopy of LCMV antigen (green) and the DNA-intercalating dye DAPI (blue) in liver sections after transfer and infection as in a (n = 5 host mice per cell genotype). Scale bar, 100 μm. (c,d) Expression of granzyme B (c) and TNF (d) in B6 hosts (n = 3) given cotransfer of VHL-sufficient and VHL-deficient P14 CD8+ T cells (1 × 10⁴ cells of each genotype), followed by infection with LCMV clone 13 and analysis on days 6–11 of infection immediately after isolation (c) or after 5–6 h of in vitro culture with a LCMV glycoprotein peptide of amino acids 33–41 (d), assessed by flow cytometry (left) and presented as average gMFI in VHL-deficient cells relative to that in VHL-sufficient cells (right). *P < 0.0001, **P = 0.0003, ***P = 0.002, †P = 0.03 and ‡P = 0.007 (unpaired Student's t-test). (e) Expression of IFN-γ and TNF in cells from B6 hosts given transfer of VHL-sufficient or VHL-deficient P14 CD8+ T cells, followed by infection with LCMV clone 13 and analysis 21 d later (far left) and frequency of cells producing IFN-γ and/or TNF (middle left); expression of IFN-γ and TNF in donor P14 cells obtained from the spleens of surviving host mice and stimulated in vitro with a peptide of LCMV glycoprotein (as above; middle right); and expression of granzyme B (top, far right) and abundance of viral RNA in the spleen (bottom, far right). Sample size (host mice): n = 3 (VHL-sufficient cells) or 5 (VHL-deficient cells). *P = 0.0004, **P = 0.0007, ***P = 0.003 and †P = 0.02 (unpaired Student's t-test). (f) Expression of IFN-γ and TNF in P14 donor cells from B6 hosts (n = 3) given cotransfer of VHL-sufficient and VHL-deficient P14 CD8+ T cells, followed by infection with LCMV clone 13 and analysis 17 d later (far left) and frequency of donor P14 cells producing IFN-γ and/or TNF (middle left); expression of IFN-γ and TNF in donor P14 cells obtained from surviving host mice and stimulated as in e (middle right); and expression of granzyme B in cells immediately after isolation (top, far right). *P = 0.02, **P < 0.0001 and ***P = 0.05 (unpaired Student's t-test). Data are representative of three experiments (a,c,d) or two experiments (b,e,f; error bars (cf), s.e.m.).
Figure 6
Figure 6
VHL-deficient CTLs exhibit enhanced control of experimental melanoma. Tumor volume (a) and frequency of mice with a tumor volume of <375 mm3 (b) among mice given subcutaneous injection of 1 × 10⁶ ovalbumin-expressing B16 melanoma cells, followed 7 d later by intravenous adoptive transfer of no T cells or ovalbumin peptide–activated VHL-sufficient or VHL-deficient OT-I CD8+ T cells (3 × 10⁶). (a) *P = 0.04 and **P = 0.01, VHL-sufficient versus VHL-deficient (unpaired Student's t-test). (b) *P < 0.0001, no T cells versus VHL-sufficient T cells, and **P = 0.0001, VHL-sufficient versus VHL-deficient (log-rank (Mantel-Cox) test). Sample size (host mice): n = 25 (no T cell transfer), 19 (VHL-sufficient) or 20 (VHL-deficient). Data are representative of two independent experiments (error bars, s.e.m.).

Comment in

  • Bypassing T cell 'exhaustion'.
    Göthert JR. Göthert JR. Nat Immunol. 2013 Nov;14(11):1114-6. doi: 10.1038/ni.2742. Nat Immunol. 2013. PMID: 24145784 No abstract available.

References

    1. Via LE, et al. Tuberculous granulomas are hypoxic in guinea pigs, rabbits, and nonhuman primates. Infect. Immun. 2008;76:2333–2340. - PMC - PubMed
    1. Vaupel P. Hypoxia in neoplastic tissue. Microvasc. Res. 1977;13:399–408. - PubMed
    1. Eltzschig HK, Carmeliet P. Hypoxia and inflammation. N. Engl. J. Med. 2011;364:656–665. - PMC - PubMed
    1. Rankin EB, Giaccia AJ. The role of hypoxia-inducible factors in tumorigenesis. Cell Death Differ. 2008;15:678–685. - PMC - PubMed
    1. Latif F, et al. Identification of the von Hippel-Lindau disease tumor suppressor gene. Science. 1993;260:1317–1320. - PubMed

Publication types

MeSH terms

Substances

Associated data