. 2013 Oct;8(10):755-62.
doi: 10.1038/nnano.2013.189. Epub 2013 Sep 29.

Programmable chemical controllers made from DNA

Affiliations

Programmable chemical controllers made from DNA

Yuan-Jyue Chen et al. Nat Nanotechnol. 2013 Oct.

Abstract

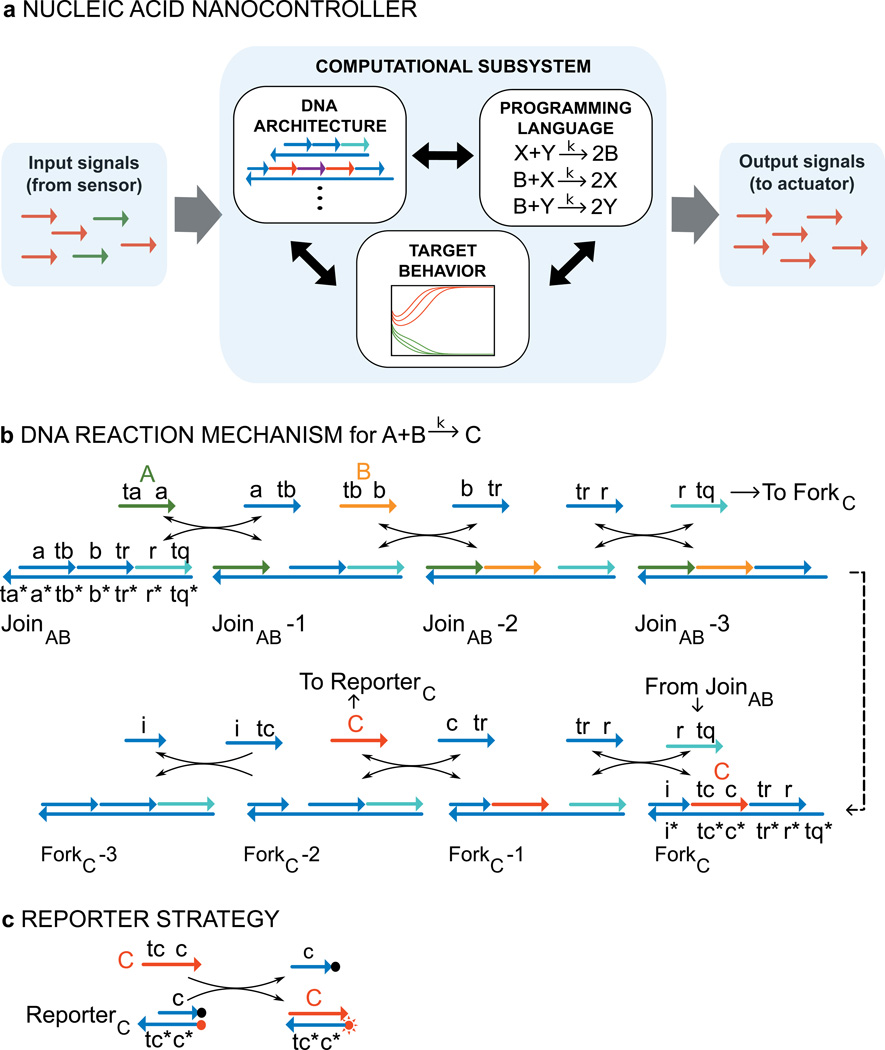
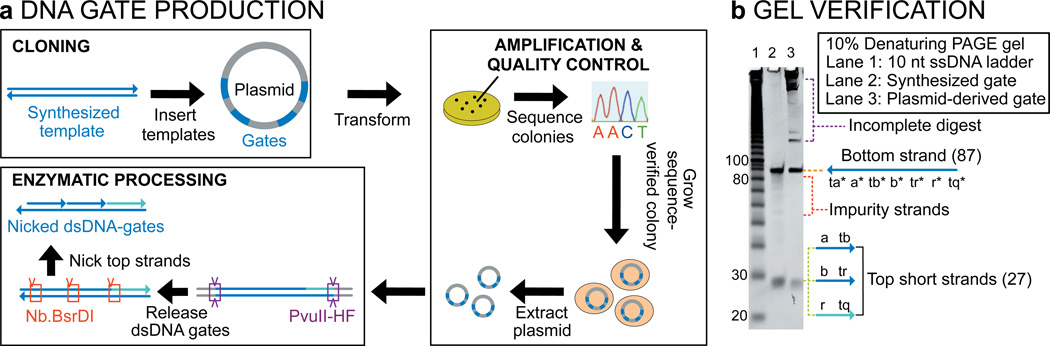
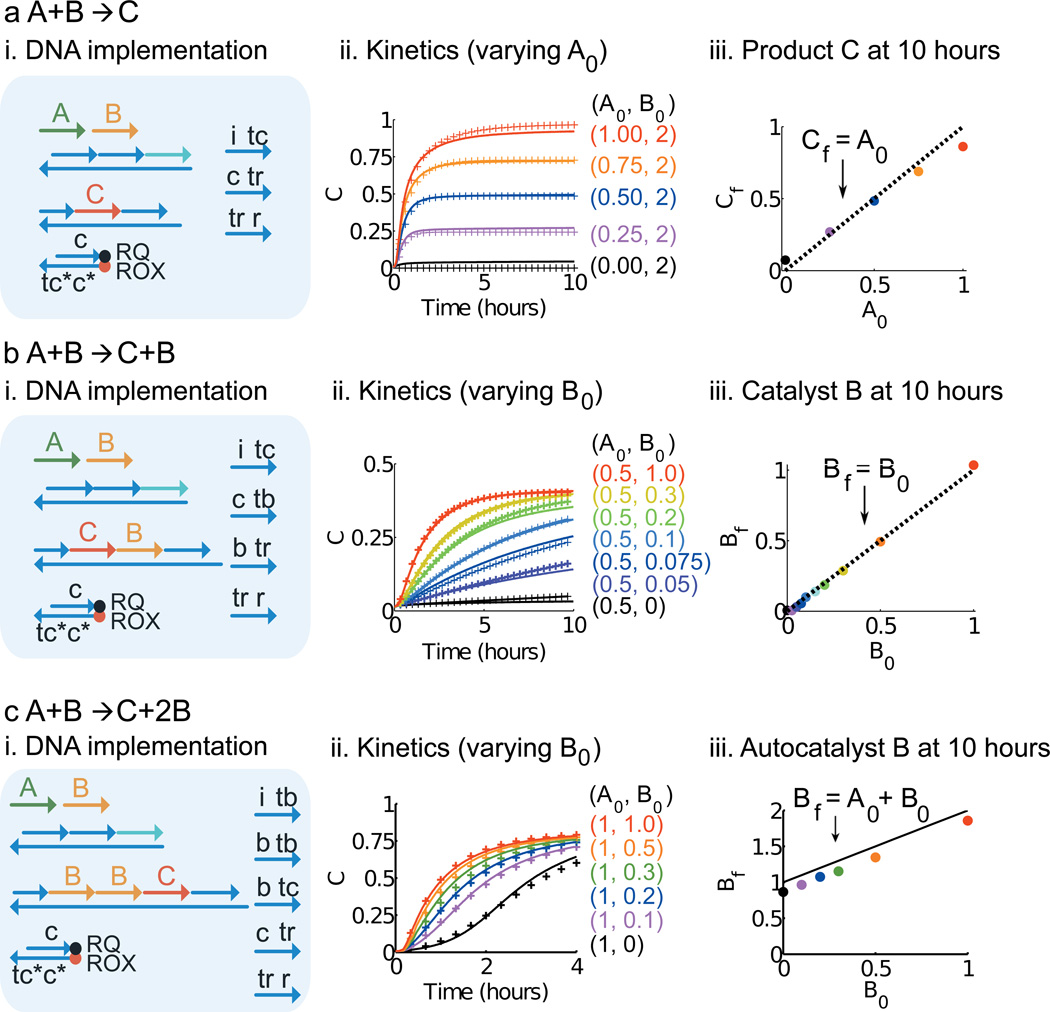
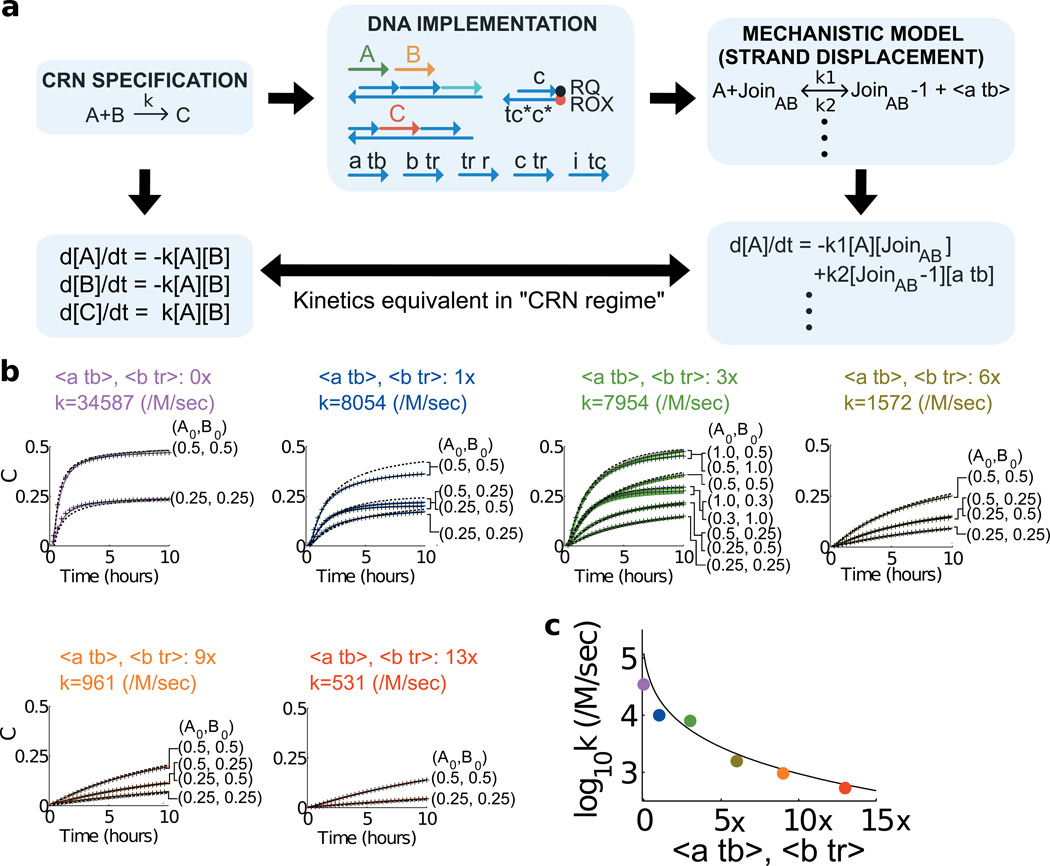
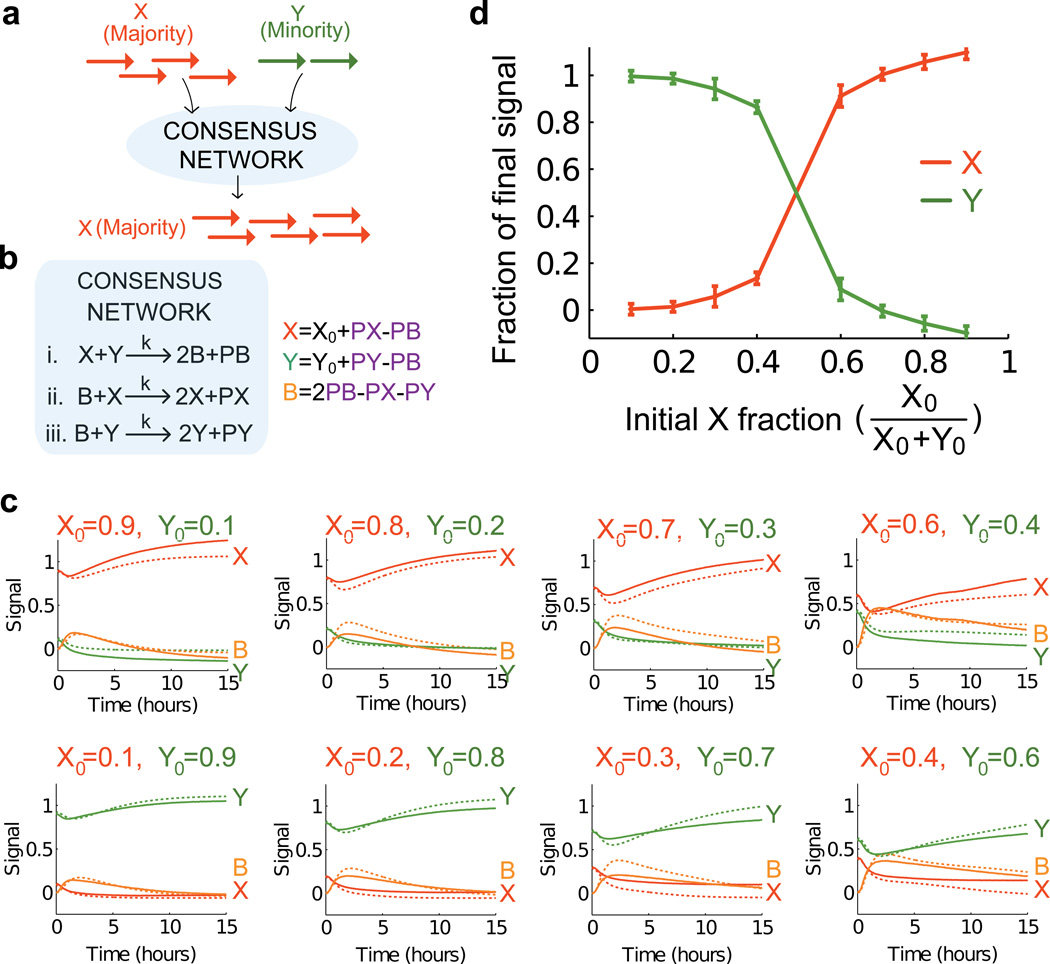
Biological organisms use complex molecular networks to navigate their environment and regulate their internal state. The development of synthetic systems with similar capabilities could lead to applications such as smart therapeutics or fabrication methods based on self-organization. To achieve this, molecular control circuits need to be engineered to perform integrated sensing, computation and actuation. Here we report a DNA-based technology for implementing the computational core of such controllers. We use the formalism of chemical reaction networks as a 'programming language' and our DNA architecture can, in principle, implement any behaviour that can be mathematically expressed as such. Unlike logic circuits, our formulation naturally allows complex signal processing of intrinsically analogue biological and chemical inputs. Controller components can be derived from biologically synthesized (plasmid) DNA, which reduces errors associated with chemically synthesized DNA. We implement several building-block reaction types and then combine them into a network that realizes, at the molecular level, an algorithm used in distributed control systems for achieving consensus between multiple agents.


Figures

Figure 1
Figure 1. DNA realization of a formal CRN
a, A standardized signalling protocol based on short single strands of DNA enables the components of the nano-controller to communicate with each other. The formalism of chemical reaction networks serves as a programming language that specifies the desired behaviour for the computational subsystem. The target behaviour is experimentally realized by the DNA architecture. b, Reaction mechanism. DNA strands are drawn as lines with arrows at the 3’ end. Functional domains are labelled with lowercase letters; “*” indicates Watson-Crick complement. Species A, B and C of the formal reaction are represented by DNA signal strands A (<ta a>, green), B (<tb b>, orange), and C (<tc c>, red), respectively. Implementation of the bimolecular reaction A+B->C requires two multi-stranded gate complexes JoinAB and ForkC as well as the auxiliary strands <tr r>, <c tr>, and <i tc>. The reaction proceeds through a sequence of six stand displacement reactions where each step provides a toehold for initiation of the next one. c, Reporting strategy for reaction kinetics used in this paper. The reporter consists of two strands, one labelled with fluorophore (red dot), the other with a quencher (black dot). Fluorescence is quenched when fluorophore and quencher are co-localized; displacement of the quencher-labelled strand by signal C leads to an increase in fluorescence proportional to the amount of C detected.
Figure 2
Figure 2. DNA gate production
a, Highly pure ndsDNA gates can be produced from plasmid DNA. Multiple copies of a double stranded ndsDNA gate template are inserted into a plasmid and transformed into E. coli cells. Clones are picked and plasmid sequence is verified. A clonal population is grown up and plasmid DNA is extracted using standard molecular techniques. Finally, the restriction enzyme PvuII-HF is used to release the gate from the plasmid, and the nicking enzyme Nb.BsrDI is used to generate nicks in the top strand. b, Analysis by 10% denaturing-PAGE of the enzymatically processed gate. Lane 1: 10 nt ladder; lane 2: Synthesized control gate; lane 3: Plasmid-derived gate. The long bottom strand (87-mer) and short top strands (27-mer) are visible on the D-gel.
Figure 3
Figure 3. Testing fundamental reaction types
Panel (i) shows a simplified representation of the gates, auxiliary strands, and signal strands used for the corresponding experiments. Experimental kinetics data are shown in panel (ii) as full coloured lines. Concentrations of the signal strands are indicated in the same colour, 1×=50nM. All join and fork gates were at 1.5×, and auxiliary strands were at 2×. Best fits of the strand displacement-level model to the data are shown as crossed lines. Panel (iii) shows data confirming the correct reaction stoichiometry. a, Non-catalytic bimolecular reaction A+B->C. Signal B was at 2× and different amounts of signal strand A were added. Panel (iii) shows that levels of (product) signal C at the measurement end point (10 hrs) are very close to the amounts of limiting inputs as expected for a stoichiometrically correct bimolecular reaction. b, Bimolecular catalytic reaction A+B->C+B. Signal A was at 0.5× and different amounts of the catalytic signal B were introduced into the system. Panel (iii) shows that the final amount of free catalyst Bf is equal to the initial amount B0. The amount of catalyst signal B at 10 hrs was measured by adding a fluorescent reporter for B. c, Autocatalytic reaction A+B->C+2B. Signal A was at 1× and the amount of signal B was varied. Panel (iii) shows that the final amount of the autocatalyst signal B is equal to the sum of the initial amounts of A and B as expected for autocatalysis. The amount of autocatalyst signal B was measured at 10 hrs by adding a fluorescent reporter for B.
Figure 4
Figure 4. Tuning the rate of the bimolecular reaction A+B->C
a, Approximating the bimolecular rate law. The CRN program is executed by a DNA architecture that can be quantitatively modelled at a mechanistic level. We view strand displacement reactions (e.g. A + JoinAB -> JoinAB−1+<a tb>, see Fig. 1b for component names) as the elementary reaction steps and the formal bimolecular reaction (e.g. A+B->C) as the complex reaction pathway decomposed into these elementary reactions. In the “CRN regime” (see text) the mechanistic model closely approximates the dynamics of the target program. The rate constant k of the formal system can be tuned by changing the concentrations of gates and auxiliary strands. b, Reactions with varying concentrations of the backward auxiliary strands <a tb> and <b tr>. The data (solid traces) show the time-evolution of C: Purple traces (0× <a tb> and <b tr>), blue (1×), green (3×), olive green (6×), orange (9×) and red (13×), 1×=40nM. Gates were at 3× and initial concentration of the signals A and B are indicated in each panel. Black dashed lines are fits to the bimolecular rate law in (a). Best-fit rate constants to the bimolecular rate law are indicated in each panel. Black crossed lines are fits to the mechanistic strand displacement-level model. c, Fitted bimolecular rate constant vs. analytic prediction. The dashed line is obtained from an analytic predication for the dependence of the expected rate constant on the concentrations of the backward auxiliary strands <a tb> and <b tr> (Eq. 8, S5). The coloured dots show the rate constants fitted to experimental data from (b).
Figure 5
Figure 5. Consensus network
a, Given arbitrary amounts of signal strands X (red) and Y (green), the consensus network converts the minority signal to the majority signal. b, The formal chemical reactions for the consensus network. Signals PX, PY, and PB were used to follow the reaction kinetics without interfering with the dynamics of X, Y, and B. Reporters for PX, PY, and PB each used a different fluorophore such that all three signals could be detected in the same reaction. The values of X, Y, and B were calculated from the measured values of PX, PY, and PB as indicated. c, Time-evolution of the signals X (red), Y (green), and B (yellow). Initial concentrations of signals X and Y are indicated in each panel, 1×=80nM. Reporters were at 3×, auxiliary strands at 2× and gates at 2× for reactions (i) and (ii). Gates and auxiliary strands for reaction (iii) B+Y->2Y were at 2.4× to balance the rates of the two autocatalytic reactions. The DNA implementation for the consensus network consisted of 3 join gates, 3 fork gates, 3 reporters, 13 auxiliary strands and 3 signal strands. No backward auxiliary strands were added to the initial reaction mixture. A graphical representation of all gates and auxiliary species is given in the SI S8.2. The kinetics data show that the minority species was converted into the buffer species B first, then into the majority species. The model prediction of the consensus network using the strand displacement-level model is shown as dashed lines. The prediction is based on a model parameterization obtained by fitting to the individual reactions (Section S8). d, Amplification levels. The end points (15 hours) of each reaction show that the DNA-based consensus network correctly amplifies the majority towards totality. Red trace: X/(X+Y) at 15 hours; green trace Y/(X+Y) at 15 hours.

Comment in

Similar articles

Cited by

References

    1. Drexler KE. Molecular engineering: An approach to the development of general capabilities for molecular manipulation. Proc. Natl. Acad. Sci. USA. 1981;78(9):5275–5278. - PMC - PubMed
    1. Koo OM, Rubinstein I, Onyuksel H. Role of nanotechnology in targeted drug delivery and imaging: a concise review. Nanomedicine: NBM. 2005;1(3):193–212. - PubMed
    1. Hess H. Engineering applications of biomolecular motors. Annu. Rev. Biomed. Eng. 2011;13:429–450. - PubMed
    1. Seeman NC. Nanomaterials based on DNA. Annu. Rev. Biochem. 2010;79:65–87. - PMC - PubMed
    1. Zhang DY, Seelig G. Dynamic DNA nanotechnology using strand-displacement reactions. Nature Chem. 2011;3(2):103–113. - PubMed

Publication types