

doi: 10.1038/nchembio.1355.
Epub 2013 Sep 29.
Mycobacterium tuberculosis nitrogen assimilation and host colonization require aspartate
Affiliations
- PMID: 24077180
- PMCID: PMC3856356
- DOI: 10.1038/nchembio.1355
Item in Clipboard
Mycobacterium tuberculosis nitrogen assimilation and host colonization require aspartate
Nat Chem Biol.
2013 Nov.
Erratum in
- Nat Chem Biol. 2014 Feb;10(2):164. Gerquin-Kern, Jean-Luc [corrected to Guerquin-Kern, Jean-Luc]
Abstract
Here we identify the amino acid transporter AnsP1 as the unique aspartate importer in the human pathogen Mycobacterium tuberculosis. Metabolomic analysis of a mutant with an inactive AnsP1 revealed that the transporter is essential for M. tuberculosis to assimilate nitrogen from aspartate. Virulence of the AnsP1 mutant is impaired in vivo, revealing that aspartate is a primary nitrogen source required for host colonization by the tuberculosis bacillus.
Figures
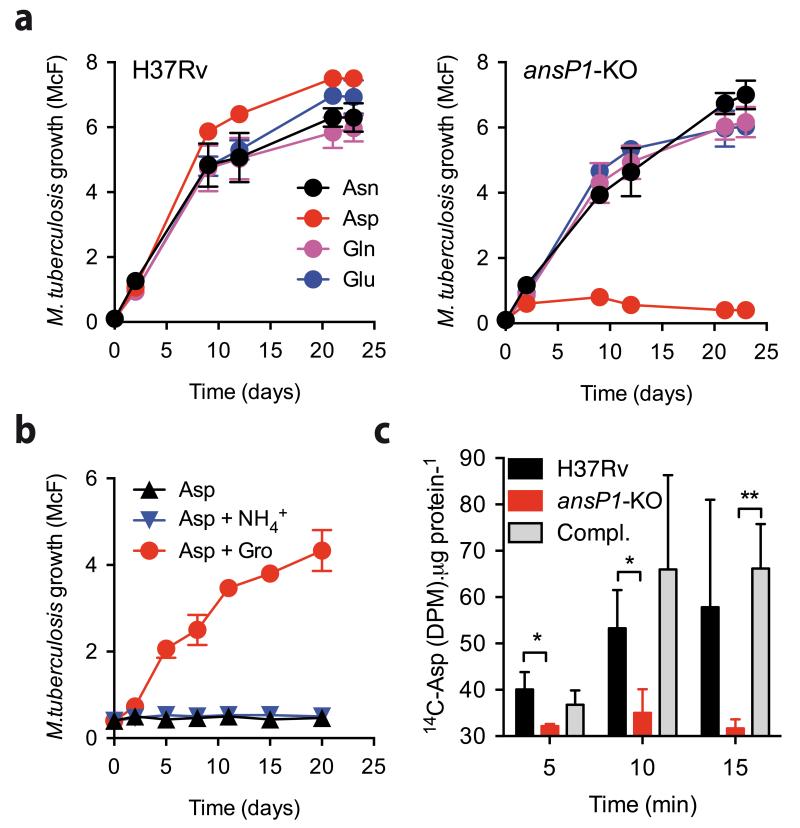
(a,b) Growth of M. tuberculosis H37Rv, the ansP1-KO mutant and the ansP1-KO complemented (Compl.) strains in various conditions. Growth was measured by monitoring turbidity; data represent mean ±s.d. of triplicate samples and are representative of at least three independent experiments. (a) Bacteria were grown in minimal medium containing 5 mM asparagine (Asn), aspartate (Asp), glutamine (Gln) or glutamate (Glu), as sole nitrogen sources. (b) Bacteria were grown in minimal medium containing 50 mM aspartate (Asp) only, 50 mM aspartate and 15 mM ammonium (Asp+NH4+), or 50 mM aspartate and 10 g/L glycerol (Asp+Gro), as nitrogen or carbon sources. (c)
14C-aspartate uptake assay with M. tuberculosis H37Rv, the ansP1-KO mutant and its complemented strains (Compl.). Bacteria previously grown in 7H9 with 5 mM aspartate, were harvested and resuspended in an uptake buffer containing a mix of 14C-radiolabeled and non-labeled aspartate to obtain a final concentration of 20 μM aspartate. Bacteria were incubated at 37°C and samples were removed; bacteria-associated 14C radioactivity was quantified at the indicated time points. Data are expressed as the number of disintegrations per minute (DPM) per total protein concentration (14C-Asp (DPM).μg protein−1), represent mean ±s.d. of triplicate samples, are representative of three independent experiments, and were analyzed using the Student’s t test; *, P<0.05; **, P<0.01.
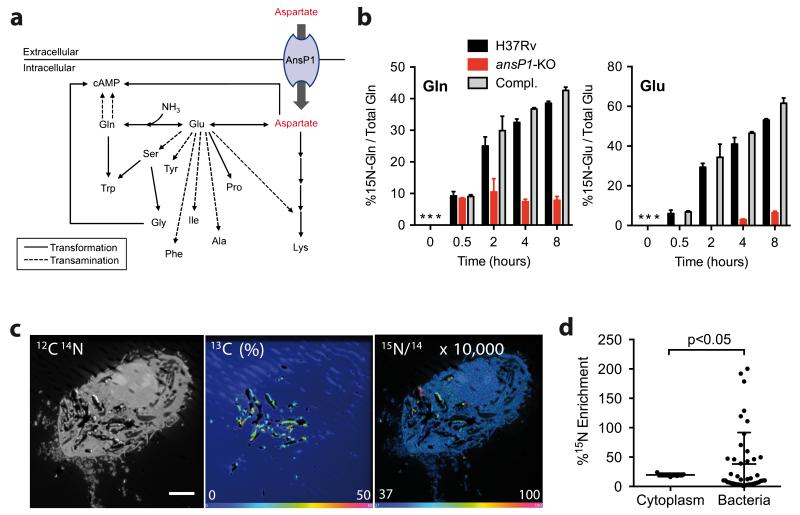
(a) Nitrogen incorporation pathways from aspartate into various N-containing metabolites resulting from transamination (dotted line) and/or transformation (plain lines) reactions. (b) Frequency of 15N-glutamine and 15N-glutamate detected in the presence of 15N-aspartate in either M. tuberculosis wild type (H37Rv), the ansP1-KO mutant, or its complemented strain (Compl.). Data represent mean±s.d. of triplicate samples and are representative of at least two independent experiments. *, no signal detected. Any signal below 5-10% corresponds to background noise. (c)
13C-labeled bacteria were used to infect mouse macrophages. After pulsing the cells with 15N-aspartate, 13C and 15N isotope compositions were analyzed by NanoSIMS. Images display a representative infected cell. Left panel is the as recorded 12C14N− image showing the histological aspect of the cell (scale bar represents 5 μm). The central panel represents the 13C atomic fraction map (in %) of the corresponding area. The right panel shows the 15N/14N ratio image indicating the 15N-aspartate uptake. For enhanced visibility, the ratio was multiplied by 1×10⁴. The 15N/14N ratio at natural 15N abundance appears blue. (d) Quantification of 15N enrichment (compared to the resin) in surface areas chosen in the cell cytoplasm (n=5), and intracellular 13C labeled bacteria (n=43). Data represent mean ±s.d. and were analyzed using the Student’s t test. The 15N-enriched phagosomes, arbitrarily defined as those vacuoles with a 15N enrichment above mean+3s.d. of that observed in the host cell cytoplasm, represent 34.9% of all phagosomes.
Comment in
-
Minding the gaps: metabolomics mends functional genomics.EMBO Rep. 2013 Nov;14(11):949-50. doi: 10.1038/embor.2013.155. Epub 2013 Oct 1. EMBO Rep. 2013. PMID: 24080759 Free PMC article. No abstract available.
-
A central role for aspartate in Mycobacterium tuberculosis physiology and virulence.Front Cell Infect Microbiol. 2013 Oct 24;3:68. doi: 10.3389/fcimb.2013.00068. eCollection 2013. Front Cell Infect Microbiol. 2013. PMID: 24187657 Free PMC article. No abstract available.
References
Publication types
MeSH terms
Substances
Grants and funding
LinkOut - more resources
Full Text Sources
Other Literature Sources
