. 2013:4:2364.
doi: 10.1038/ncomms3364.

MiRNAs confer phenotypic robustness to gene networks by suppressing biological noise

Affiliations

MiRNAs confer phenotypic robustness to gene networks by suppressing biological noise

Velia Siciliano et al. Nat Commun. 2013.

Abstract

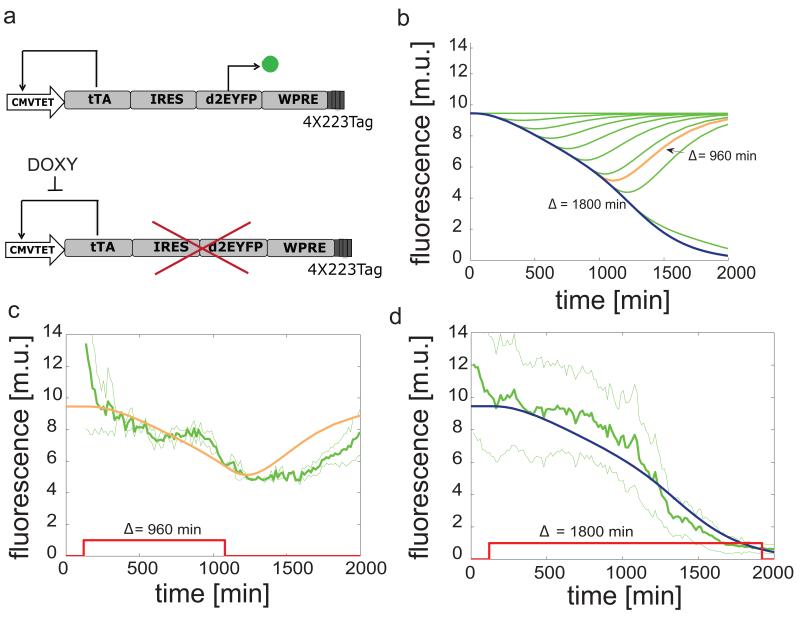
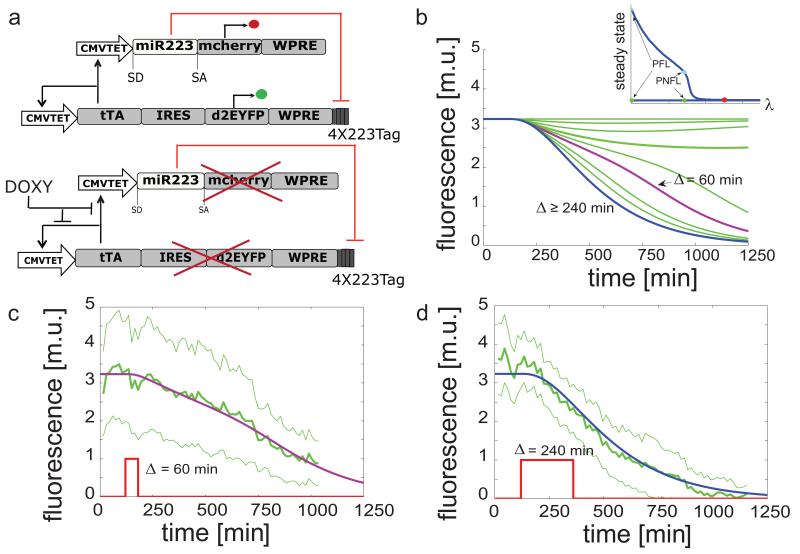
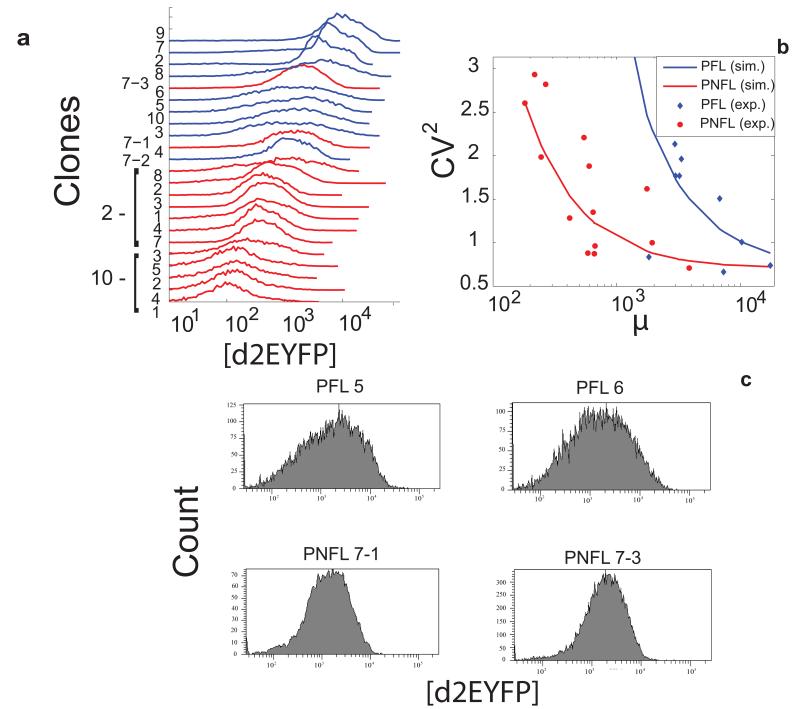
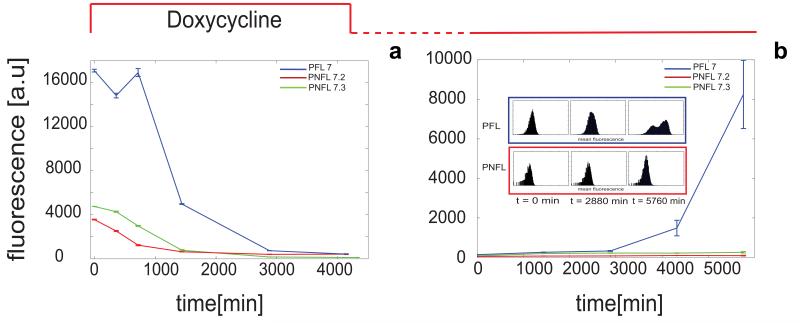
miRNAs are small non-coding RNAs able to modulate target gene expression. It has been postulated that miRNAs confer robustness to biological processes, but clear experimental evidence is still missing. Here, using a synthetic biological approach, we demonstrate that microRNAs provide phenotypic robustness to transcriptional regulatory networks by buffering fluctuations in protein levels. We construct a network motif in mammalian cells exhibiting a 'toggle-switch' phenotype in which two alternative protein expression levels define its ON and OFF states. The motif consists of an inducible transcription factor that self-regulates its own transcription and that of a miRNA against the transcription factor itself. We confirm, using mathematical modelling and experimental approaches, that the microRNA confers robustness to the toggle-switch by enabling the cell to maintain and transmit its state. When absent, a dramatic increase in protein noise level occurs, causing the cell to randomly switch between the two states.


Figures

Figure 1
Figure 1. Schematics of the PNFL motif and “switch OFF” experiments following pulses of Doxycycline of different duration
(a): the tetracycline-controlled transactivator (tTA) is self-regulated, in the absence of doxycycline, by binding the tTA-responsive CMV-TET promoter, thus generating a positive feedback loop (PFL - black lines), whose dynamics is tracked by a destabilized EYFP (d2EYFP). The same CMV-TET promoter drives the transcription of the human microRNA miR-223 embedded in the first intron of the low affinity nerve growth factor receptor (ΔLNGFR), followed by a reporter gene encoding for the mCherry fluorescent protein (Negative Feedback Loop - NFL - red lines). miR223 in turn down-regulates the tTA mRNA levels through 4-repeated target sequences perfectly complementary to the miR-223 seed sequence, placed at the 3′UTR of the PFL gene expression cassette. Doxycycline interrupts the tTA-mediated transcriptional activation. WPRE, woodchuck hepatitis virus post-transcription regulatory element. (b): simulated d2EYFP fluorescence of PNFL cells following simulated treatment with Doxycycline of different duration Δ. In the inset, the bifurcation diagram when varying the miRNA strength (λ) is shown. (c),(d): experimental d2EYFP fluorescence using the microfluidics device (solid green line) following treatment with Doxycycline (red line) at time 120 min and removal after Δ = 60 min (c) or 240 min (d); standard deviation is among at least three replicates (thin green lines); simulations (blue and purple lines) are rescaled to the experimental data and also represented in (b) (same colors).
Figure 2
Figure 2. Schematics of the PFL motif and “switch OFF” experiments following pulses of Doxycycline of different duration
(a): the tetracycline-controlled transactivator (tTA) is self-regulated, in the absence of doxycycline, by binding the tTA-responsive CMV-TET promoter, thus generating a positive feedback loop (PFL - black lines), whose dynamics is tracked by a destabilized EYFP (d2EYFP). (b): simulated d2EYFP fluorescence of PFL cells following simulated treatment with Doxycycline of different duration Δ. (c),(d): experimental d2EYFP fluorescence using the microfluidics device (solid green line) following treatment with Doxycycline (red line) at time 120 min and removed after Δ = 960 min (c) or 1800 min (d); standard deviation (thin green lines) is among at least three replicates; simulations (blue and orange lines) are rescaled to experimental data and also represented in (b) (same colors).
Figure 3
Figure 3. Fluorescence-Activated Cell Sorting (FACS) switch off experiment of PFL and PNFL cells
(a): d2EYFP fluorescence levels in PFL cells (blue line) and PNFL 7-2 and 7-3 cells (red and green line respectively) were measured at 0 hrs, 6 hrs (360 min), 12 hrs (720 min), 24 hrs (1440 min), 48 hrs (2880 min) and 72 hrs (4320 min) following treatment with Doxycycline (1 μg/ml) at time 0 hrs. (b): d2EYFP fluorescence levels in PFL cells (blue line) and PNFL cells (red line) cells were measured at 0 hrs, 24 hrs (1440 min), 48 hrs (2880 min), 96 hrs (5760 min) following removal of Doxycycline at time 0 hrs. Prior to time 0 hrs, both PFL and PNFL cells were grown in the presence of Doxycycline for 72 hrs. (Subpanel): histogram displaying FACS data for PFL 7 (blue frame) and PNFL 7-2 (red frame) at times t = 0, 2880 min and 5760 min; CVs computed at 0 hrs, 24 hrs, 48 hrs, 72 hrs are respectively 74.5, 105.1, 108, 202.6 for PFL and 81.9, 88.4, 85.75, 96 for the PNFL, thus revealing the higher variability for PFL clones compared to PFL. Error bars represent the standard deviation among three replicates.
Figure 4
Figure 4. The miRNA-mediated negative feedback loop reduces fluctuations in protein expression
(a): FACS-derived histograms of the distribution of d2EYFP fluorescence for the 9 clonal populations of PFL cells (in blue) and the 14 clonal populations of PNFL cells (in red). (b): Experimental (dots) and simulated (solid lines) values of CV2 as a function of mean fluorescence for PFL clones (in blue) and PNFL clones (in red); the simulated CV2 values were computed as described in Supplementary Notes (Eqs 10 - 19). (c) FACS-derived histograms of the distribution of d2EYFP fluorescence in two representative clonal populations of PFL and PNFL cells with similar average fluorescent intensities (PFL 5,6 and PNFL 7-1, 7-3).

References

    1. Inui M, Martello G, Piccolo S. Microrna control of signal transduction. Nat Rev Mol Cell Biol. 2010;11:264–275. - PubMed
    1. Alvarez-Saavedra E, Horvitz HR. Many families of c. elegans micrornas are not essential for development or viability. Current Biology. 2010;20:367–373. - PMC - PubMed
    1. Miska EA, et al. Most Caenorhabditis elegans microRNAs Are Individually Not Essential for Development or Viability. PLoS Genet. 2007;3:e215+. - PMC - PubMed
    1. Abbott AL, et al. The let-7 microrna family members mir-48, mir-84, and mir-241 function together to regulate developmental timing in caenorhabditis elegans. Developmental Cell. 2005;9:403–414. - PMC - PubMed
    1. Li X, Cassidy JJ, Reinke CA, Fischboeck S, Ca RW. A microrna imparts robustness against environmental fluctuation during development. Cell. 2009;137:273–282. - PMC - PubMed

Publication types