. 2013 Nov;20(11):1243-9.
doi: 10.1038/nsmb.2676. Epub 2013 Sep 29.

Divergent evolution of protein conformational dynamics in dihydrofolate reductase

Affiliations

Divergent evolution of protein conformational dynamics in dihydrofolate reductase

Gira Bhabha et al. Nat Struct Mol Biol. 2013 Nov.

Abstract

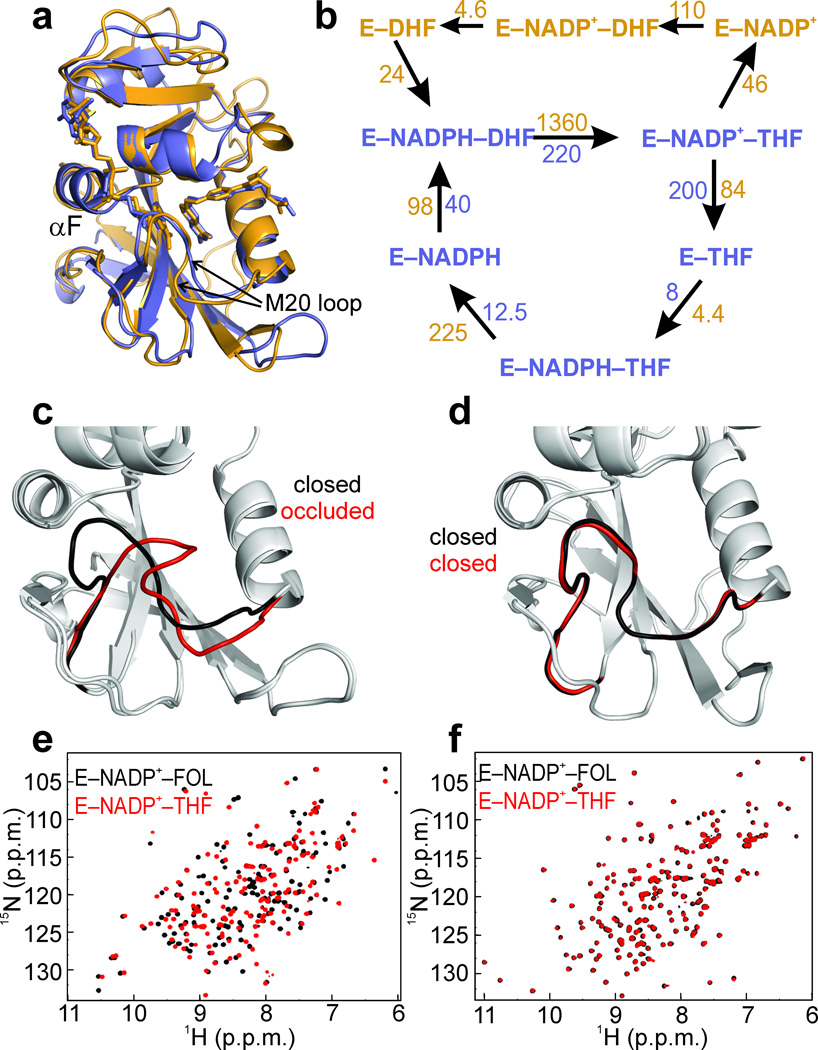
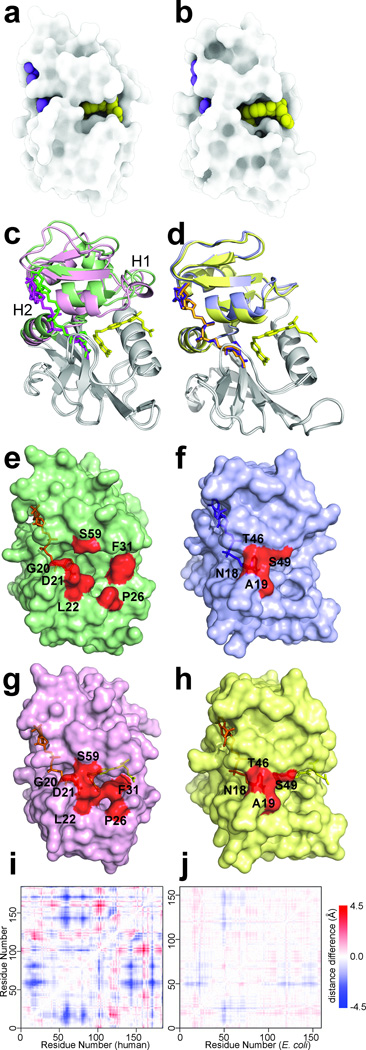
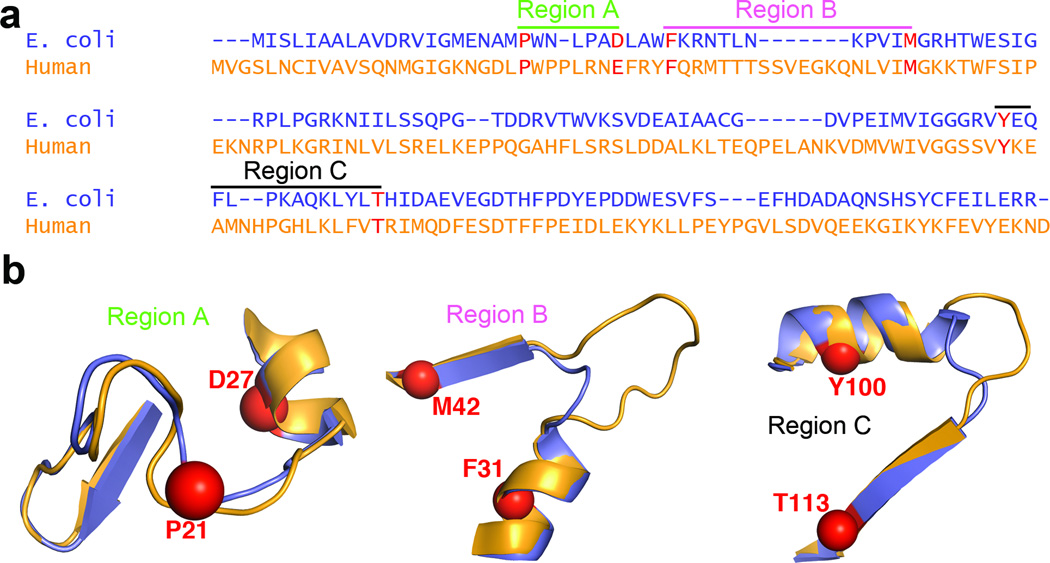
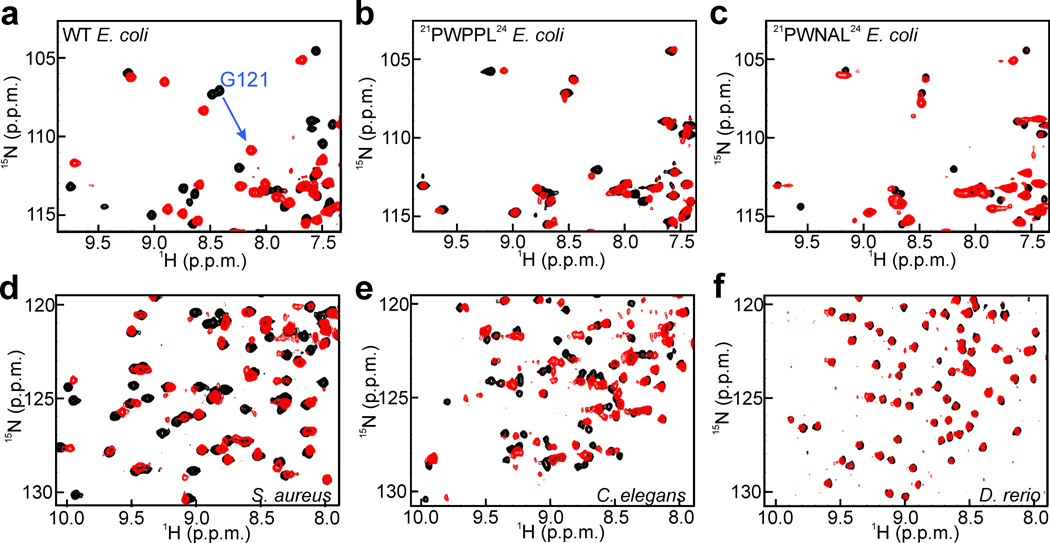
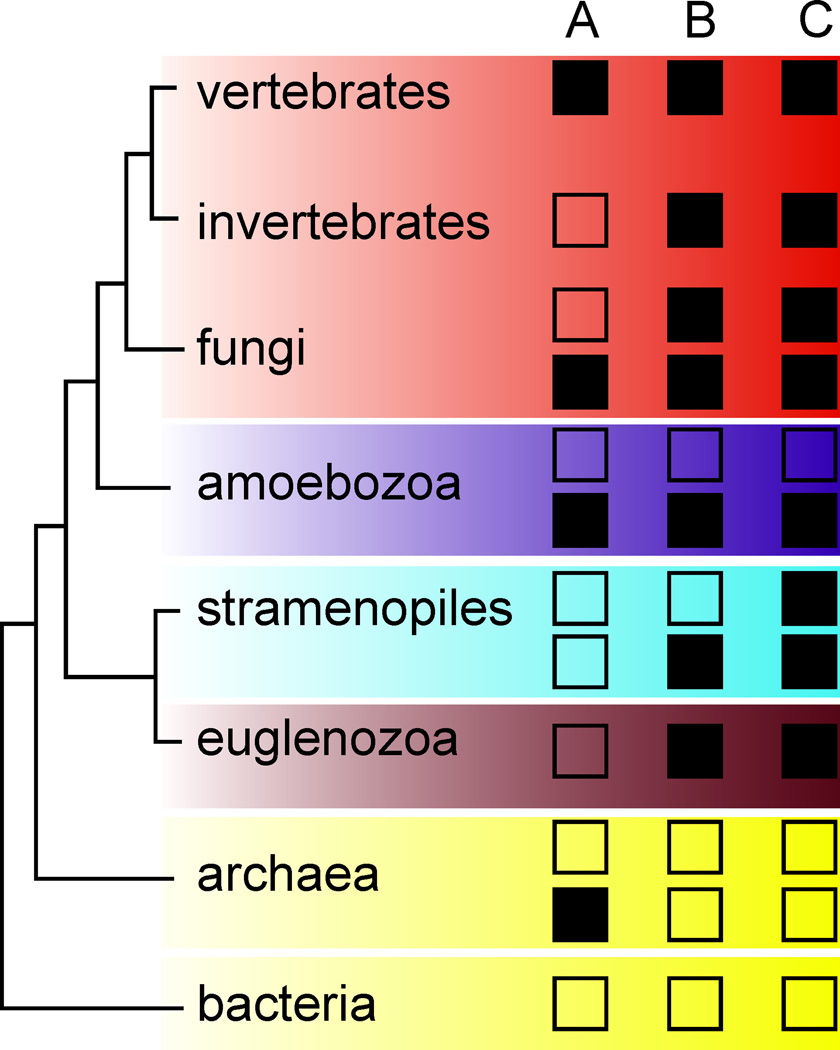
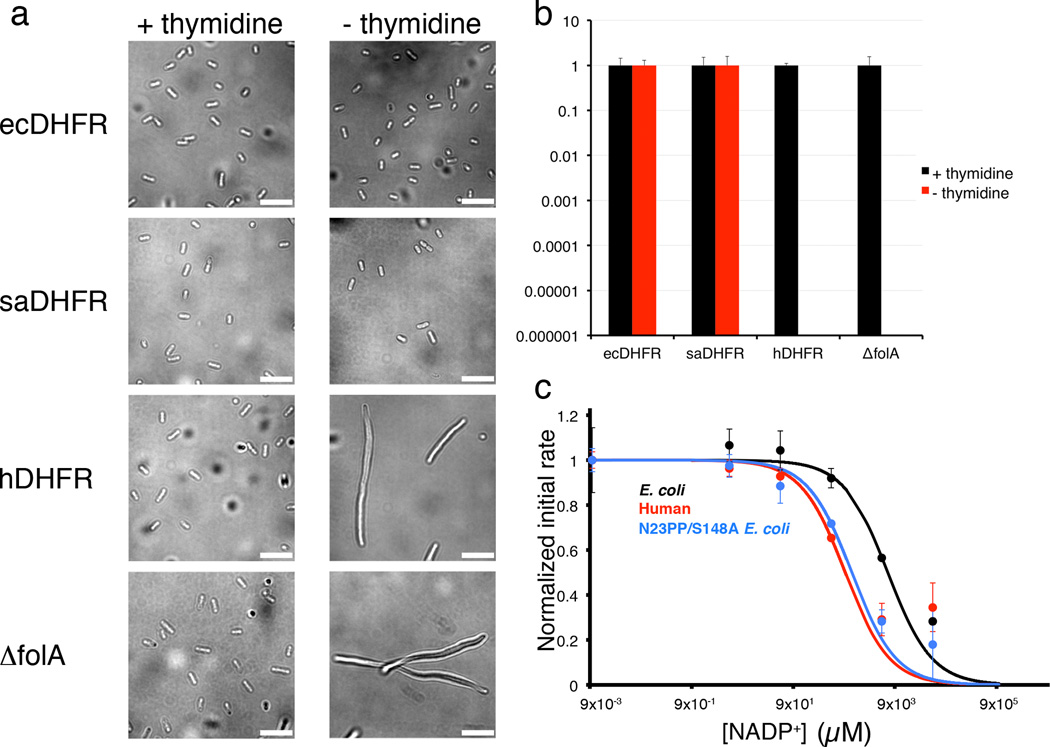
Molecular evolution is driven by mutations, which may affect the fitness of an organism and are then subject to natural selection or genetic drift. Analysis of primary protein sequences and tertiary structures has yielded valuable insights into the evolution of protein function, but little is known about the evolution of functional mechanisms, protein dynamics and conformational plasticity essential for activity. We characterized the atomic-level motions across divergent members of the dihydrofolate reductase (DHFR) family. Despite structural similarity, Escherichia coli and human DHFRs use different dynamic mechanisms to perform the same function, and human DHFR cannot complement DHFR-deficient E. coli cells. Identification of the primary-sequence determinants of flexibility in DHFRs from several species allowed us to propose a likely scenario for the evolution of functionally important DHFR dynamics following a pattern of divergent evolution that is tuned by cellular environment.


Figures

Figure 1
Figure 1. Human and E. coli DHFRs are structurally conserved, but have different active site loop movements
(a) Superposition of hDHFR (orange) and ecDHFR (purple), bound to NADP+ and FOL. Ligands are shown as sticks. (b) Catalytic cycles of ecDHFR and hDHFR. Both enzymes share a similar catalytic cycle, involving five observable intermediates (purple). In addition, the human enzyme also traverses a second catalytic cycle (orange), with E–NADP+–THF being the branch point. Approximately 65% of the flux proceeds through the same catalytic cycle as ecDHFR (purple), while 35% proceeds through the upper cycle (orange). Units are in s−1 for first order rates and M−1s−1 for bimolecular rates. (c) Crystal structures of ecDHFR bound to NADP+ and FOL (1RX218, Met20 loop shown in black) or NADP+ and ddTHF (1RX418, Met20 loop shown in red). The ecDHFR Met20 loop shifts from the closed (black) to occluded (red) conformations depending on the ligand bound. (d) Crystal structures of hDHFR bound to NADP+ and FOL (Met20 loop shown in black) or NADP+ and THF (Met20 loop shown in red). (e) 15N HSQC spectra of ecDHFR bound to NADP+ and FOL (black) or NADP+ and THF (red), showing chemical shift changes between the closed Michaelis model complex and the occluded product ternary complex. (f) 15N HSQC of hDHFR bound to NADP+ and FOL (black) or NADP+ and THF (red). The active site loops of hDHFR remain in the closed position across the hydride transfer step.
Figure 2
Figure 2. Active site packing and hinge motions in hDHFR
a,b Surface rendition of hDHFR–NADP+–FOL (a) and ecDHFR:NADP+–FOL (b) generated using only ambient occlusion, a 3D light attenuation calculation where deep pockets render dark and exposed surfaces render light35. c,d Superposition of crystal structures, aligned on the loop subdomain (gray), of hE–NADPH and hE–NADP+–FOL (c) and ecE–NADPH (PDB code: 1RX118) and ecE–NADP+–FOL (PDB code: 1RX218) (d). The adenosine-binding subdomain is colored green for hE–NADPH and pink for hE–NADP+–FOL. Ligands are shown as sticks, with NADPH in green, NADP+ in magenta and FOL in yellow. The adenosine-binding subdomain is colored purple for ecE–NADPH and yellow for ecE–NADP+–FOL, with NADPH in purple, NADP+ in orange and folate in yellow. e,f,g,h Surface representations of hE–NADPH (e), ecE–NADPH (f), hE–NADP+–FOL (g) and ecE–NADP+–FOL (h). Residues highlighting the opening and closing of the active site cleft are colored in red. i,j Difference distance matrix for hE–NADPH and hE–NADP+–FOL (i) and ecE–NADPH and ecE–NADP+–FOL (j), showing the magnitude and character of the conformational changes associated with the hinge motions.
Figure 3
Figure 3. Primary sequence features related to flexibility and conformational change in E. coli and human DHFR
(a) Sequence alignment of ecDHFR and hDHFR showing three regions of the sequence related to dynamic mechanism. The anchor residues for sequence alignment are shown in red. (b) Structure of regions highlighted in a, with anchor residues shown as spheres. ecDHFR is shown in purple, and hDHFR in orange. Regions A, B and C correspond to the “Met20” loop, hinge 1 and hinge 2, respectively. The following anchor residues were chosen for sequence alignments (E. coli numbering): P21 and D27 for Region A, F31 and M42 for Region B, and Y100 and T113 for Region C.
Figure 4
Figure 4. Conformational changes between reactant and product complexes
Cropped regions of 15N-HSQC spectra of DHFRs: (a) wild-type (WT) E. coli; (b) PWPPL E. coli; (c) PWNAL E. coli; (d) S. aureus; (e) C. elegans; (f) D. rerio. Each panel shows a superposition of E– NADP+–FOL (model Michaelis complex, black) and E–NADP+– THF (product ternary complex, red). A blue arrow marks the change in the position of the G121 cross peak for wild type E. coli DHFR (a). There is no change in the chemical shift of G121 upon formation of the product complexes of the 21PWPPL24 and 21PWNAL24 mutants (b and c). Full 15N HSQC spectra for DHFR from different species are shown in Supplementary Fig. 6.
Figure 5
Figure 5. Overview of patterns in length of Met20 loop and hinges
A, B and C refer to Regions A (Met20 loop), B (hinge 1), and C (hinge 2) of the DHFR primary sequence as described in the text and Fig. 3. For A, open squares indicate 7 residues and filled squares indicate 8 or 10 residues in Region A. Enzymes with 7 residues in Region A undergo conformational changes across the hydride transfer step. An increase in the length of Region A (to 8 or 10 residues) is associated with limited flexibility in the active site loops and the absence of conformational change upon formation of product. For B, open squares indicate a short hinge (<15 residues in Region B) and filled squares indicate a long hinge (≥15 residues in Region B). For C, open squares indicate a short hinge (12 residues in Region C) and filled squares indicate a long hinge (≥14 residues in Region C). Long hinges facilitate the exaggerated hinge-twisting motion observed in hDHFR. While in some groups (e.g. fungi) more than one combination of features can be found, their distributions within the group do not follow any well-established phylogenetic divisions.
Figure 6
Figure 6. Human DHFR cannot complement DHFR-knockout E. coli cells, and is more sensitive to product inhibition than E. coli DHFR
(a) DIC micrographs of MG1655 ΔfolA and DHFR knock-in strains temporarily grown with or without thymidine, after initial growth in media supplemented with thymidine. The morphology of MG1655 ΔfolA cells expressing ecDHFR or saDHFR are similar with or without thymidine (short rods). In contrast, MG1655 ΔfolA cells expressing hDHFR filament extensively when grown in the absence of thymidine, similar to the DFHR knockout cell line, MG1655 ΔfolA. The scale bar corresponds to 10 µm. Images were obtained using the open-source microscopy software, µManager. (b) Relative plating efficiency of MG1655 ΔfolA and DHFR knock-in strains on LB medium with or without 100 µg/mL thymidine. Plating efficiency for each strain on LB with thymidine is normalized to 1. While both ecDHFR and saDHFR restore the ability to grow in the absence of thymidine, hDHFR fails to complement and resembles the folA null mutant, both of which are not viable in the absence of thymidine. The mean plating efficiency (n=3) is reported here, with error bars indicating the standard deviation. c. Initial kinetic rates for ecDHFR (black), hDHFR (red) and E. coli N23PP S148A mutant (blue) enzyme activity plotted as a function of increasing NADP+ concentrations. The IC50 for human DHFR is 948 µM, for ecDHFR, 6518 µM, and for the mutant N23PP S148A ecDHFR 1274 µM, closer to that of hDHFR. The experiment was carried out in duplicate, and values for the mean initial rates are plotted in the figure, with error bars indicating the range of values measured.

References

    1. Halabi N, Rivoire O, Leibler S, Ranganathan R. Protein sectors: evolutionary units of three-dimensional structure. Cell. 2009;138:774–786. - PMC - PubMed
    1. Alexander PA, He Y, Chen Y, Orban J, Bryan PN. A minimal sequence code for switching protein structure and function. Proc. Natl. Acad. Sci. USA. 2009;106:21149–21154. - PMC - PubMed
    1. Thompson J, Baker D. Incorporation of evolutionary information into Rosetta comparative modeling. Proteins. 2011;79:2380–2388. - PMC - PubMed
    1. Kohen A, Klinman JP. Protein flexibility correlates with degree of hydrogen tunneling in thermophilic and mesophilic alcohol dehydrogenases. J. Am Chem. Soc. 2000;122:10738–10739.
    1. Wolf-Watz M, et al. Linkage between dynamics and catalysis in a thermophilic-mesophilic enzyme pair. Nat. Struct. Mol. Biol. 2004;11:945–949. - PubMed

Methods-Only References

    1. Bhabha G, Tuttle L, Martinez-Yamout MA, Wright PE. Identification of endogenous ligands bound to bacterially expressed human and E. coli dihydrofolate reductase by 2D NMR. FEBS Letters. 2011;585:3528–3532. - PMC - PubMed
    1. Loria JP, Rance M, Palmer AG., III A relaxation-compensated Carr-Purcell-Meiboom-Gill sequence for characterizing chemical exchange by NMR spectroscopy. J. Am Chem. Soc. 1999;121:2331–2332.
    1. McElheny D, Schnell JR, Lansing JC, Dyson HJ, Wright PE. Defining the role of active-site loop fluctuations in dihydrofolate reductase catalysis. Proc. Natl. Acad. Sci. USA. 2005;102:5032–5037. - PMC - PubMed
    1. Sugase K, Konuma T, Lansing JC, Wright PE. Fast and accurate fitting of relaxation dispersion data using the flexible software package GLOVE. J. Biomol. NMR. 2013;56:275–283. - PMC - PubMed
    1. Massi F, Johnson E, Wang C, Rance M, Palmer AG., III NMR R1ρ rotating-frame relaxation with weak radio frequency fields. J. Am Chem. Soc. 2004;126:2247–2256. - PubMed

Publication types

Substances