. 2014 Sep 4;33(36):4474-84.
doi: 10.1038/onc.2013.395. Epub 2013 Sep 30.

Cell type-dependent pathogenic functions of overexpressed human cathepsin B in murine breast cancer progression

Affiliations

Cell type-dependent pathogenic functions of overexpressed human cathepsin B in murine breast cancer progression

F Bengsch et al. Oncogene. .

Abstract

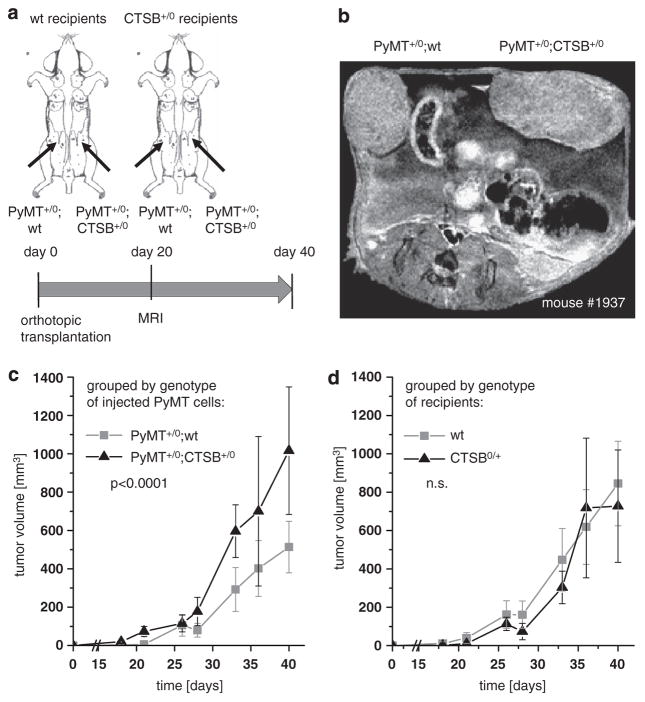
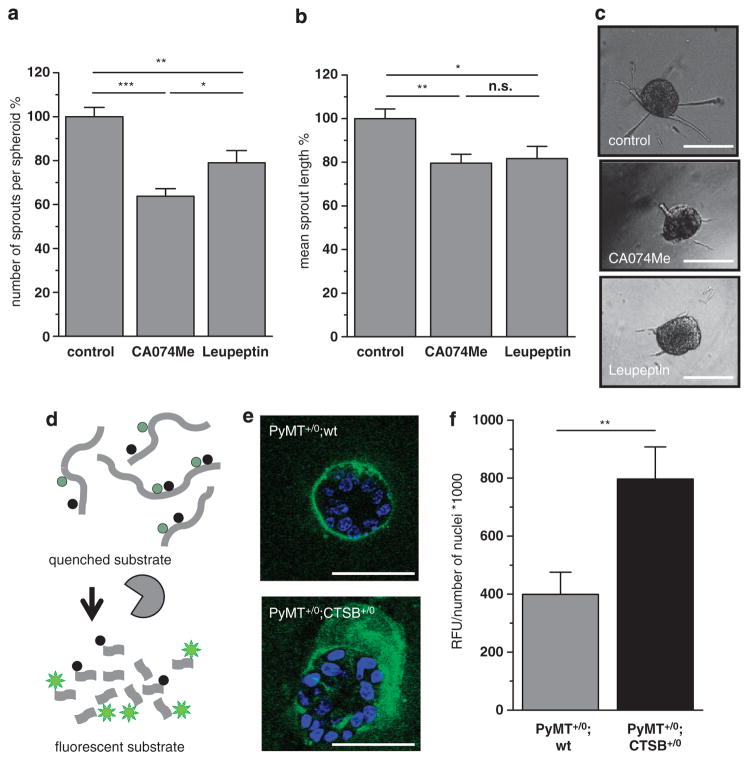
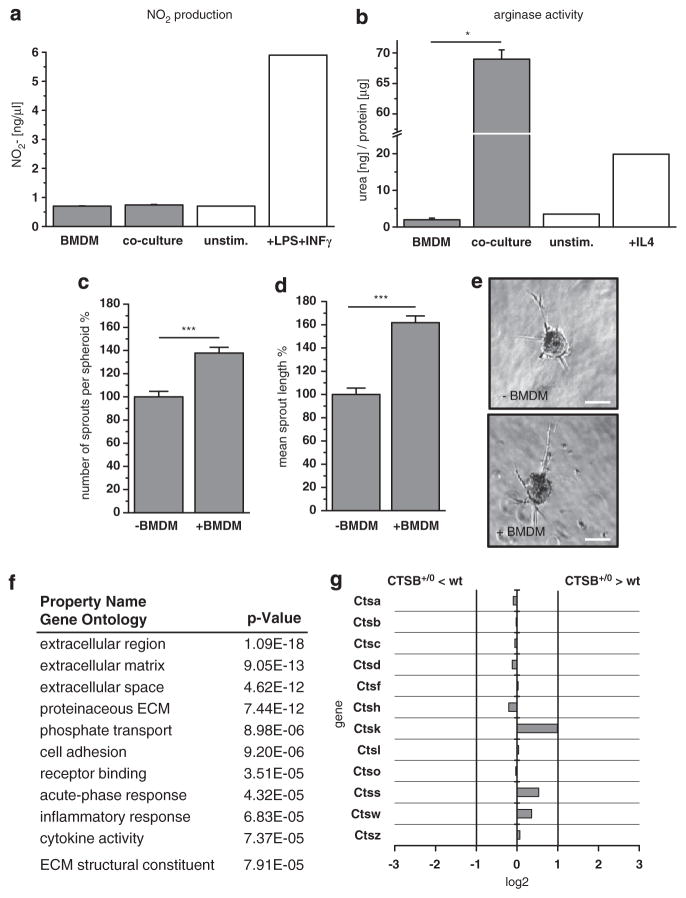
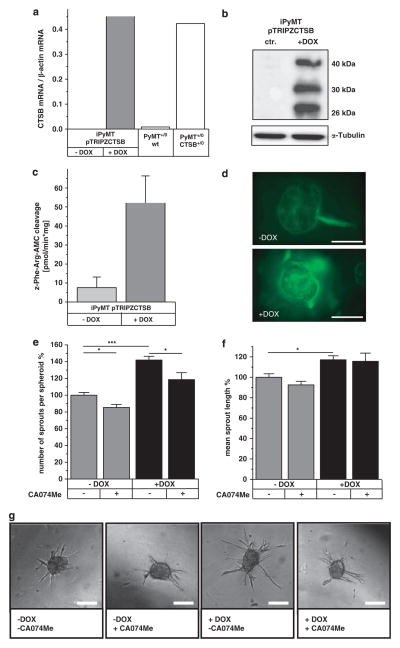
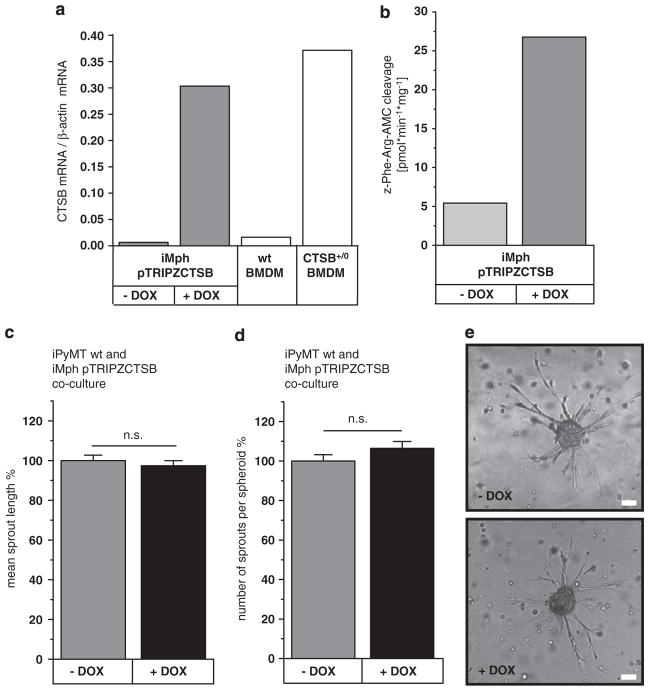
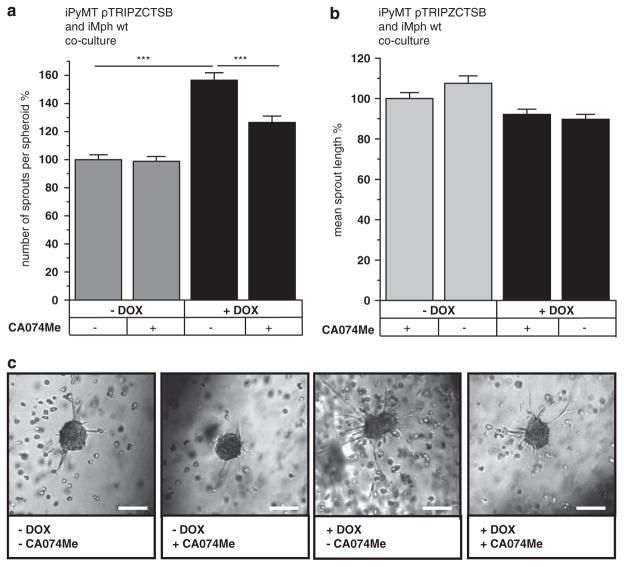
The cysteine protease cathepsin B (CTSB) is frequently overexpressed in human breast cancer and correlated with a poor prognosis. Genetic deficiency or pharmacological inhibition of CTSB attenuates tumor growth, invasion and metastasis in mouse models of human cancers. CTSB is expressed in both cancer cells and cells of the tumor stroma, in particular in tumor-associated macrophages (TAM). In order to evaluate the impact of tumor- or stromal cell-derived CTSB on Polyoma Middle T (PyMT)-induced breast cancer progression, we used in vivo and in vitro approaches to induce human CTSB overexpression in PyMT cancer cells or stromal cells alone or in combination. Orthotopic transplantation experiments revealed that CTSB overexpression in cancer cells rather than in the stroma affects PyMT tumor progression. In 3D cultures, primary PyMT tumor cells showed higher extracellular matrix proteolysis and enhanced collective cell invasion when CTSB was overexpressed and proteolytically active. Coculture of PyMT cells with bone marrow-derived macrophages induced a TAM-like macrophage phenotype in vitro, and the presence of such M2-polarized macrophages in 3D cultures enhanced sprouting of tumor spheroids. We employed a doxycycline (DOX)-inducible CTSB expression system to selectively overexpress human CTSB either in cancer cells or in macrophages in 3D cocultures. Tumor spheroid invasiveness was only enhanced when CTSB was overexpressed in cancer cells, whereas CTSB expression in macrophages alone did not further promote invasiveness of tumor spheroids. We conclude that CTSB overexpression in the PyMT mouse model promotes tumor progression not by a stromal effect, but by a direct, cancer cell-inherent mode of action: CTSB overexpression renders the PyMT cancers more invasive by increasing proteolytic extracellular matrix protein degradation fostering collective cell invasion into adjacent tissue.


Conflict of interest statement

CONFLICT OF INTEREST

The authors declare no conflict of interest.

Figures

Figure 1
Figure 1
Orthotopic transplantation of primary PyMT cells. (a) Schematic representation of experimental setup: primary tumor cells (0.5 × 10⁶) either PyMT +/0;wt or PyMT +/0;CTSB +/0 were injected bilaterally into a defined mammary gland of female adult recipient mice of wt or CTSB+/0 genotype. Tumor volumes were determined by diameter measurement twice a week and by magnetic resonance imaging (MRI) at day 20 post injection. (b) Representative MRI image. (c) Tumor growth kinetics grouped by genotype (PyMT +/0;wt or PyMT +/0;CTSB +/0) of injected tumor cells. Bilateral tumor volumes of 9–11 animals depending on the time point. (d) Tumor growth kinetics grouped by genotype of recipient mice (wt or CTSB +/0). Bilateral tumor volumes of 9–11 animals per group depending on the time point. Data points represent mean ± s.e.m.
Figure 2
Figure 2
Invasiveness of primary PyMT tumor spheroids and matrix degradation. (a, b) Effect of protease inhibition on average number of sprouts per spheroid and mean sprout length. PyMT +/0;wt spheroids were grown in collagen I for 24 h, inhibition of CTSB by CA074Me (10 μM), broad spectrum protease inihibiton by Leupeptin (10 μM). A total of 153, 190 and 170 spheroids, in the control-, CA074Me- and Leupeptin-group, were analyzed in 3–5 independent assays. Quantitative values represent mean ± s.e.m.; NS, not significant, *P<0.05, **P<0.01 and ***P<0.001 by ANOVA and post hoc Tukey-test. (c) Representative phase contrast images of tumor spheroids. Scale bars indicate 100 μm. (d) Schematic principle of proteolysis detection with dye-quencher (DQ)-labeled substrate collagen IV. (e) Representative pictures of tumor spheroids of primary PyMT +/0;wt or PyMT +/0;CTSB +/0 tumor cells grown in reconstructed basement membrane for 6 days. Pictures are overlays of 10 confocal planes, scale bars indicate 50 μm. (f) Quantification of fluorescence emission upon substrate cleavage detected by confocal imaging.
Figure 3
Figure 3
Interaction of tumor cells and macrophages. (a) Nitric oxide (NO) production by bone marrow-derived macrophages after 24 h in 1:1 indirect (transwell) cocultures with primary PyMT tumor cells. (b) Arginase activity of bone marrow-derived macrophages after 24 h in 1:1 direct cocultures with primary PyMT tumor cells. (c, d) Average number of sprouts per spheroid and mean sprout length of primary tumor spheroids alone or in coculture with bone marrow-derived macrophages (ratio tumor cells: macrophages = 1:1) in collagen I matrix. A total of 161 and 251 spheroids were analyzed in three independent assays. Quantitative values represent mean ± s.e.m.; ***P<0.001 by t-test. (e) Representative phase contrast pictures of spheroids. Scale bar indicates 100 μm. (f) Gene Ontology categories of genes with changed expression in direct coculture of bone marrow-derived macrophages with primary PyMT derived from microarray gene expression analysis. Enhancement in the enlisted categories is significant by P<10– in Fisher’s t-test. (g) Comparison of cysteine cathepsin expression in wt and CTSB +/0 cocultures derived from microarray gene expression analysis.
Figure 4
Figure 4
Induction of human CTSB expression affects spheroid sprouting and matrix degradation. (a) Induction of CTSB mRNA expression by doxycycline (1 μM) measured by qRT–PCR. (b) Human CTSB protein in western blot. (c) CTSB activity detected by proteolytic cleavage of the fluorogenic substrate Z-Phe-Arg-AMC. (d) Proteolysis of dye-quencher-labeled collagen IV in 3D culture. Scale bar indicates 100 μm. (e, f) Average number of sprouts per spheroid and mean sprout length of tumor spheroids in collagen I matrix upon induction of human CTSB by doxycycline (Dox) and under inhibition of CTSB by CA074Me (10 μM). A total of 235, 243, 167 and 93 spheroids were analyzed in 2–7 independent assays. Quantitative values represent mean ± s.e.m.; *P<0.05 and ***P<0.001 by ANOVA and post hoc Tukey-test. (g) Representative phase contrast pictures of tumor spheroids. Scale bar indicates 100 μm.
Figure 5
Figure 5
Induction of human CTSB expression in macrophages in coculture with tumor spheroids. (a) Induction of CTSB mRNA expression in macrophages iMph pTRIPZCTSB by doxycycline (1 μM) measured by qRT–PCR. (b) CTSB activity in macrophages iMph pTRIPZhCTSB upon induction of CTSB detected by proteolytic cleavage of the fluorogenic substrate Z-Phe-Arg-AMC. (c, d) Average number of spouts per spheroid and mean sprout length of DOX-insensitive tumor spheroids in cocultures with DOX-inducible macrophages (ratio 1:1). Addition of DOX (1 μM) resulting in induction of CTSB expression only in the macrophages. (e) Representative phase contrast pictures of spheroids. Scale bar indicates 100 μm. A total of 195 and 199 spheroids in five independent assays were analyzed. Quantitative values represent mean ± s.e.m.; NS, not significant, by ANOVA and post hoc Tukey-test.
Figure 6
Figure 6
Induction of CTSB in PyMT tumor spheroids in coculture with macrophages. (a, b) Average number of sprouts per spheroid and mean sprout length in 3D cocultures of inducible PyMT tumor cells and Dox-insensitive macrophages. Induction with Dox (1 μM) and CTSB inhibition by CA074Me (10 μM). A total of 147, 128, 133 and 135 spheroids in three independent assays were analyzed. Quantitative values represent mean ± s.e.m.; ***P<0.001 by ANOVA and post hoc Tukey-test. (c) Representative phase contrast pictures of tumor spheroids. Scale bars indicate 100 μm.

References

    1. Hanahan D, Weinberg RA. Hallmarks of cancer: the next generation. Cell. 2011;144:646–674. - PubMed
    1. Balkwill F. Cancer and the chemokine network. Nat Rev Cancer. 2004;4:540–550. - PubMed
    1. Mao Y, Keller ET, Garfield DH, Shen K, Wang J. Stromal cells in tumor micro-environment and breast cancer. Cancer Metastasis Rev. 2012;32:303–315. - PMC - PubMed
    1. Mason SD, Joyce JA. Proteolytic networks in cancer. Trends Cell Biol. 2011;21:228–237. - PMC - PubMed
    1. Rawlings ND, Morton FR, Kok CY, Kong J, Barrett AJ. MEROPS: the peptidase database. Nucleic Acids Res. 2008;36:D320–D325. - PMC - PubMed

Publication types

MeSH terms