. 2014 Sep 30;5(18):8202-10.
doi: 10.18632/oncotarget.1159.

Tissue-specific isoform switch and DNA hypomethylation of the pyruvate kinase PKM gene in human cancers

Affiliations

Tissue-specific isoform switch and DNA hypomethylation of the pyruvate kinase PKM gene in human cancers

Shruti Desai et al. Oncotarget. .

Abstract

The M2 isoform of pyruvate kinase (PKM2) plays an important role in aerobic glycolysis and is a mediator of the Warburg effect in tumors. It was previously thought that tumor cells switch expression of PKM from normal tissue-expressed PKM1 to tumor-specific PKM2 via an alternative splicing mechanism. This view was challenged by a recent report demonstrating that PKM2 is already the major PKM isoform expressed in many differentiated normal tissues. Here, through analyses on sixteen tumor types using the cancer genome atlas RNA-Seq and exon array datasets, we confirmed that isoform switch from PKM1 to PKM2 occurred in glioblastomas but not in other tumor types examined. Despite lacking of isoform switches, PKM2 expression was found to be increased in all cancer types examined, and correlated strongly to poor prognosis in head and neck cancers. We further demonstrated that elevated PKM2 expression correlated well with the hypomethylation status of intron 1 of the PKM gene in multiple cancer types, suggesting epigenetic regulation by DNA methylation as a major mechanism in controlling PKM transcription in tumors. Our study suggests that isoform switch of PKM1 to PKM2 in cancers is tissue-specific and targeting PKM2 activity in tumors remains a promising approach for clinical intervention of multiple cancer types.


Figures

Figure 1
Figure 1. Boxplots of mRNA expression of PKM1, PKM2, and PKM2/PKM1 ratios in normal tissues and human cancers
mRNA expression data of PKM1 and PKM2 for various cancers and autologous normal controls were obtained from TCGA RNA-SeqV2 level 3 datasets as logged RPKM (see materials and methods) and plotted. BLCA, bladder carcinoma, BRCA, breast invasive carcinoma, CESC, cervical squamous cell carcinoma, GBM, glioblastoma, HNSC, head and neck squamous carcinoma, KIRC, kidney renal clear cell carcinoma, KIRP, kidney renal papillary carcinoma, LIHC, liver hepatocellular carcinoma, LUAD, lung adenocarcinoma, LUSC, lung squamous carcinoma, OV, ovarian serous cystadenocarcinoma, PAAD, pancreatic adenocarcinoma, PRAD, prostate adenocarcinoma, SKCM, skin cutaneous melanoma, THCA, thyroid carcinoma, UCEC, endometrial carcinoma. Number of autologous normal controls were labeled in the bottom panel (n=). Statistically significant changes in PKM2/PKM1 ratio between normal tissue and cancers were marked by asterisks (**, p<0.01, ***, p<0.001 by two sample t-test).
Figure 2
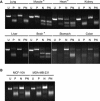
Figure 2. Determination of major PKM isoforms in normal tissues using RT-PCR and restriction enzyme digestion
Total RNA was analyzed by RT-PCR followed by enzymatic digestion with PstI (P), NcoI (N) or both enzymes (PN) and an uncut control (U) in (A) normal tissues and in (B) breast cell lines. Samples with a clear PKM2 digestion pattern (muscle, heart, and brain) are labeled with asterisks (see methods [25]).
Figure 3
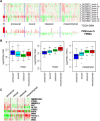
Figure 3. Differential PKM1 to PKM2 isoform switch in glioblastoma (GBM) subtypes
(A), top, heatmap of PKM2 exon array FIRMA values for normal brain (N) and GBMs (in subtypes as labeled); bottom, barplot of FIRMA values from -5 to 7 of the exon array probe covering PKM exon 9 (PKM1-specific exon). (B), boxplots of mRNA expression of PKM1, PKM2, and PKM2/PKM1 ratios in GBM subtypes. mRNA expression data of PKM1 and PKM2 for GBM subtypes were obtained from TCGA RNA-SeqV2 level 3 datasets as logged RPKM values (see material and methods). (C), heatmap of mRNA expression of PKM genes, their known regulators, and glioblastoma subtype markers. Data were obtained from TCGA RNA-SeqV2 level 3 datasets as logged RPKM with median removal and drawn by the TreeView software.
Figure 4
Figure 4. Identification of hypermethylation sites in the PKM gene corresponding to reduced PKM expression
(A), differential methylation of the PKM gene between cancers and normal controls. Differences of median M values between various tumors and autologous normal controls were plotted for all Met450 probes covering the PKM gene. (B), heatmap of M values for various tumors and autologous normal controls. Methylation M values for PKM genes were collected from up to 50 normal controls along with 100 randomly selected tumors and clustered after median removal. Red, hypermethylation, green, hypomethylation. (C), correlation of PKM intron 1 hypermethylation to reduced PKM expression. DNA methylation beta value for probe cg24327132 (located in intron 1, figure S4) were plotted against PKM expression data from RNA-seq in multiple cancers. Pink, tumors, blue, normal control. Pearson correlation r values were labeled.
Figure 5
Figure 5. Overexpression of PKM2 correlated with poor prognosis in head and neck cancers
Kaplan Meier plot is drawn on patients stratified by K means (k=3) method to divide head and neck cancer patients into PKM2-low, medium, and high expressing groups using data from TCGA.

References

    1. Warburg O. On the origin of cancer cells. Science. 1956;123:309–14. - PubMed
    1. Hsu PP, Sabatini DM. Cancer cell metabolism: Warburg and beyond. Cell. 2008;134:703–7. - PubMed
    1. Dang CV, Kim JW, Gao P, Yustein J. The interplay between MYC and HIF in cancer. Nat Rev Cancer. 2008;8:51–6. - PubMed
    1. Zhao YH, Zhou M, Liu H, Ding Y, Khong HT, Yu D, Fodstad O, Tan M. Upregulation of lactate dehydrogenase A by ErbB2 through heat shock factor 1 promotes breast cancer cell glycolysis and growth. Oncogene. 2009;28:3689–701. - PubMed
    1. Jiang P, Du W, Wang X, Mancuso A, Gao X, Wu M, Yang X. p53 regulates biosynthesis through direct inactivation of glucose-6-phosphate dehydrogenase. Nat Cell Biol. 2011;13:310–6. - PMC - PubMed

Publication types

MeSH terms

LinkOut - more resources