. 2014 Jan;57(1):192-203.
doi: 10.1007/s00125-013-3070-2.

Retinal proteome alterations in a mouse model of type 2 diabetes

Retinal proteome alterations in a mouse model of type 2 diabetes

Alice Ly et al. Diabetologia. 2014 Jan.

Abstract

Aims/hypothesis: Diabetic retinopathy is a major complication of type 2 diabetes and the leading cause of blindness in adults of working age. Neuronal defects are known to occur early in disease, but the source of this dysfunction is unknown. The aim of this study was to examine differences in the retinal membrane proteome among non-diabetic mice and mouse models of diabetes either with or without metformin treatment.

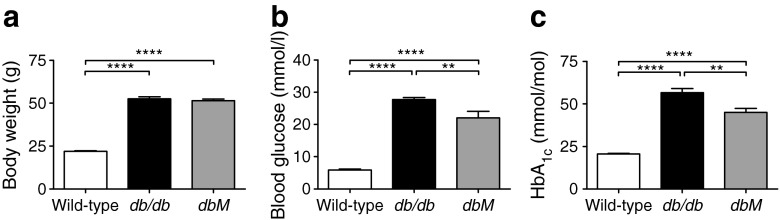
Methods: Alterations in the retinal membrane proteome of 10-week-old diabetic db/db mice, diabetic db/db mice orally treated with the anti-hyperglycaemic metformin, and congenic wild-type littermates were examined using label-free mass spectrometry. Pathway enrichment analysis was completed with Genomatix and Ingenuity. Alterations in Slc17a7 mRNA and vesicular glutamate transporter 1 (VGLUT1) protein expression were evaluated using real-time quantitative PCR and IMMUNOFLUORESCENCE.

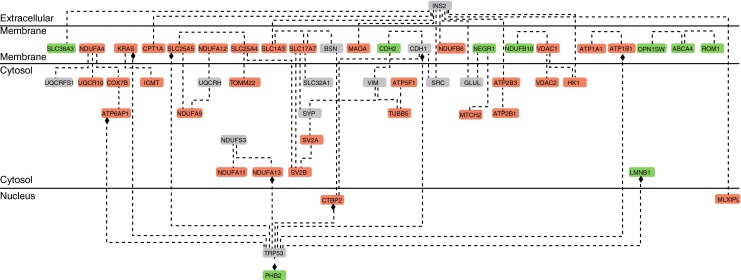
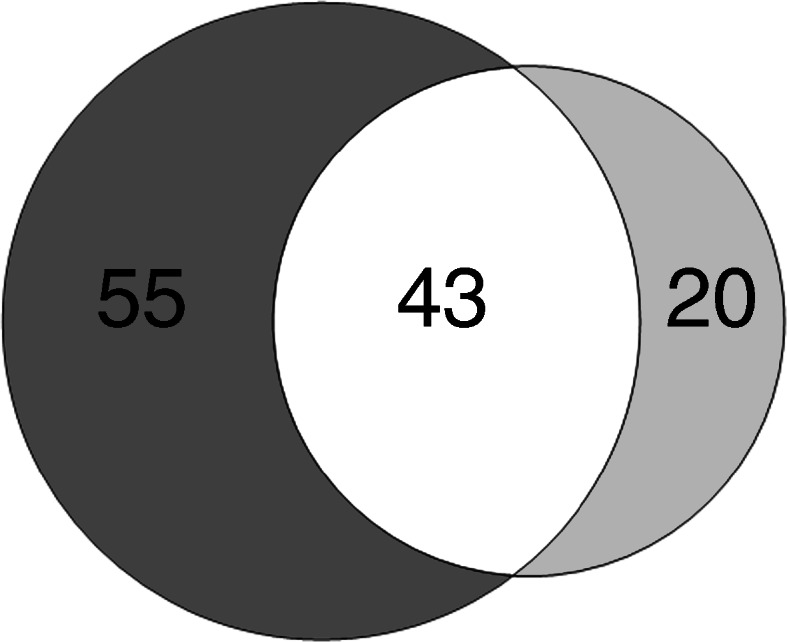
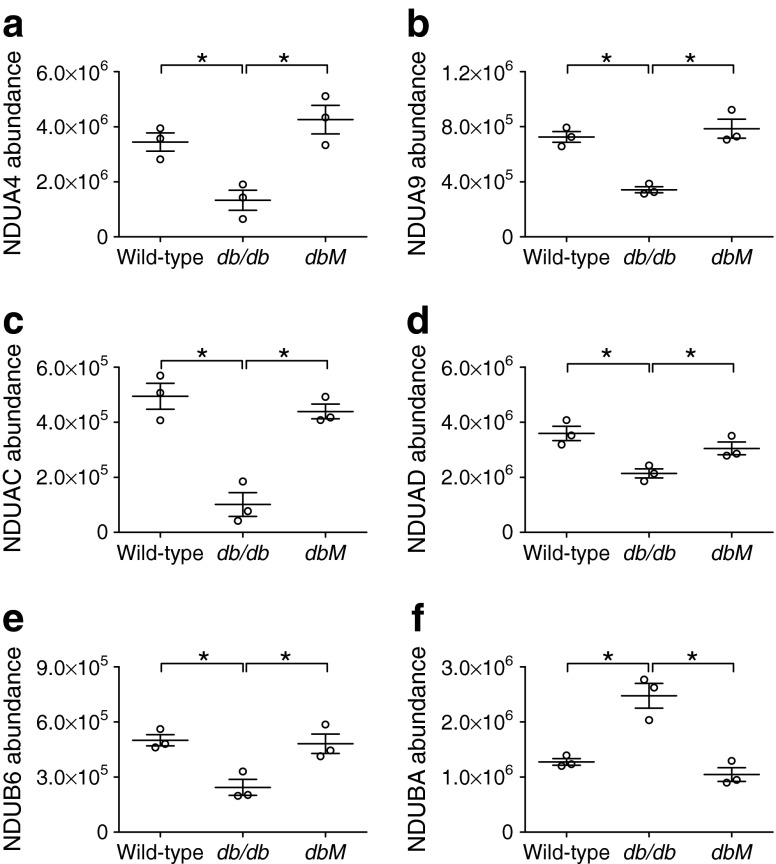
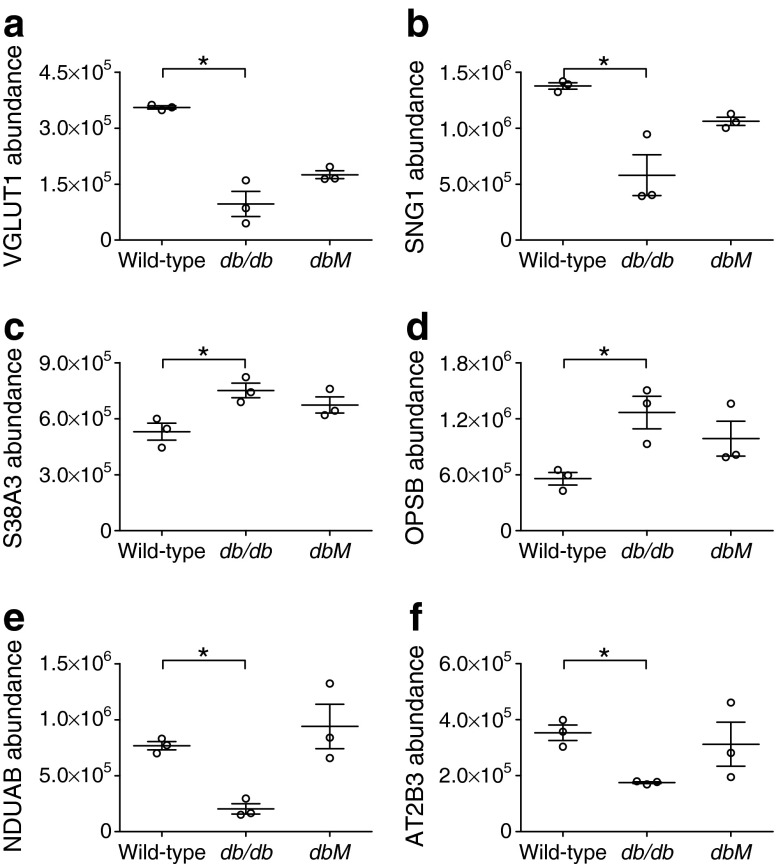
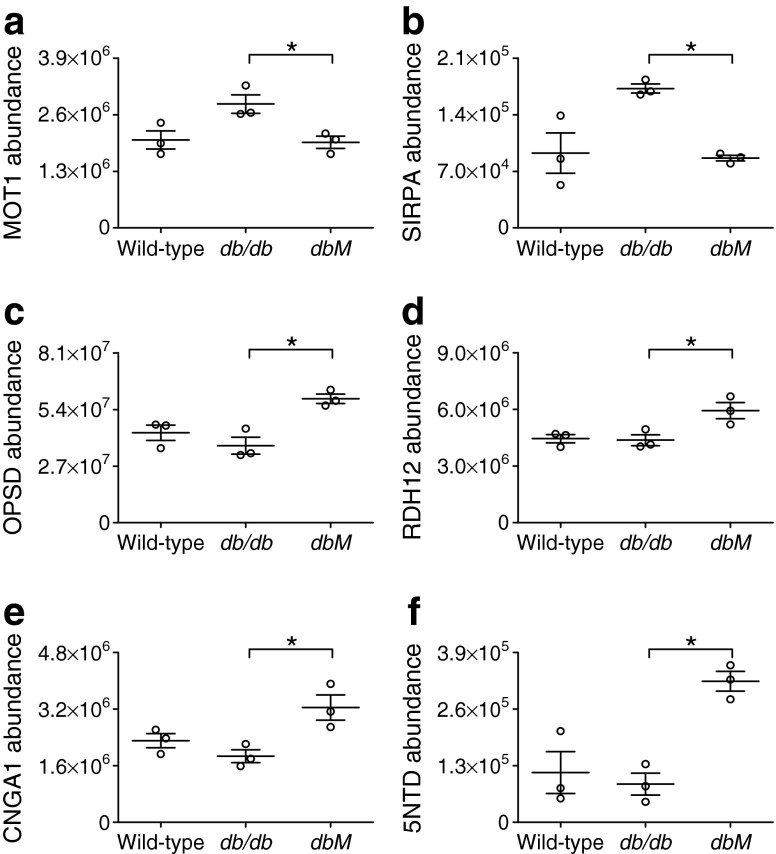
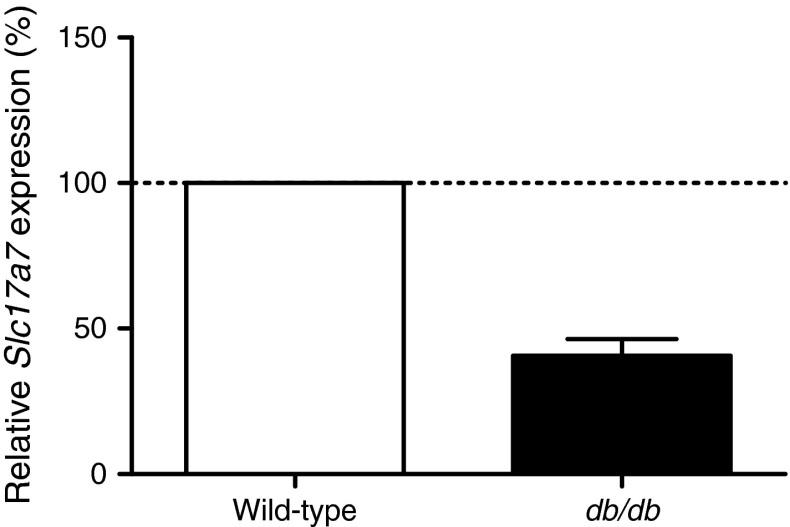
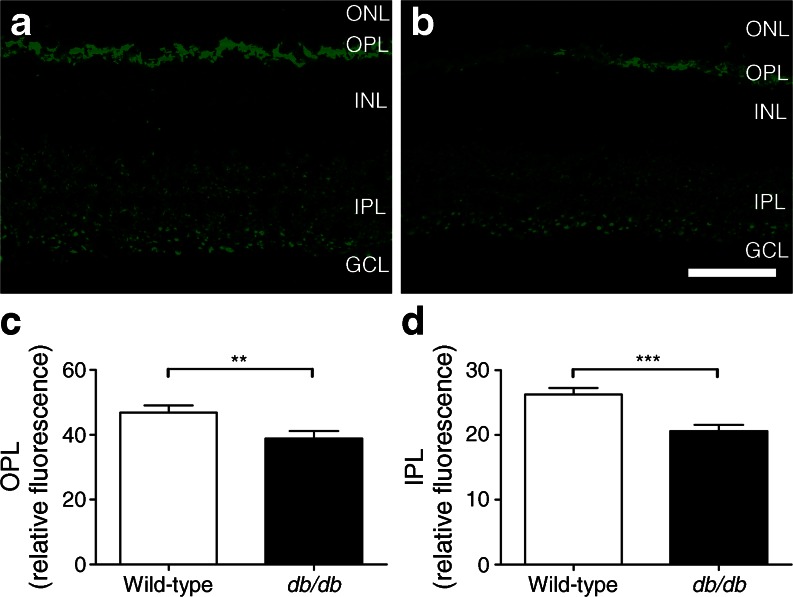
Results: A total of 98 proteins were significantly differentially abundant between db/db and wild-type animals. Pathway enrichment analysis indicated decreases in levels of proteins related to synaptic transmission and cell signalling. Metformin treatment produced 63 differentially abundant proteins compared with untreated db/db mice, of which only 43 proteins were found to occur in both datasets, suggesting that treatment only partially normalises the alterations induced by diabetes. VGLUT1, which is responsible for loading glutamate into synaptic vesicles, was found to be differentially abundant in db/db mice and was not normalised by metformin. The decrease in Slc17a7/VGLUT1 was confirmed by transcriptomic and immunocytochemical analysis.

Conclusions/interpretation: These findings expand the knowledge of the protein changes in diabetic retinopathy and suggest that membrane-associated signalling proteins are susceptible to changes that are partially ameliorated by treatment


Figures

Fig. 1
Fig. 1
(a) Body weight, (b) blood glucose and (c) HbA1c measurements for wild-type, db/db and dbM mice. db/db and dbM mice had significantly increased body weight compared with wild-type mice (wild-type 21.88 ± 0.371 g; db/db 52.36 ± 1.207 g; dbM 51.44 ± 1.013 g; p < 0.0001). Blood glucose was significantly increased in db/db and dbM mice (wild-type 5.899 ± 0.296 mmol/l; db/db 27.76 ± 0.625 mmol/l; dbM 22.05 ± 2.009 mmol/l; p < 0.0001), as were HbA1c values (wild-type 20.06 ± 0.400 mmol/mol; db/db 56.57 ± 2.543 mmol/mol; dbM 45.00 ± 2.400 mmol/mol; p < 0.0001). Diabetic db/db and dbM mice had similar body weight (p > 0.999), but dbM mice had significantly decreased blood glucose (p < 0.001) and HbA1c values (p < 0.001). **p < 0.001, ****p < 0.0001. To convert values for HbA1c in mmol/mol into %, multiply by 0.09148 and add 2.152, or use the conversion calculator at www.hba1c.nu/eng/
Fig. 2
Fig. 2
Interaction map of differentially abundant retinal proteins in diabetes. A total network was generated with GePS using functional word as connector. Proteins abbreviations are based on official gene symbols (NCBI Entrez Gene). Upregulated proteins are presented in green, downregulated proteins in red and network-extended proteins in grey. The network indicates a moderate degree of functional interaction among proteins affected by diabetes
Fig. 3
Fig. 3
Venn diagram showing the number of proteins identified in retinas from wild-type vs db/db (dark grey) and db/db vs dbM (light grey) mice. A total of 98 proteins were identified as being differentially abundant in diabetic vs non-diabetic mice. Metformin treatment produced 63 differentially abundant proteins from untreated diabetic mice. A total of 43 proteins were identified as occurring in both datasets (overlap; white)
Fig. 4
Fig. 4
Complex I proteins normalised by metformin treatment as measured by MS. NDUA4 (a), NDUA9 (b), NDUAC (c), NDUAD (d) and NDUB6 (e) abundances were significantly decreased in db/db mice compared with wild-type and dbM mice, while NDUBA (f) was increased. Levels of these proteins were comparable in dbM and wild-type mice. *p < 0.05. Protein abundances are arbitrary units
Fig. 5
Fig. 5
Selected non-significantly different proteins between db/db and dbM treatment groups, as measured by MS. While all of the proteins presented were significantly altered from wild-type levels, they were not significantly affected (p > 0.05) by metformin treatment. (a) VGLUT1, (b) SNG1, (c) S38A3, (d) OPSB, (e) NDUAB and (f) ATP2B3 protein abundance. *p < 0.05. Protein abundances are arbitrary units
Fig. 6
Fig. 6
Selected significantly different proteins between db/db and dbM treatment groups. Mass spectrometric measurements showed variations in the individual wild-type sample abundances of (a) monocarboxylate transporter 1(MOT1) and (b) signal-regulatory protein alpha (SIRPA), demonstrating that some proteins may not have been identified as significantly altered between wild-type and db/db measurements. However, metformin treatment did change the abundances of non-altered proteins, such as (c) OPSD, (d) RDH12, (e) CNGA1 and (f) 5NTD. *p < 0.05. Protein abundances are arbitrary units
Fig. 7
Fig. 7
Changes in Slc17a7 gene expression in a mouse model of diabetes. The mRNA level of Slc17a7 was decreased in diabetic retinas (db/db) compared with non-diabetic wild-type animals. Data are expressed as mean ± SD
Fig. 8
Fig. 8
Altered retinal VGLUT1 immunoreactivity in diabetes. Retinas from (a) wild-type and (b) diabetic mice were assessed for VGLUT1 immunolabelling. The intensity of VGLUT1 labelling was assessed in (c) the OPL and (d) the IPL. In wild-type retinas, VGLUT1 labelling was strongly present in the OPL with punctate labelling in the IPL. The intensity of VGLUT1 labelling appeared decreased in diabetic retinas in both layers. Quantification of fluorescence intensity indicated significant decreases in both the OPL (**p < 0.01) and the IPL (***p < 0.001). Scale bar: 50 μm. GCL, ganglion cell layer; INL, inner nuclear layer; ONL, outer nuclear layer

References

    1. King H, Aubert RE, Herman WH. Global burden of diabetes, 1995–2025: prevalence, numerical estimates, and projections. Diabetes Care. 1998;21:1414–1431. doi: 10.2337/diacare.21.9.1414. - DOI - PubMed
    1. Cusi K, Consoli A, DeFronzo RA. Metabolic effects of metformin on glucose and lactate metabolism in noninsulin-dependent diabetes mellitus. J Clin Endocrinol Metab. 1996;81:4059–4067. doi: 10.1210/jc.81.11.4059. - DOI - PubMed
    1. UKPDS Effect of intensive blood-glucose control with metformin on complications in overweight patients with type 2 diabetes (UKPDS 34) UK Prospective Diabetes Study (UKPDS) Group. Lancet. 1998;352:854–865. doi: 10.1016/S0140-6736(98)07037-8. - DOI - PubMed
    1. Stamler J, Vaccaro O, Neaton JD, Wentworth D. Diabetes, other risk factors, and 12-yr cardiovascular mortality for men screened in the Multiple Risk Factor Intervention Trial. Diabetes Care. 1993;16:434–444. doi: 10.2337/diacare.16.2.434. - DOI - PubMed
    1. Perneger TV, Brancati FL, Whelton PK, Klag MJ. End-stage renal disease attributable to diabetes mellitus. Ann Intern Med. 1994;121:912–918. doi: 10.7326/0003-4819-121-12-199412150-00002. - DOI - PubMed

Publication types

LinkOut - more resources