. 2014 Jan;42(1):205-23.
doi: 10.1093/nar/gkt866. Epub 2013 Sep 27.

Genome-wide profiling reveals stimulus-specific functions of p53 during differentiation and DNA damage of human embryonic stem cells

Affiliations

Genome-wide profiling reveals stimulus-specific functions of p53 during differentiation and DNA damage of human embryonic stem cells

Kadir C Akdemir et al. Nucleic Acids Res. 2014 Jan.

Abstract

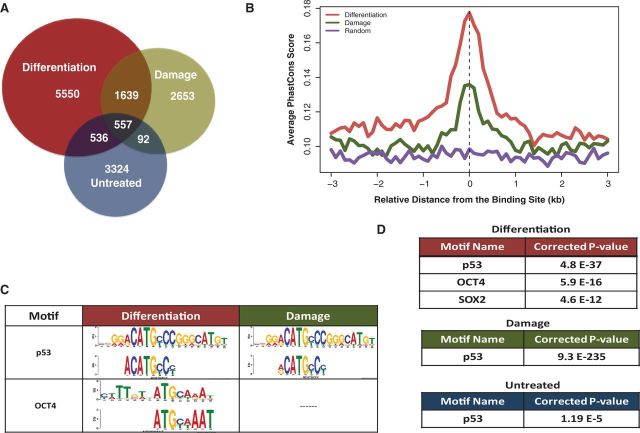
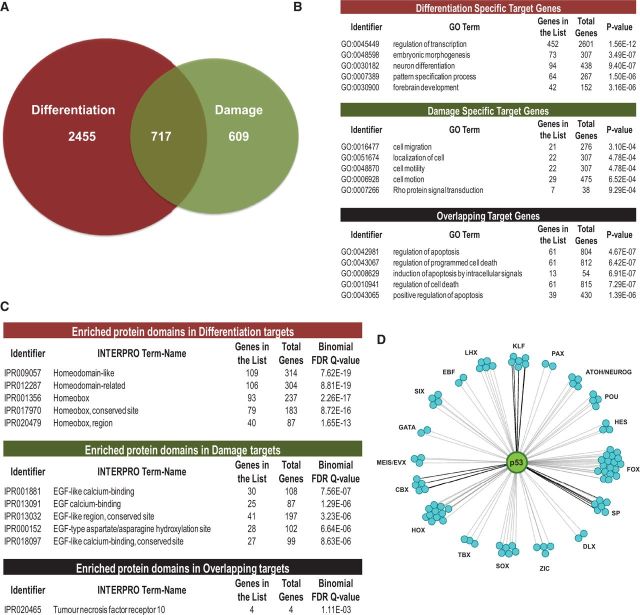
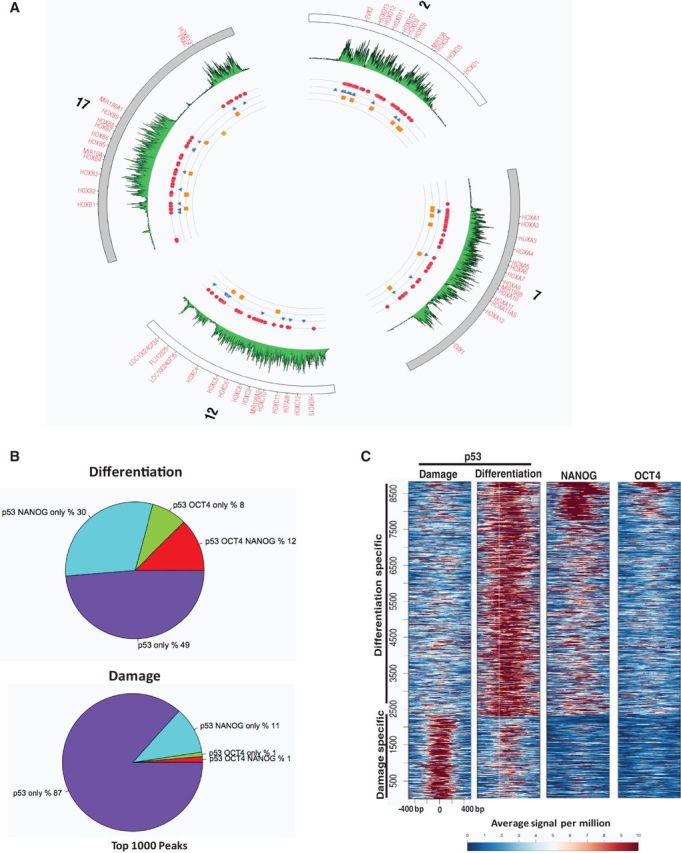
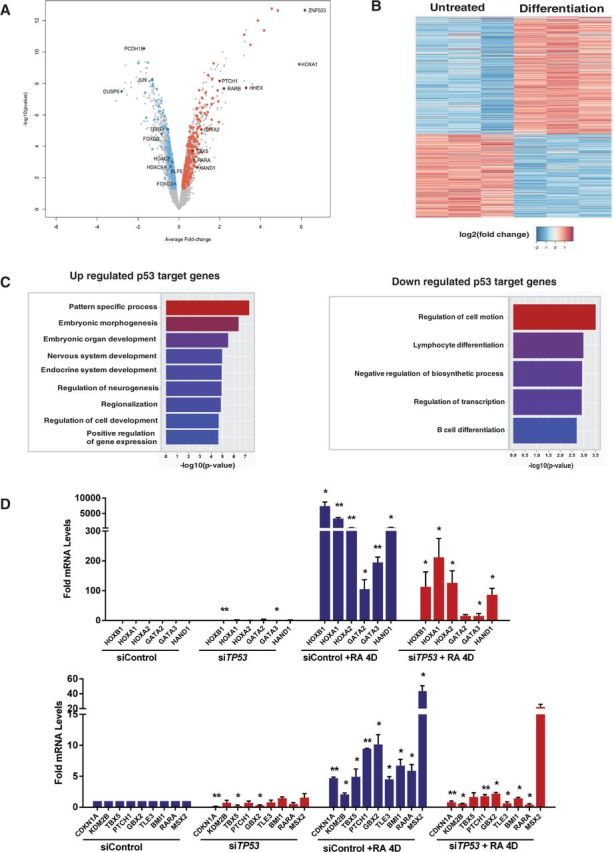
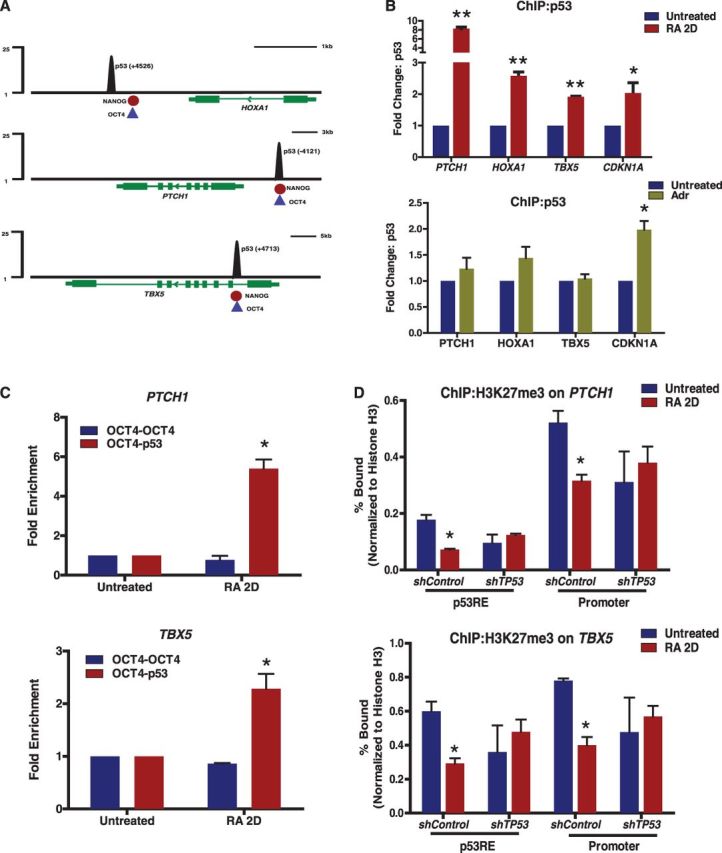
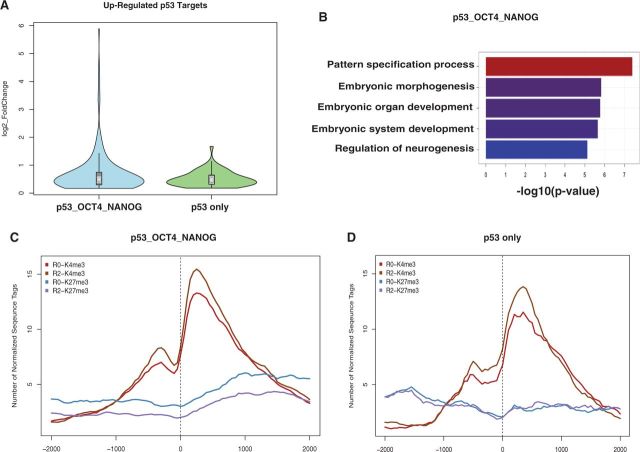
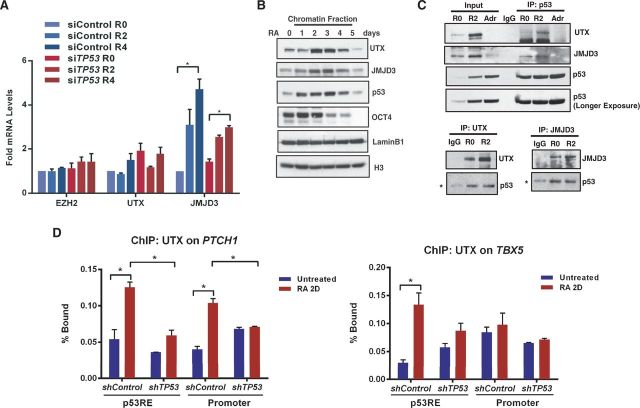
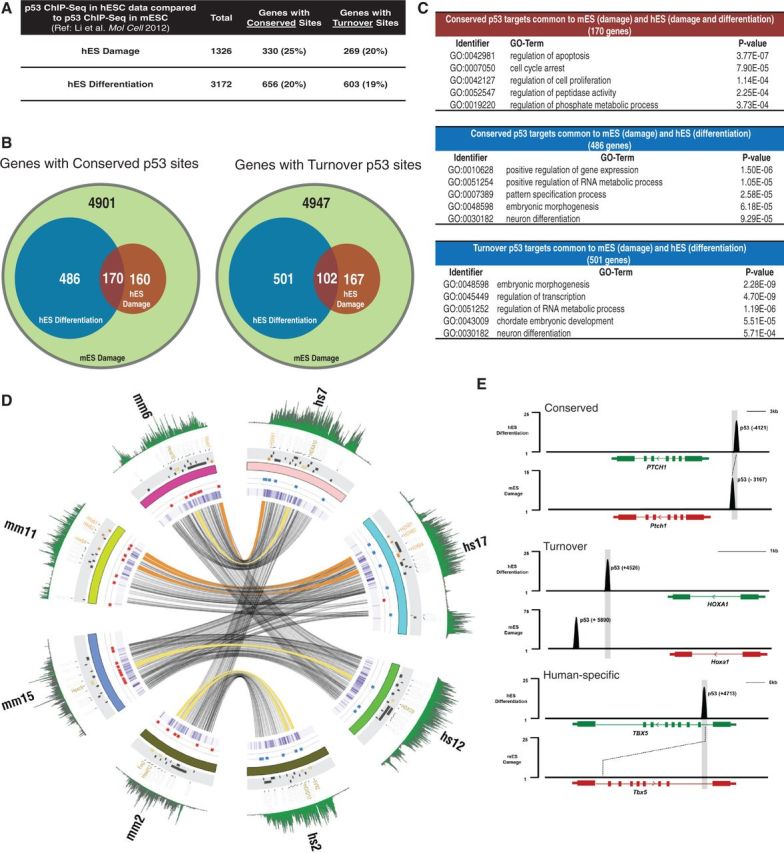
How tumor suppressor p53 selectively responds to specific signals, especially in normal cells, is poorly understood. We performed genome-wide profiling of p53 chromatin interactions and target gene expression in human embryonic stem cells (hESCs) in response to early differentiation, induced by retinoic acid, versus DNA damage, caused by adriamycin. Most p53-binding sites are unique to each state and define stimulus-specific p53 responses in hESCs. Differentiation-activated p53 targets include many developmental transcription factors and, in pluripotent hESCs, are bound by OCT4 and NANOG at chromatin enriched in both H3K27me3 and H3K4me3. Activation of these genes occurs with recruitment of p53 and H3K27me3-specific demethylases, UTX and JMJD3, to chromatin. In contrast, genes associated with cell migration and motility are bound by p53 specifically after DNA damage. Surveillance functions of p53 in cell death and cell cycle regulation are conserved in both DNA damage and differentiation. Comparative genomic analysis of p53-targets in mouse and human ESCs supports an inter-species divergence in p53 regulatory functions during evolution. Our findings expand the registry of p53-regulated genes to define p53-regulated opposition to pluripotency during early differentiation, a process highly distinct from stress-induced p53 response in hESCs.


Figures

Figure 1.
Figure 1.
Genome-wide mapping of p53 in hESC reveal distinct functional binding sites. (A) Comparison of genome occupancy of p53 in untreated, differentiation (RA 2 days) and damage (Adriamycin: Adr 6 h) induced hESCs. (B) Average PhastCons score profiles depicting conservation in the vicinity of p53-binding sites and randomly generated genomic loci (purple). (C and D) Associated p53, OCT4-SOX2 motifs within p53 enriched sites. (C) p53 and OCT4 consensus motif sequence from TRANSFAC database (top) and matching enriched motifs under p53 peaks (bottom). (D) The OCT4 motif is enriched in p53-bound regions in cells undergoing differentiation, but not in response to damage.
Figure 2.
Figure 2.
p53 targets developmental transcription factors during differentiation. (A) Numbers of distinct and overlapping p53-target genes in hESCs undergoing differentiation and DNA damage. (B) GO term analysis revealed significant and diverse functions of p53 downstream target genes that are specific or shared in response to each treatment. (C) Enrichment analysis of protein domains encoded by p53 downstream targets. Top categories from each data set are listed. (D) Gene families of developmental transcription factors are targets of p53 during differentiation. p53 (green circle) regulation is linked to individual transcription factors (cyan circles), shown grouped by family.
Figure 3.
Figure 3.
p53-binding sites coincide with ESC transcription factors during differentiation. (A) Circos plot of four human HOX gene clusters showing differential binding patterns of OCT4 (blue), NANOG (red), p53 (damage:yellow, differentiation:orange) and H3K27me3 (green). Numbers outside the circle is for specific human chromosome. (B) Overlap of p53 occupancy with OCT4 and NANOG in hESCs undergoing differentiation or damage. (C) Heat map of binding signals of p53, OCT4 and NANOG within −500 bp to +500 bp of p53 peak summits.
Figure 4.
Figure 4.
Transcription of development genes is dependent on p53. (A) Volcano plot of microarray gene-expression data. Each point corresponds to RefSeq gene; in RA-treated samples with average log2-fold change compared with pluripotent hESCs and negative log10 P-value scores. Colored points correspond to genes bound by p53: significantly up- (red) or downregulated (green) p53 targets are highlighted. Target genes overlapping with damage data sets are discarded. (B) Heat map, generated for differentiation-specific p53-target genes, reveals up- or downregulated targets during differentiation compared with pluripotent hESCs. (C) The GO term analysis of differentiation-specific up- or downregulated p53-target genes is shown. (D) RT-qPCR analyses of selected genes in hESCs after 4 days of RA treatment with TP53 or control non-targeting siRNA. Error bars represent SEM from three independent experiments (*P < 0.05, **P < 0.001). For determining statistical significance, data for untreated siTP53 are compared against untreated sicontrol; siControl + RA 4D treatment is compared with siControl; siTP53 + RA 4D treatment is compared with siControl + RA 4D.
Figure 5.
Figure 5.
Enrichment of p53 at developmental genes results in activation. (A) Tracks represent normalized p53 sequence tag enrichments (numbers indicate distance from TSS). Binding location of NANOG (red) and OCT4 (blue) are shown at the bottom of the tracks. (B) ChIP-qPCR analysis of p53 occupancy at selected target genes during differentiation (top) or DNA damage (bottom). (C) p53 enrichment on OCT4 bound regions after sequential ChIPs. Quantitative PCR of chromatin fragments enriched by p53, OCT4 and sequential ChIP of hESCs, treated with RA for 2 days. DNA enrichments at indicated target genes were determined as fold change in percentage input, compared with untreated hESCs. (D) Histone H3K27me3 status on gene promoter or p53RE of PTCH1 and TBX5 in hESCs treated with RA for 2 days. Error bars represent s.d. from three independent experiments (*P < 0.05, **P < 0.001).
Figure 6.
Figure 6.
p53 targets loss of repressive histone marks during differentiation. (A) Violin plots representing fold changes in expression of p53 targets upregulated during differentiation. Genes that have p53-binding sites overlapping with OCT4 and/or NANOG (p53_OCT4_NANOG) (blue); or only p53 binding sites (green). (B) The GO term analysis of overlapping targets of p53_OCT4_NANOG is shown. (C and D) Aggregate plots showing profiles of histone modifications around ± 2 kb from TSS of p53_OCT4_NANOG overlapping gene targets (C) and only p53 targets (D).
Figure 7.
Figure 7.
p53 interacts with JMJD3 and UTX. (A) RT-qPCR analyses of EZH2, UTX and JMJD3 in hESCs after 2 or 4 days of RA treatment with TP53 or control non-targeting siRNA. Error bars represent SEM from three independent experiments (*P < 0.05). (B) Chromatin fractions from hESCs undergoing RA-induced differentiation for 5 days were analyzed by western blotting. (C) Co-immunoprecipitation. Chromatin fractions from hESCs were immunoprecipitated with p53, UTX or JMJD3 antibodies and analyzed by western blotting (*Background IgG heavy chain). (D) ChIP-qPCR analysis of UTX occupancy at PTCH1 and TBX5 promoter in hESCs treated with RA for 2 days. Error bars represent s.d. from three independent experiments (*P < 0.05).
Figure 8.
Figure 8.
Comparison of p53-mediated transcriptional regulation of developmental genes in mouse and human ESCs. (A) Target genes are classified as ‘Conserved’ or ‘Turnover’ based on p53-binding sites to corresponding aligned regions in human and mouse genome. p53 binds to align regions in two species at Conserved targets; however, when p53 binding sites on orthologous genes do not align, those targets are categorized as Turnover genes. (B and C) Numbers of distinct and overlapping p53-target genes in mESCs during DNA damage (green) (49) with hESCs undergoing differentiation (blue) or DNA damage (red) and enriched GO-terms for each subset (C). (D) Circos plot of four human (hs) and mouse (ms) HOX gene clusters (HOXA, B, D and C) showing species-specific differential binding patterns of p53 (damage:Red, differentiation:Blue). Ribbons show syntenic genomic locations between mouse and human (orange:Conserved p53-targets, Yellow:Turnover p53-targets). Green tracks represent repressive H3K27me3 marks around the displayed regions in mouse and human ESCs. Tiles (black, orange or yellow) show RefSeq HOX gene annotations. Purple heat map depicts the Phastcons scores around the displayed regions. Numbers outside the circle is for specific human (hs) and mouse (mm) chromosomes. (E) Tracks represent normalized p53 sequence tag enrichments in differentiating human (top) and DNA-damaged mouse (bottom) ES cells at PTCH1, HOXA1 and TBX5 genomic locations (numbers indicate distance from TSS).

References

    1. Vousden KH, Prives C. Blinded by the light: the growing complexity of p53. Cell. 2009;137:413–431. - PubMed
    1. Spike BT, Wahl GM. p53, Stem Cells, and Reprogramming: tumor suppression beyond guarding the genome. Genes Cancer. 2011;2:404–419. - PMC - PubMed
    1. Lin T, Chao C, Saito S, Mazur SJ, Murphy ME, Appella E, Xu Y. p53 induces differentiation of mouse embryonic stem cells by suppressing Nanog expression. Nat. Cell. Biol. 2005;7:165–171. - PubMed
    1. Meletis K, Wirta V, Hede SM, Nister M, Lundeberg J, Frisen J. p53 suppresses the self-renewal of adult neural stem cells. Development. 2006;133:363–369. - PubMed
    1. Jain AK, Allton K, Iacovino M, Mahen E, Milczarek RJ, Zwaka TP, Kyba M, Barton MC. p53 regulates cell cycle and microRNAs to promote differentiation of human embryonic stem cells. PLoS Biol. 2012;10:e1001268. - PMC - PubMed

Publication types