. 2013 Dec;3(12):1364-77.
doi: 10.1158/2159-8290.CD-13-0183. Epub 2013 Sep 26.

A drug repositioning approach identifies tricyclic antidepressants as inhibitors of small cell lung cancer and other neuroendocrine tumors

Affiliations

A drug repositioning approach identifies tricyclic antidepressants as inhibitors of small cell lung cancer and other neuroendocrine tumors

Nadine S Jahchan et al. Cancer Discov. 2013 Dec.

Abstract

Small cell lung cancer (SCLC) is an aggressive neuroendocrine subtype of lung cancer with high mortality. We used a systematic drug repositioning bioinformatics approach querying a large compendium of gene expression profiles to identify candidate U.S. Food and Drug Administration (FDA)-approved drugs to treat SCLC. We found that tricyclic antidepressants and related molecules potently induce apoptosis in both chemonaïve and chemoresistant SCLC cells in culture, in mouse and human SCLC tumors transplanted into immunocompromised mice, and in endogenous tumors from a mouse model for human SCLC. The candidate drugs activate stress pathways and induce cell death in SCLC cells, at least in part by disrupting autocrine survival signals involving neurotransmitters and their G protein-coupled receptors. The candidate drugs inhibit the growth of other neuroendocrine tumors, including pancreatic neuroendocrine tumors and Merkel cell carcinoma. These experiments identify novel targeted strategies that can be rapidly evaluated in patients with neuroendocrine tumors through the repurposing of approved drugs.

Significance: Our work shows the power of bioinformatics-based drug approaches to rapidly repurpose FDA-approved drugs and identifies a novel class of molecules to treat patients with SCLC, a cancer for which no effective novel systemic treatments have been identified in several decades. In addition, our experiments highlight the importance of novel autocrine mechanisms in promoting the growth of neuroendocrine tumor cells.


Conflict of interest statement

Disclosure of Potential Conflicts of Interests: Patents have been filed and are pending on the use of specific tricyclic antidepressants in neuroendocrine tumors. A.B., J.D., J.S., and N.J. are inventors on the patent, and could benefit with royalties. The intellectual property has been licensed to NuMedii, a company further developing these drugs. A.B. and J.D. are founders and shareholders in NuMedii.

Figures

Figure 1
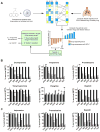
Figure 1. A bioinformatics-based drug repositioning approach identifies candidate drugs to inhibit SCLC
A, Schematic representation of the bioinformatics workflow for the repositioning approach used to identify potential candidate drugs for the treatment of SCLC. B, Representative MTT survival assays of cells cultured in 0.5% serum (n ≥ 3 independent experiments). A549 are NSCLC cells, H82, H69, and H187 are human SCLC cell lines, and Kp1, Kp2, and Kp3 are mouse SCLC cell lines. Cells were treated for 48 hours with 20μM clomipramine, 50μM imipramine, 30μM promethazine, 100μM tranylcypromine, 100μM pargyline, and 10μM bepridil. C, MTT survival assays of NSCLC (A549 and LKR13) and SCLC cells (H82, H69, H187, Kp1, Kp2, and Kp3) cultured in 2% serum (n>3 independent experiments) for 48 hours with 50μM imipramine, 30μM promethazine, and 10μM bepridil. Similar results were obtained in cells growing in dialyzed serum (data not shown). The black bars represent the vehicle-treated cells normalized to 100%. *P<0.05, **P<0.01, and ***P<0.001.
Figure 2
Figure 2. Inhibitory effects of imipramine, promethazine, and bepridil on SCLC allografts and xenografts
A, Strategy used for the treatment of mice growing SCLC allograft or xenograft tumors under their skin. NSG immunocompromised mice were subcutaneously implanted with one mouse SCLC cell line (Kp1) (B), one human SCLC cell line (H187) (C), and one primary patient-derived xenograft (PDX) human SCLC tumor (NJH29) (D). Tumor volume was measured at the times indicated of daily IP injections with vehicle control (saline; n=8 in (B), n=4 in (C), and n=12 in (D)), imipramine (25mg/kg; n=5 in (B), n=4 in (C), and n=12 in (D)), promethazine (25mg/kg; n=7 in (B), n=4 in (C), and n=9 in (D)), and bepridil (10mg/kg; n=7 in (B) and n=3 in (C)) (3 independent experiments in (B), 1 experiment in (C), and 2 independent experiments in (D)). Values are shown as mean ± s.e.m. The unpaired t-test was used to calculate the p-values of imipramine- and promethazine- treated tumors versus saline-treated tumors at different days of treatment. *P<0.05, **P<0.01, and ***P<0.001. Values that are not significant are not indicated. E, Representative images of the primary human SCLC xenografts (NJH29 cells) collected 24 days after daily treatment with saline, imipramine, and promethazine.
Figure 3
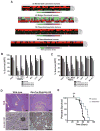
Figure 3. Imipramine and promethazine inhibit the growth of SCLC tumors in a pre-clinical mouse model
A, Strategy used for the treatment of Rb/p53/p130 mutant mice developing endogenous SCLC tumors. B, Representative photographs of whole lungs and corresponding hematoxylin and eosin (H&E) stained sections from mutant mice 6 months after Ad-Cre infection, one month after the beginning of treatment with saline, imipramine (25mg/kg), or promethazine (25mg/kg). C, Quantification of the tumor surface area (pixel area units quantified by ImageJ) of mutant mice treated with saline (n=10), imipramine (n=9), and promethazine (n=6) (from 5 independent experiments). The unpaired t-test was used to calculate the p-values of imipramine-treated (P=0.0017) and promethazine-treated (P=0.0008) mice compared to control TKO mice. D, Bar graph showing the percentage size distribution of the tumors from mutant mice injected with saline (n=10), imipramine (n=9), and promethazine (n=5). Values are shown as mean ± s.e.m. *P<0.05, **P<0.01, ***P<0.001, ns, not significant. E, Strategy used for the treatment of Rb/p53/p130;Rosa26lox-Stop-lox-Luciferase mice developing endogenous SCLC tumors and treated with saline and cisplatin weekly to generate chemonaïve and chemoresistant tumors. Deletion of the lox-Stop-lox cassette by Cre allows expression of the reporter and measurement of tumor volume. F, Fold change of the tumor volume measured by luciferase activity in saline- and cisplatin-treated mice. G, NSG mice were subcutaneously implanted with the saline-treated and cisplatin-treated mouse SCLC cells shown in (F) and the fold change of the tumor volume was measured at the times indicated of daily IP injections with vehicle control (Saline n=4) and imipramine (25mg/kg; n=4). Values are shown as mean ± s.e.m. The unpaired t-test was used to calculate the p-values of imipramine-treated versus Saline-treated chemonaïve and chemoresistant tumors at different days of treatment. *P<0.05, **P<0.01, and ***P<0.001. Values that are not significant are not indicated. H, Representative images of cisplatin- and saline-treated SCLC allografts collected 17 days after daily treatment.
Figure 4
Figure 4. Imipramine and promethazine induce the apoptotic cell death of SCLC cells through activation of Caspase 3
A, Representative immunoblotting of cleaved Caspase 3 (CC3) in mSCLC (Kp1) and hSCLC (H82) cells treated with 50μM imipramine for 12 hours. Karyopherin was used as a loading control. B, Representative immunostaining of CC3 in tumor sections (white dashed lines) from Rb/p53/p130 mutant mice treated daily with saline, imipramine, and promethazine for 30 consecutive days. C, Quantification of the percentage of CC3-positive cells per tumor area of saline- (n=142 tumors from 10 mice), imipramine- (n=153 tumors from 9 mice; P<0.0001), and promethazine- (n=103 from 6 mice; P<0.0001) treated tumors. D–E, Effects of the combined treatment of imipramine (50μM) and the pan-Caspase inhibitor Z-VAD-FMK on the survival of mSCLC (D) and hSCLC (E) after 24 hours of treatment, as measured by the MTT viability assay. Values from three independent experiments are shown as mean ± s.e.m. The paired t-test was used to calculate the p-values of imipramine-treated cells versus control DMSO-treated cells and of imipramine-treated cells versus Z-VAD-FMK- treated cells combined with imipramine. The black bars represent the vehicle-treated cells normalized to 100%. *P<0.05, **P<0.01, ***P<0.001, ns, not significant. F, Quantification of the percentage of mSCLC cells (Kp1 and Kp3) with low Ca2+ levels by FACS analysis of control untreated cells (Ctrl) and imipramine-treated cells at the times indicated. Values from three independent experiments for each cell line are shown as mean ± s.e.m. The unpaired t-test was used to calculate the p-values of imipramine-treated cells versus the untreated control cells at the times indicated. *P<0.05, **P<0.01, ***P<0.001, ns, not significant. G, Representative immunoblotting of p-c-Jun, total c-Jun, p-JNK, and total JNK in mSCLC cells (Kp1) treated with 50μM imipramine for the indicated times. Tubulin was used as a loading control. H, Representative immunoblotting of p-c-Jun, total c-Jun, p-JNK, and total JNK in mSCLC cells (Kp1 and H82) and NSCLC cells (LKR13 and A549) treated with 50μM imipramine for 1 hour. Tubulin was used as a loading control. I, Effects of the combined treatment of 50μM imipramine and 500nM of the JNK inhibitor SP600125 on mSCLC cells (Kp1) after 24 hours of treatment, as measured by the MTT viability assay. Values from three independent experiments are shown as mean ± s.e.m. The unpaired t-test was used to calculate the p-values of imipramine-treated cells versus control DMSO-treated cells and of imipramine-treated cells versus SP600125-treated cells combined with imipramine. *P<0.05 and ***P<0.001.
Figure 5
Figure 5. The candidate drugs inhibit the expansion of SCLC cells via several GPCRs
A–B, MTT viability assays of cells cultured at 2% serum (n≥3 independent experiments) and treated with the ADRA1 antagonist doxazosin mesylate in comparison to treatment with imipramine (Imip) for 48 hours (A) and with increasing doses of epinephrine (Epi) in the absence or presence of 50μM imipramine (Imip) or 30μM promethazine (Prom) (B). The paired t-test was used to calculate the p-values of epinephrine-, imipramine- and promethazine- treated cells versus control cells and of imipramine- and promethazine- treated cells versus epinephrine- treated cells combined with imipramine or promethazine. *P<0.05, **P<0.01, ns, not significant. C, MTT viability assay for mSCLC (Kp1) and mNSCLC (LKR13) cells following 48 hours of treatment with increasing doses of the PKC inhibitor GF109203X. Values from three independent experiments are shown as mean ± s.e.m. The unpaired t-test was used to calculate the p-values of the drug-treated cells versus control cells. *P<0.05, ns, not significant. D, MTT viability assay for mSCLC (Kp1) cells following 24 hours of treatment with 50μM imipramine alone and with increasing doses of PMA in the absence or presence of 50μM imipramine. The unpaired t-test was used to calculate the p-values of DMSO-treated cells versus PMA-treated cells and of imipramine-treated cells versus PMA-treated cells combined with imipramine. ns, not significant. E, Representative immunoblotting of p-PKC, total PKC, p-CREB, and total CREB in mSCLC cells (Kp1) untreated and treated with 50μM imipramine for 30 minutes. Tubulin was used as a loading control. F–G, MTT viability assay for mSCLC (Kp1) and mNSCLC (LKR13) cells following 48 hours of treatment with increasing doses of the adenyl cyclase inhibitor KH7 (F) and the PKA inhibitor H89 dihydrochloride (G). Values from three independent experiments are shown as mean ± s.e.m. The unpaired t-test was used to calculate the p-values of the drug-treated cells versus control cells. *P<0.05, **P<0.01, ***P<0.001, ns, not significant. H, MTT viability assay for mSCLC (Kp1) and hSCLC (H187) cells following 24 hours of treatment with 50μM forskolin (FSK), 100μM IBMX, or both drugs combined. The unpaired t-test was used to calculate the p-values of the drug-treated cells versus control DMSO-treated cells. ns, not significant. I, Effects of the combined treatment of 50μM imipramine and 50μM FSK alone, 100μM IBMX alone, or FSK and IBMX together, as measured by the MTT viability assay. Values from at least three independent experiments are shown as mean ± s.e.m. The unpaired t-test was used to calculate the p-values of imipramine-treated cells versus control DMSO-treated cells and of imipramine-treated cells versus FSK-, IBMX-, and FSK+IBMX-treated cells combined with imipramine. J, Representative immunoblotting of p-c-Jun and total c-Jun in mSCLC cells (Kp1) untreated, treated with 50μM imipramine for 30 minutes in the absence or presence of 50μM forskolin (FSK) and 100μM IBMX, and treated with DMSO. Tubulin was used as a loading control. The black bars in all the MTT assays represent the vehicle-treated cells normalized to 100%.
Figure 6
Figure 6. Tricyclic antidepressants inhibit the growth of several other types of neuroendocrine tumors
A, Heat maps showing the normalized RNA expression levels of the Histamine 1 Receptor (H1R), the Muscarinic Acetylcholine receptor isoform 3 (CHRM3), the Alpha1a and Alpha1b Adrenergic Receptors (ADRA1a and ADRA1b), and the Serotonin Receptor 2A (HTR2) in 35 human primary Merkel Cell Carcinoma tumors, 42 Midgut carcinoid tumors, 76 Pheochromocytoma tumors, and 88 Neuroblastoma tumors. B–C, MTT viability assays of human Pancreatic Adenocarcinoma (PDAC), mouse Pancreatic Neuroendocrine tumors (PNET), human Neuroblastoma (NB), human Merkel Cell Carcinoma (MCC), human large cell adenocarcinoma (LCLC) and neuroendocrine large cell carcinoma (NE-LCLC) cultured in low serum and treated with increasing doses of imipramine (B) and promethazine (C) for 48 hours. Values from three independent experiments are shown as mean ± s.e.m. *P<0.05, **P<0.01, ***P<0.001, ns, not significant. D, Representative H&E images (top) and insulin IHC (bottom) of sections from the pancreas of wild-type and Rip-Cre Rb/p53/p130 (RIPCre-TKO) mutant mice. Scale bar is 50μm. E, Survival curve generated from the Rip-Cre Rb/p53/p130 mice treated daily with IP injections of saline and imipramine starting at day 35 after birth; median survival is 58 days for saline- and 74.5 days for imipramine-treated mutant mice; p=0.024 by the Mantel-Cox test).

Comment in

Similar articles

Cited by

References

    1. Ashburn TT, Thor KB. Drug repositioning: identifying and developing new uses for existing drugs. Nature reviews Drug discovery. 2004;3:673–83. - PubMed
    1. Li YY, An J, Jones SJ. A computational approach to finding novel targets for existing drugs. PLoS Comput Biol. 2011;7:e1002139. - PMC - PubMed
    1. Yang L, Agarwal P. Systematic drug repositioning based on clinical side-effects. PLoS ONE. 2011;6:e28025. - PMC - PubMed
    1. Dudley JT, Sirota M, Shenoy M, Pai RK, Roedder S, Chiang AP, et al. Computational repositioning of the anticonvulsant topiramate for inflammatory bowel disease. Sci Transl Med. 2011;3:96ra76. - PMC - PubMed
    1. Sirota M, Dudley JT, Kim J, Chiang AP, Morgan AA, Sweet-Cordero A, et al. Discovery and preclinical validation of drug indications using compendia of public gene expression data. Sci Transl Med. 2011;3:96ra77. - PMC - PubMed

Publication types

MeSH terms

Substances