. 2013 Oct 1:14:667.
doi: 10.1186/1471-2164-14-667.

RNA-Seq of Bacillus licheniformis: active regulatory RNA features expressed within a productive fermentation

Affiliations

RNA-Seq of Bacillus licheniformis: active regulatory RNA features expressed within a productive fermentation

Sandra Wiegand et al. BMC Genomics. .

Abstract

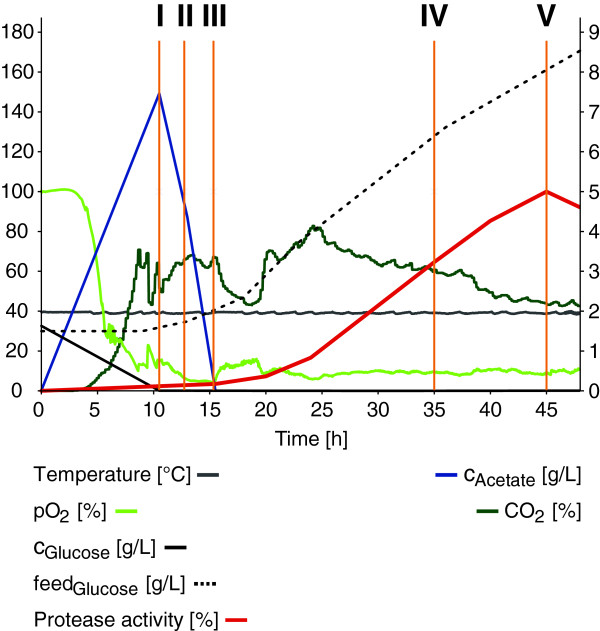
Background: The production of enzymes by an industrial strain requires a complex adaption of the bacterial metabolism to the conditions within the fermenter. Regulatory events within the process result in a dynamic change of the transcriptional activity of the genome. This complex network of genes is orchestrated by proteins as well as regulatory RNA elements. Here we present an RNA-Seq based study considering selected phases of an industry-oriented fermentation of Bacillus licheniformis.

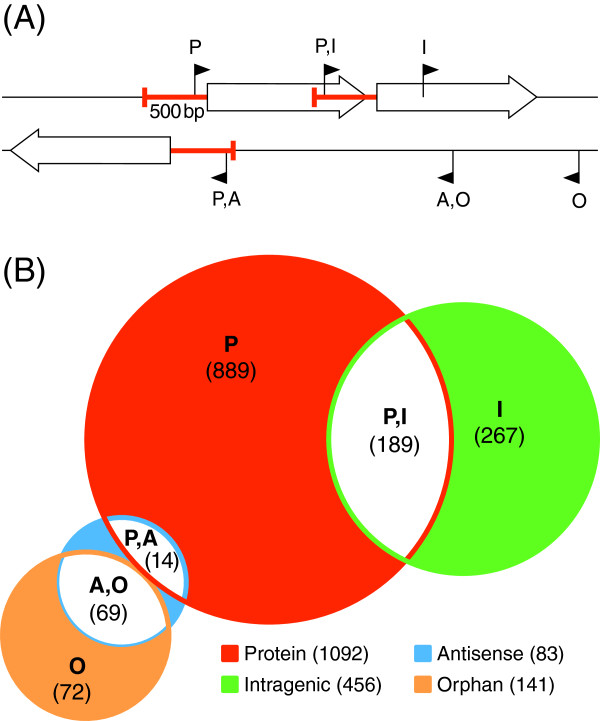
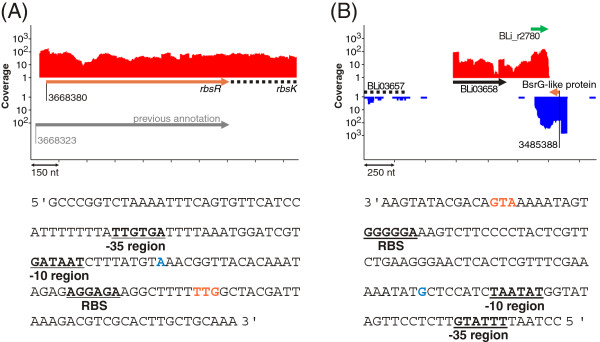
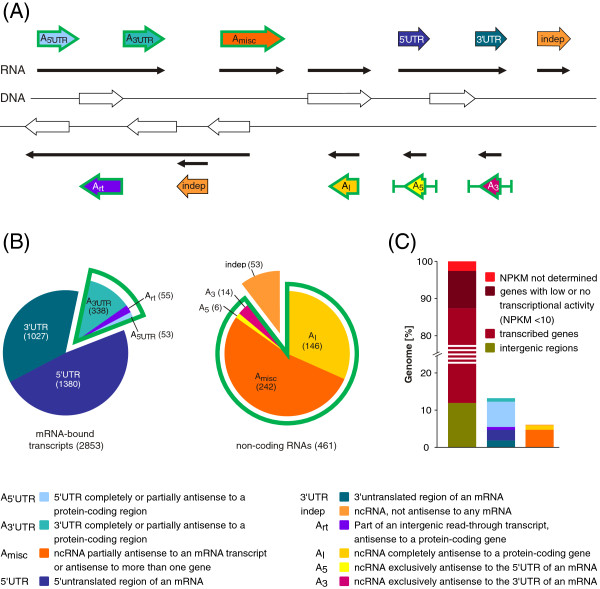
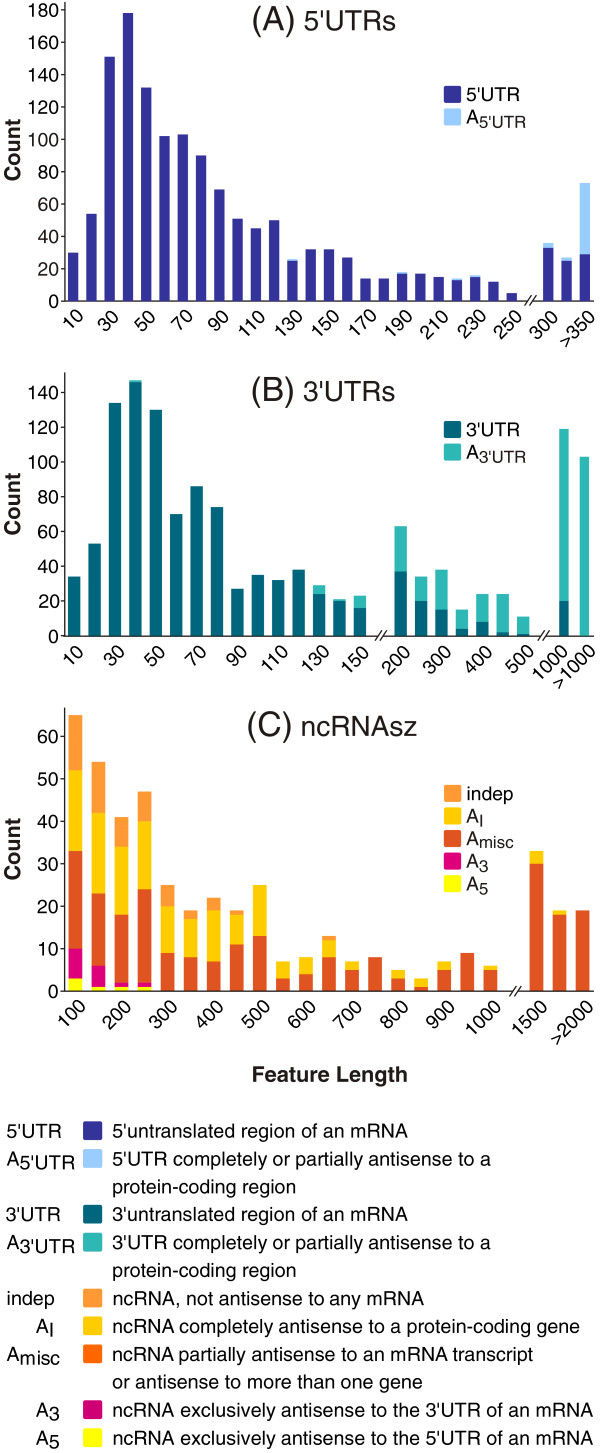
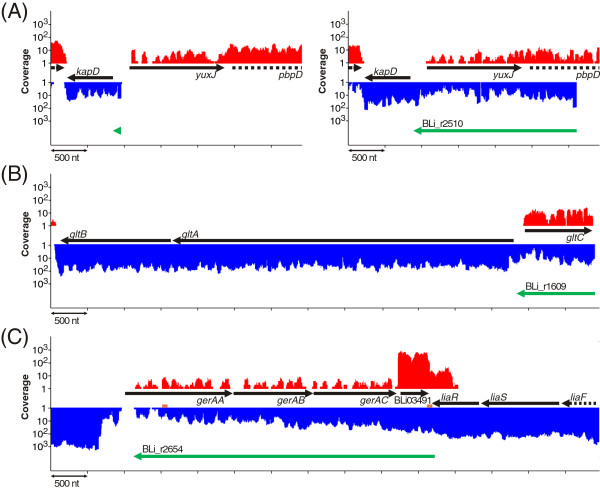
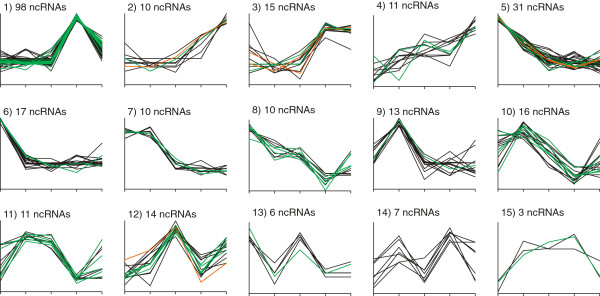
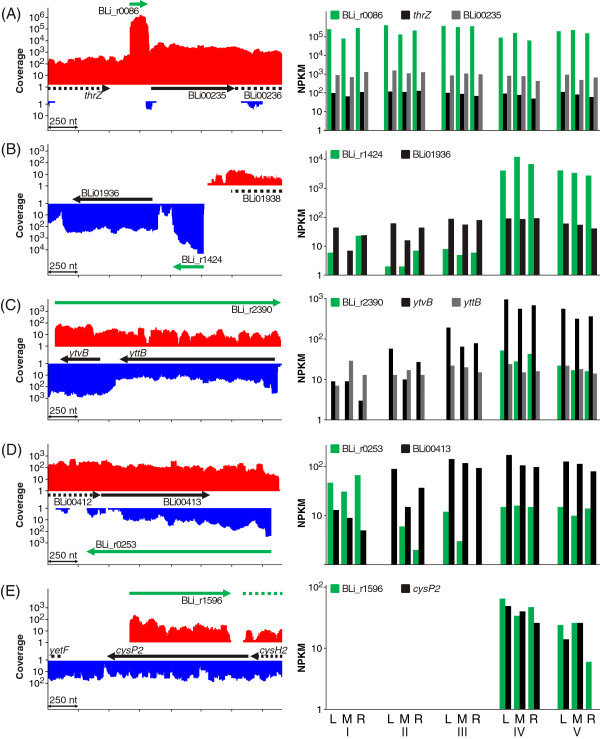
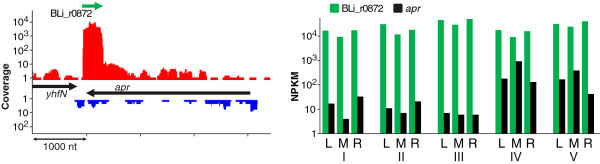
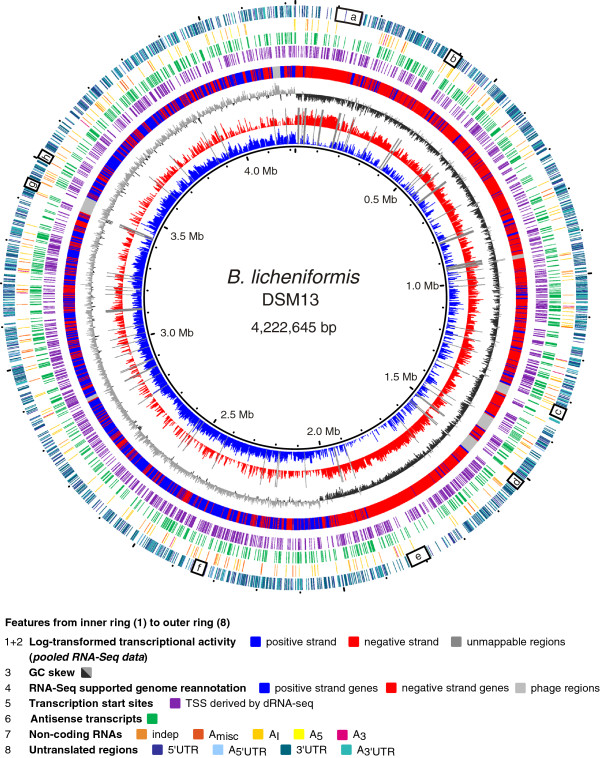
Results: A detailed analysis of 20 strand-specific RNA-Seq datasets revealed a multitude of transcriptionally active genomic regions. 3314 RNA features encoded by such active loci have been identified and sorted into ten functional classes. The identified sequences include the expected RNA features like housekeeping sRNAs, metabolic riboswitches and RNA switches well known from studies on Bacillus subtilis as well as a multitude of completely new candidates for regulatory RNAs. An unexpectedly high number of 855 RNA features are encoded antisense to annotated protein and RNA genes, in addition to 461 independently transcribed small RNAs. These antisense transcripts contain molecules with a remarkable size range variation from 38 to 6348 base pairs in length. The genome of the type strain B. licheniformis DSM13 was completely reannotated using data obtained from RNA-Seq analyses and from public databases.

Conclusion: The hereby generated data-sets represent a solid amount of knowledge on the dynamic transcriptional activities during the investigated fermentation stages. The identified regulatory elements enable research on the understanding and the optimization of crucial metabolic activities during a productive fermentation of Bacillus licheniformis strains.


Figures

Figure 1
Figure 1
Protease production and process parameters. Process parameters are shown for fermentation L (the parameters for the replicate fermentations R and M are corresponding, data not shown). Temperature T [°C], oxygen partial pressure pO2 [%], glucose concentration cGlucose [g/L], supplied glucose feedGlucose [g/L] and normalized protease activity [%] are displayed on left y-axis, whereas acetate concentration cAcetate [g/L] and carbon dioxide content CO2 [%] are scaled on the right y-axis. Process time t [h] is given on the x-axis. The sampling points I to V are indicated by orange lines.
Figure 2
Figure 2
Classification and distribution of TSS. (A) Classification scheme of transcription start sites adapted from Dötsch et al. [34]. White arrows indicate genes. P: Protein-coding gene-dependent TSS located within a 500 bp range upstream of annotated start codons. I: Intragenic TSS situated within an annotated gene on the same strand. A: TSS localized antisense to an annotated gene. O: Orphan TSS not located in a promoter region or a gene on the same strand. (B) Distribution of transcription start sites identified in this study. Numbers in brackets give the amount of instances for each class. Numbers in the legend give the total amount of every class.
Figure 3
Figure 3
Correction and insertion of annotated genes. (A) Correction of start codons. (Upper panel) Transcriptional activity of pooled RNA-Seq data. The grey arrow displays the coordinates of the ribose operon repressor RbsR (BLi03840) according to Veith et al. [1]. Based on the transcriptional data, the start codon has been reassigned 57 bp downstream of the former position (orange arrow). (Lower panel) The new start codon is marked in orange and the transcription start site in blue. The location of patterns of a ribosomal binding site and -10 and -35 regions of the rbsR- regulating σA upstream of the gene provide additional confirmation to the new annotation. (B) Insertion of new genes. (Upper panel) Transcriptional activities (sample L-I) of BLi03658 (black arrow) and indep RNA BLi_r2780 (green arrow). The previously not detected [1,9] protein gene BLi05038 (orange arrow) was annotated as BsrG-like peptide (see also chapter Comparative transcriptomics). (Lower panel) The start codon of the new gene is marked in orange, and the transcription start site in green. The location of patterns of a ribosomal binding site and a σA -10 and -35 promoter region provide additional confirmation of the new annotation.
Figure 4
Figure 4
Classification and distribution of RNA features. (A) Classification scheme of ten RNA feature classes. White arrows indicate CDS and black arrows represent RNA transcripts. All antisense transcripts are framed green. RNA features which are part of an mRNA are denoted 5’UTRs or 3’UTRs. Antisense transcripts that are mRNA-bound were classified as A5’UTR, A3’UTR and Art. Non-coding antisense transcripts were classified as A5, A3 and AI and comprise antisense transcripts opposite to 5’ and 3’UTRs or to protein-coding regions of the mRNA. Amisc designates antisense ncRNAs that target more than one gene or are only partially antisense. Independently transcribed ncRNAs without any antisense localization are designated indep. (B) Quantitative affiliation of identified RNA features. (C)(Left) Proportional distribution of intergenic regions or annotated genes with different transcriptional activities within the complete B. licheniformis DSM13 genome. (Middle + Right) Percentage of the total genome covered by the defined RNA classes.
Figure 5
Figure 5
Length distribution of RNA features. Size range of (A) 1433 identified 5’ untranslated regions, (B) 1365 identified 3’ untranslated regions and (C) 461 identified non-coding RNAs. Please note that the classification scheme corresponds to Figure 4.
Figure 6
Figure 6
Untranslated regions (UTRs). Transcriptional activities of UTR regions. Black arrows indicate genes and green arrows the identified UTRs. (A) 5’UTR of kapD at sampling point II (left) and sampling point IV (right). (B) 5’UTR BLi_t1609 at sampling point IV. (C) 3’UTR BLi_r2654 (pooled RNA-Seq data). Predicted terminator sequences are marked orange.
Figure 7
Figure 7
Cluster analysis of ncRNA expression profiles. Expression profiles of ncRNAs after k-means clustering (Additional file 2: Table S13). The x-axis shows sampling points I to V from left to right and the y-axis gives the expression strength in z-score transformed mean NPKM values of each replicate. Clusters are numbered and captioned with the count of included ncRNAs. Transcripts with a maximal NPKM value >100,000 are marked in orange and transcripts with a maximal NPKM value >1000 are marked in green.
Figure 8
Figure 8
Non-coding RNAs (ncRNAs).(Left) Sum of transcriptional activities from all 15 replicates (pooled RNA-Seq data). Black arrows indicate genes and green arrows the identified ncRNAs. (Right) Log-transformed NPKM values of ncRNAs and adjacent genes for single samples. (A)Indep RNA BLi_r0086 is transcribed constitutively with a length of 156 nt and located between the genes of threonyl-tRNA synthetase (thrZ, BLi00234) and a hypothetical protein (BLi00235). Both adjacent genes are also transcribed constitutively, but are less abundant by four and three orders of magnitude, respectively. (B) The differentially expressed indep transcript BLi_r1424 is located between the gene of a hypothetical protein (BLi01936) and a pseudogene (yobN, BLi01938) with a length of 251 nt. The TSS could be confirmed by dRNA-Seq. In the three early conditions the BLi_r1424 transcription level is low, but NPKM values of more than 12,000 were recorded during the productive stages of the fermentation process. A direct transcriptional connection to the adjacent BLi01936 is not visible from the shown NPKM values. (C) BLi_r2390 antisense to ytvB (BLi03176) and yttB (BLi03177) is an example for long antisense ncRNAs. The Amisc RNA occurs only in the later stages of the fermentation process, parallel to a distinct increase in transcriptional activity of ytvB, but does not exceed it regarding the NPKM value. (D) One example suggesting a regulatory function of Amisc RNAs is BLi_r0253, oriented antisense to BLi00413. In the earliest stage the asRNA shows stronger transcription than the corresponding gene, but in all later stages the asRNA is only weakly transcribed. This might indicate a silencing effect in the exponential stage. (E)AI RNA BLi_r1596 localized antisense to the gene of the sulfate permease CysP2 (BLi02153). The transcription of both, the ncRNA and the protein-coding gene, starts during the late stages of the fermentation process.
Figure 9
Figure 9
Antisense RNA against Subtilisin Carlsberg.(Left) Transcriptional activities (sample L-III) of apr, the gene which encodes Subtilisin Carlsberg, and the AI RNA BLi_r0872 (green), which is antisense to the 3’UTR of apr. (Right) Log-transformed NPKM values of BLi_r0872 and apr.
Figure 10
Figure 10
Circular plot of transcriptional activity and identified RNA features. Combined depiction of reannotated genes and transcriptional activity of B. licheniformis. Unmappable regions, GC skew, transcription start sites, non-coding RNAs, untranslated regions and antisense transcripts are also shown. 5’UTRs and 3’UTRs are evenly distributed over the whole chromosome of B. licheniformis, except for regions a – h: these regions contain long operon structures (a: ribosomal superoperon, b: lch operon, e: fla/che operon, f: trp operon, h: eps operon) or prophage regions with low transcriptional activity (c, d and g). The classification scheme corresponds to Figure 4. (indep) ncRNA, not antisense to any mRNA; (Amisc) ncRNA partially antisense to an mRNA transcript or antisense to more than one gene; (Ai) ncRNA completely antisense to a protein-coding gene; (A5) ncRNA exclusively antisense to the 5'UTR of an mRNA; (A3) ncRNA exclusively antisense to the 5'UTR of an mRNA; (5'UTR) 5'untranslated region of an mRNA; (A5'UTR) 5'UTRs completely or partially antisense to a protein-coding region; (3'UTR) 3'untranslated region of an mRNA transcript; (A3'UTR) 3'UTRs completely or partially antisense to a protein-coding region.

References

    1. Veith B, Herzberg C, Steckel S, Feesche J, Maurer K-H, Ehrenreich P, Bäumer S, Henne A, Liesegang H, Merkl R, Ehrenreich A, Gottschalk G. The complete genome sequence of Bacillus licheniformis DSM13, an organism with great industrial potential. J Mol Microbiol Biotechnol. 2004;7:204–211. doi: 10.1159/000079829. - DOI - PubMed
    1. Schallmey M, Singh A, Ward O. Developments in the use of Bacillus species for industrial production. Can J Microbiol. 2004;50:1–17. doi: 10.1139/w03-076. - DOI - PubMed
    1. Maurer K-H. Detergent proteases. Curr Opin Biotechnol. 2004;15:330–334. doi: 10.1016/j.copbio.2004.06.005. - DOI - PubMed
    1. Çalık P, Takac S, Çalık G, Özdamar T. Serine alkaline protease overproduction capacity of Bacillus licheniformis. Enzyme Microb Tech. 2000;26:45–60. doi: 10.1016/S0141-0229(99)00126-X. - DOI
    1. Çalık P, Çalık G, Takaç S, Ozdamar TH. Metabolic flux analysis for serine alkaline protease fermentation by Bacillus licheniformis in a defined medium: effects of the oxygen transfer rate. Biotechnol Bioeng. 1999;64:151–167. doi: 10.1002/(SICI)1097-0290(19990720)64:2<151::AID-BIT4>3.0.CO;2-U. - DOI - PubMed

Publication types

MeSH terms

LinkOut - more resources