. 2014 Feb;16(2):214-31.
doi: 10.1111/cmi.12216. Epub 2013 Oct 17.

Streptococcal co-infection augments Candida pathogenicity by amplifying the mucosal inflammatory response

Affiliations
Free PMC article

Streptococcal co-infection augments Candida pathogenicity by amplifying the mucosal inflammatory response

H Xu et al. Cell Microbiol. 2014 Feb.
Free PMC article

Abstract

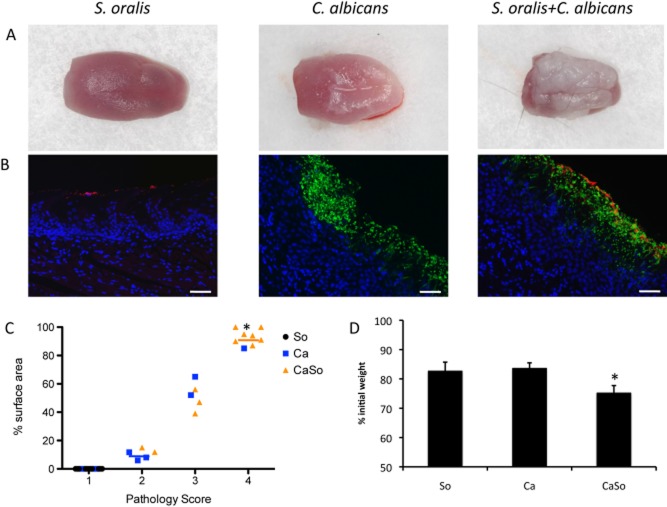
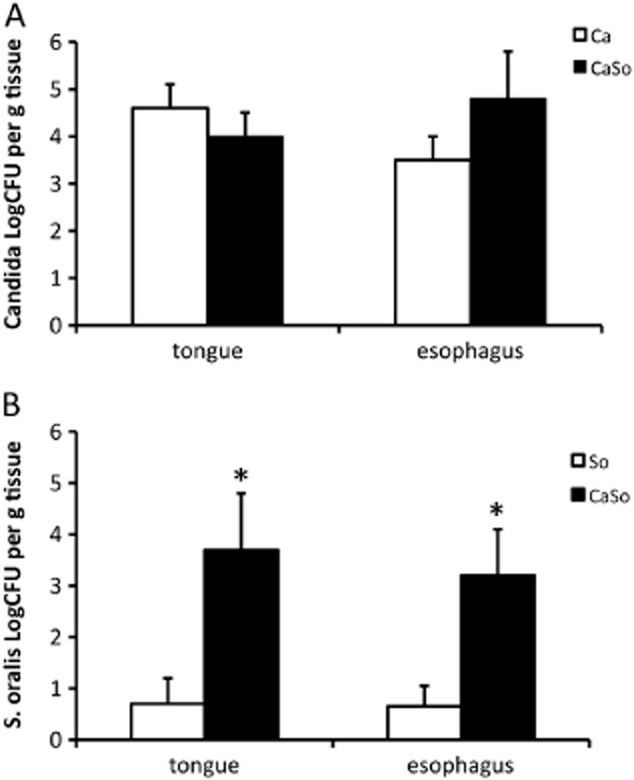
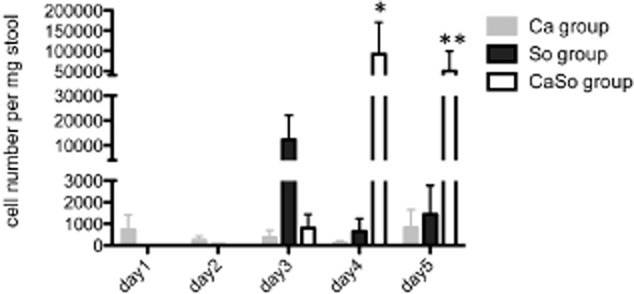
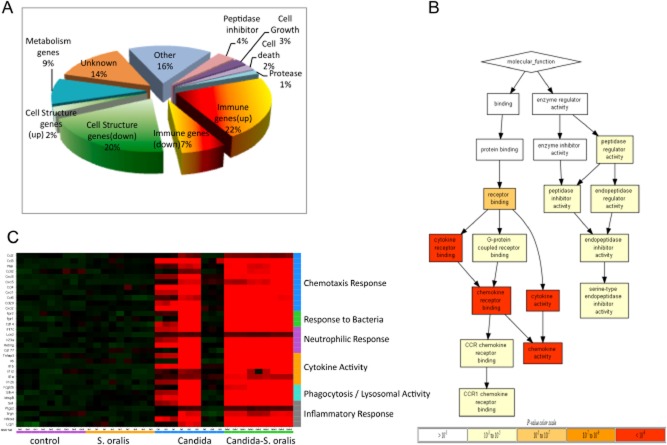
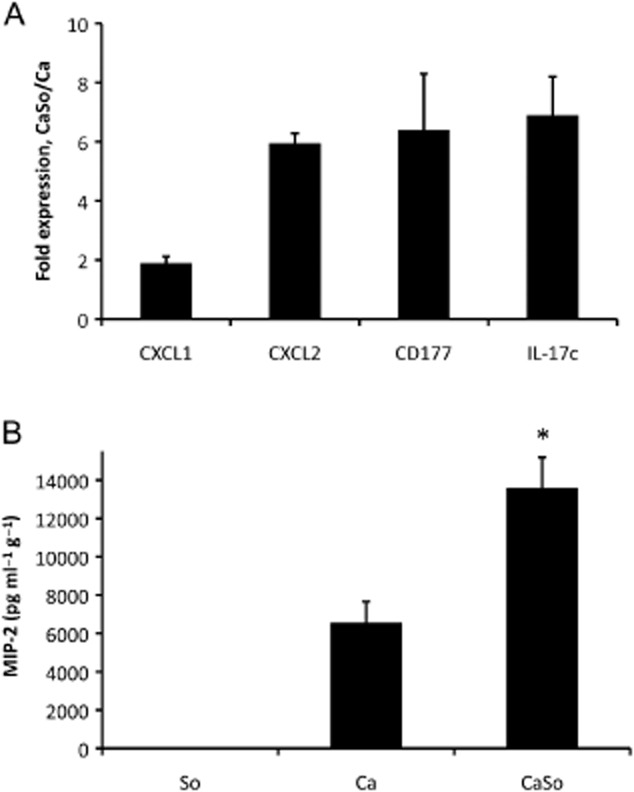
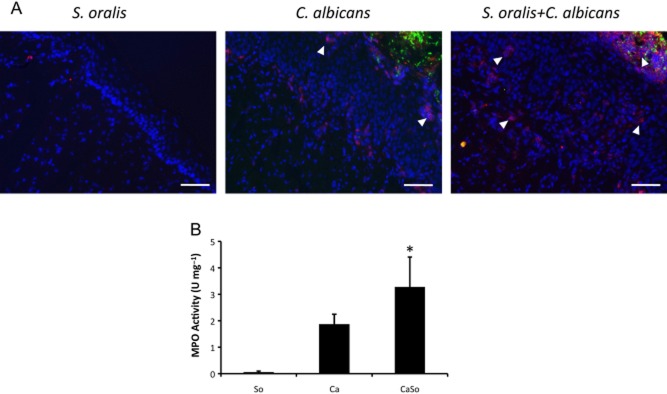
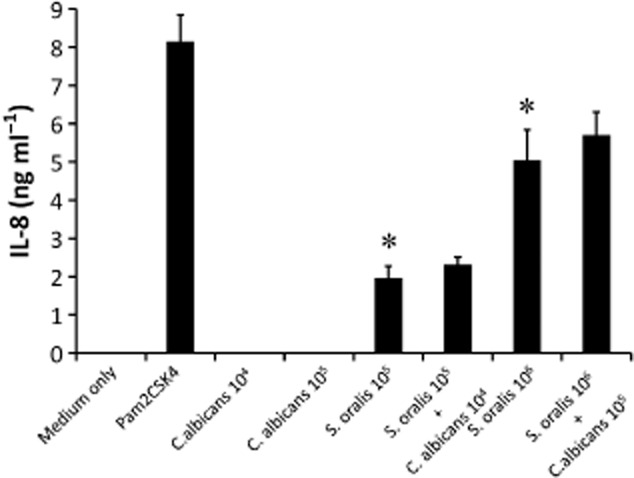
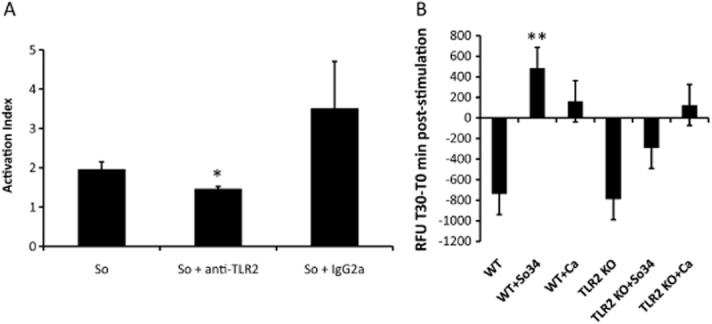
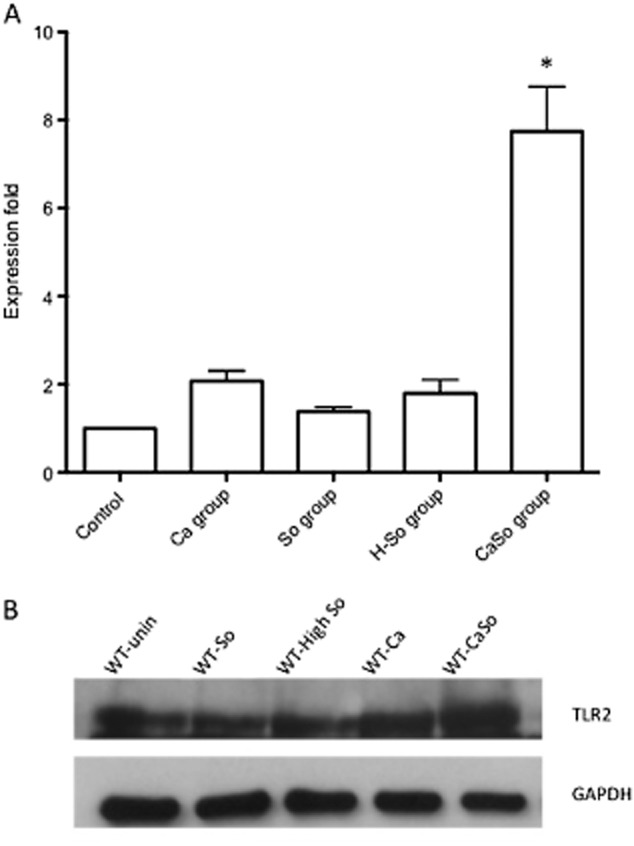
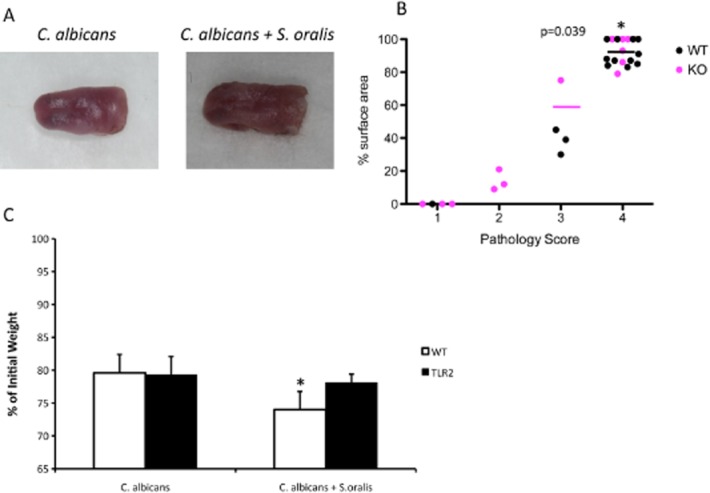
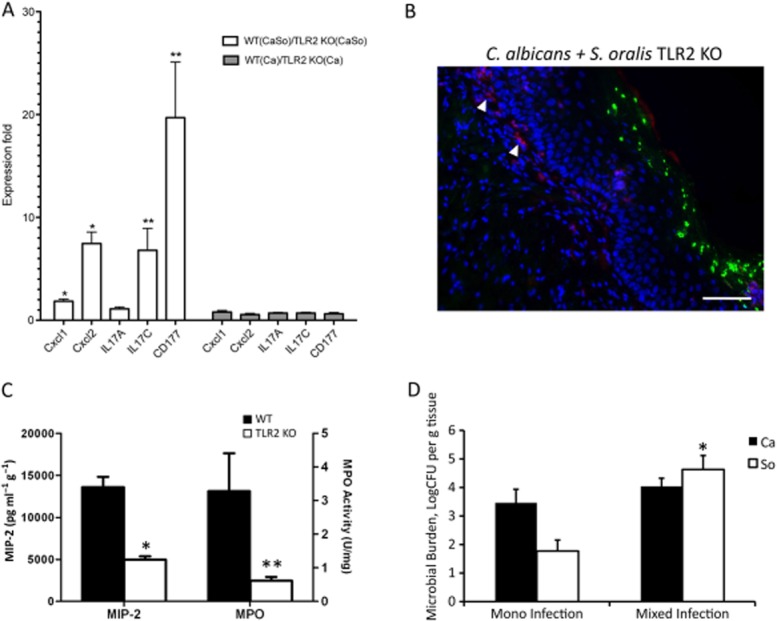
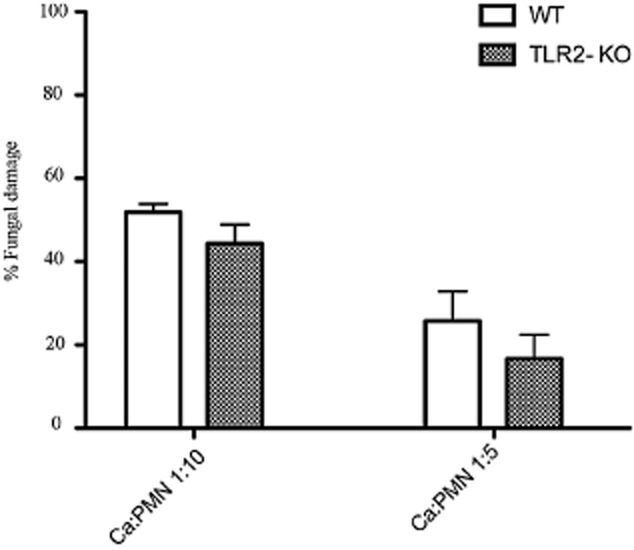
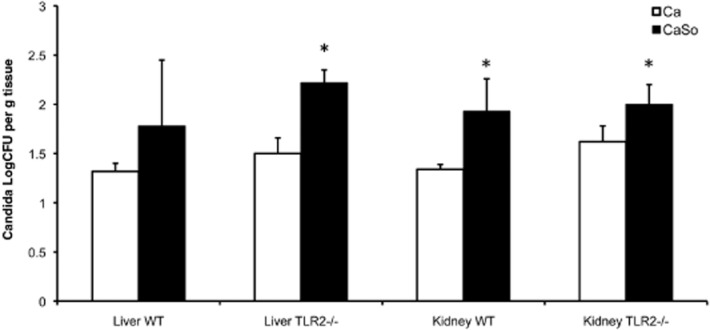
Mitis-group streptococci are ubiquitous oral commensals that can promote polybacterial biofilm virulence. Using a novel murine oral mucosal co-infection model we sought to determine for the first time whether these organisms promote the virulence of C. albicans mucosal biofilms in oropharyngeal infection and explored mechanisms of pathogenic synergy. We found that Streptococcus oralis colonization of the oral and gastrointestinal tract was augmented in the presence of C. albicans. S. oralis and C. albicans co-infection significantly augmented the frequency and size of oral thrush lesions. Importantly, S. oralis promoted deep organ dissemination of C. albicans. Whole mouse genome tongue microarray analysis showed that when compared with animals infected with one organism, the doubly infected animals had genes in the major categories of neutrophilic response/chemotaxis/inflammation significantly upregulated, indicative of an exaggerated inflammatory response. This response was dependent on TLR2 signalling since oral lesions, transcription of pro-inflammatory genes and neutrophil infiltration, were attenuated in TLR2(-/-) animals. Furthermore, S. oralis activated neutrophils in a TLR2-dependent manner in vitro. In summary, this study identifies a previously unrecognized pathogenic synergy between oral commensal bacteriaand C. albicans. This is the first report of the ability of mucosal commensal bacteria to modify the virulence of an opportunistic fungal pathogen.


Figures

Fig 1
Fig 1
Pathogenic synergy between C. albicans and S. oralis.A. Tongues of mice were excised after five days of infection and the dorsal aspect was digitally photographed. Representative pictures are shown from 1 mouse in each group.B. Overlay images of tongue tissue sections stained with a FITC-labelled anti-Candida antibody (green), followed by FISH with an Alexa 546-labelled S. oralis-specific probe (red), and counterstained with the nucleic acid stain Hoechst 33258 (blue). The FISH signal was completely absent in biofilms formed by C. albicans only. Bars = 50 μm.C. Oral pathology score based on percent tongue surface area covered by thrush (biofilm). Image J was used to calculate the area covered by the white plaque as well as the total dorsal surface area of each tongue in order to calculate percentage of surface area covered. Each dot represents an individual mouse with 8–12 mice per group. So: S. oralis 34, Ca: C. albicans 5314, CaSo: S. oralis + C. albicans. Median values of pathology scores in each infection group are designated by horizontal lines. *P < 0.01 for a comparison between Ca and CaSo groups.D. Body weight loss in each infection group during the five day infection period, expressed as percentage of initial weight (day 1) in 17–26 animals per group from 3 independent experiments. Error bars represent SEM. *P < 0.01 for a comparison between Ca and CaSo groups.
Fig 2
Fig 2
C. albicans increases S. oralis burdens on mouse tongue and esophageal tissues. Tongues and esophagi were homogenized, serially diluted and plated for cfu counts on day 5.A. C. albicans cfu.B. S. oralis cfu.Co-infection increased oroesophageal colonization of S. oralis, but not C. albicans. Results of three independent mouse experiments, with 6–8 animals per group are shown. Bars indicate SEM. *P < 0.005 compared with single, S. oralis infection.
Fig 3
Fig 3
C. albicans promotes S. oralis colonization in the intestinal tract. DNA in stool samples of mice infected with C. albicans alone (Ca), S. oralis alone (So), or co-infected with C. albicans and S. oralis (CaSo) were analysed by qPCR using primers specific for the S. oralis strain 34 wefA-H gene. Cell numbers were calculated according to a standard curve using known amounts of S. oralis 34 gDNA. Results of three independent mouse experiments, with 6–8 animals per group are shown. Bars indicate standard deviations. *P < 0.005, **P < 0.05, for a comparison between the So and CaSo infection groups.
Fig 4
Fig 4
C. albicansS. oralis co-infection leads to a robust pro-inflammatory response. The oral transcriptional response to infection was analysed in tongue tissues from 3 animals per group on day 5 using whole mouse genome microarrays.A. Pie chart shows the representation of major functional categories of 195 genes differentially regulated in co-infected animals, compared with all other groups.B. molecular function tree of the differentially regulated genes in co-infected animals. The tree diagram displays the hierarchy of gene ontology terms and the levels of enrichment as indicated by FDR adjusted P-values. The genes used in the ontology analysis all exhibited greater than twofold change and adjusted P-value ≤ 0.05 in expression in the comparisons of the co-infected group against all other groups. Greater colour intensity indicates lower P-values.C. Heatmap showing relative expression levels of 31 selected genes across 4 groups of animals (3 biological replicates per group, each with technical triplicates). Normalization of each row (gene) for heatmap generation was performed by subtraction of the median value of the row followed with division by the median absolute deviation. Genes involved in similar biologic processes were grouped together in the categories shown on the right y-axis. Although there was variability in the Candida-infected animals, in the co-infected animals we found genes in the major categories of neutrophilic response/chemotaxis/inflammation to be consistently upregulated, indicative of a broad inflammatory response. Strong induction of multiple chemokines and other neutrophil-activating cytokines (e.g. IL-17C, TNF, IL-1α, IL-1β) were seen in mixed relative to single infection.
Fig 5
Fig 5
Analysis of inflammatory gene and protein expression in tongue tissues.A. Two chemokines (CXCL1, CXCL2), a neutrophil-specific antigen (CD177) and an epithelial cell-derived neutrophil-activating cytokine (IL-17C) were tested in the same RNA samples surveyed by microarray analysis on day 5 post infection. After cDNA synthesis, equal amounts from three mice per group were mixed and analysed in triplicate by RT-qPCR. All genes were significantly (P < 0.05) upregulated in co-infected animals (CaSo) compared with C. albicans alone (Ca).B. MIP-2/CXCL2 protein levels (day 5) in tongue homogenates, normalized by tissue weight (pg g−1 of tissue). MIP-2 was not detectable in uninfected mice (not shown). Results are means from three independent animal experiments, with 4–6 animals per group and error bars represent SEM. *P < 0.01 compared with C. albicans alone.
Fig 6
Fig 6
Increased neutrophil infiltration of the oral mucosa in co-infected mice.A. Immunofluorescence staining of frozen tongue sections (day 5) with monoclonal antibody NIMP-R14, highly specific for murine Ly-6G and Ly-6C. Neutrophils (red) are shown with white arrows. Note the intense staining in direct juxtaposition to the mixed bacterial-fungal biofilm in co-infected animals. Isotype control antibody did not show any staining (not shown). Bars = 50 μm.B. MPO activity in tongue homogenates on day 5 post infection. Results are means from two independent animal experiments, with 8–10 animals per group and error bars represent SEM. *P < 0.05 compared with C. albicans alone.
Fig 7
Fig 7
HEK293-hTLR2 expressing cells respond to S. oralis but not C. albicans with IL-8 secretion. HEK293-hTLR2 cells were challenged with live S. oralis 34 (So) and/or C. albicans (Ca) and supernatants were analysed by ELISA. Pam2CSK4 was used as a positive control. Two microbial cell doses were tested (Ca: 104, 105 cells ml−1, So: 105, 106 cells ml−1). IL-8 was undetectable with all stimulants in the HEK293-pcDNA3 negative control cells (not shown). Error bars represent SD of triplicate experiments. *P < 0.01 compared with medium only.
Fig 8
Fig 8
S. oralis triggers a TLR2-dependent oxidative response in neutrophils.A. ROS production was measured after 1 h incubation of HL-60 leucocytes with S. oralis 34 whole cell sonicates. TLR2 receptors on leucocytes were blocked by the addition of a neutralizing anti-human TLR2 or isotype control (IgG2a) antibody (both at 10 μg ml−1). Results represent means and standard deviations of duplicate experiments, with all conditions set up in triplicate, and are expressed as Activation Index i.e. as the ratio of fluorescence in the presence/absence of stimulus. *P < 0.05, for a comparison between S. oralis alone and S. oralis + anti-TLR2 antibody.B. Primary mouse TLR2−/− and wild type neutrophils were stimulated with live, germinated C. albicans cells (105 cells per well) or S. oralis 34 whole cell sonicates (106 cells per well) for 30 min and fluorescence was measured at 0 min and 30 min, post challenge. Results are expressed in relative fluorescence units (T30minRFU − T0minRFU) and represent means and standard deviations of neutrophil responses from 4 WT and 4 TLR2−/− animals. Negative values indicate progressive loss of activation/fluorescence during the 30 min incubation period. **P < 0.01 compared with TLR2−/− cell stimulation with S. oralis.
Fig 9
Fig 9
TLR2 is upregulated in the oral mucosa during co-infection.A. TLR2 transcripts were analysed in tongue homogenates on day 5 by qRT-PCR. Results represent mean fold expression levels over uninfected animals in each of the four infection groups (C. albicans alone (Ca), S. oralis alone (So), high dose of S. oralis alone (H-So) or co-infected with C. albicans and S. oralis (CaSo)) with 4–6 animals per group. Error bars are SD. *P < 0.005, compared with Ca group.B. TLR2 protein expression levels on day 5 were analysed in tongue homogenates of wild type (WT) animals by Western blotting. A representative Western is shown with tissue samples from one animal in each of the four infection groups: So: S. oralis alone, High So: high dose of S. oralis, Ca: C. albicans alone and CaSo: co-infected with C. albicans and S. oralis. GAPDH signal served as internal loading control.
Fig 10
Fig 10
Co-infected TLR2−/− mice display reduced pathology.A and B. Wild type and TLR2−/− mice were infected with C. albicans or the combination of C. albicans and S. oralis for 5 days and tongue lesions were digitally photographed (A) and graded for pathology (B) as described in the materials and methods. Median values of pathology scores in each infection group is designated by horizontal lines. Each dot represents an individual mouse with 8–12 mice per group. Lesion scores in TLR2−/− animals co-infected with C. albicans and S. oralis were significantly lower than in wild type animals (P = 0.039).C. Body weight loss in TLR2−/− and wild type animals during the five day infection period, expressed as percentage of initial weight (day 1). Error bars represent SEM. *P = 0.04 for a comparison between TLR2−/− and WT animals.
Fig 11
Fig 11
TLR2 is involved in the enhanced oral inflammatory response to C. albicans-streptococcal co-infection in vivo.A. Pro-inflammatory gene transcripts in tongue tissues of wild type and TLR2−/− animals on day 5, as assessed by RT-qPCR. Results represent mean fold expression level of wild type over TLR2−/− tissues, in 4 animals per group. Open bars: co-infection with C. albicans and S. oralis. Gray bars: C. albicans infection. *P < 0.01 and **P < 0.05 for a comparison between WT and TLR2−/− expression levels.B. Immunofluorescence staining of frozen tongue sections (day 5) with monoclonal antibody NIMP-R14, highly specific for murine Ly-6G and Ly-6C. Neutrophils (red) are shown with white arrows. Note the relative absence of neutrophils adjacent to the mucosal biofilm. Bars = 50 μm.C. Comparison of MIP-2/CXCL2 protein concentration (pg g−1 tissue) and MPO activity levels (U mg−1 tissue) in tongue homogenates between WT (closed bars) and TLR2−/− animals (open bars), co-infected with C. albicans and S. oralis. Mean of WT and TLR2−/− tongue protein levels (8–12 animals per group) ± SEM, on day 5 post infection is shown. *P < 0.001, and **P < 0.05, compared with WT.D. Tongues from TLR2−/− animals were homogenized, serially diluted and plated for C. albicans (Ca) or S. oralis (So) cfu counts on day 5. Similar to wild type animals (Fig. 12) co-infection increased oral colonization of S. oralis, but not C. albicans. Results of two independent mouse experiments, with 8–10 animals per group are shown. Bars indicate SEM. *P < 0.001 compared with single, S. oralis infection.
Fig 12
Fig 12
TLR2−/− neutrophils are not significantly compromised in their ability to kill C. albicans. Germinated organisms were exposed to bone marrow isolated mouse neutrophils from TLR2−/− or wild type mice, at two target to effector ratios (1:10 and 1:5), for 3 h and killing was assessed by the XTT assay. Results represent mean and SD of killing activity of neutrophils isolated from 4 mice per group.
Fig 13
Fig 13
Co-infection increased dissemination of C. albicans in kidneys and livers of TLR2−/− and wild type animals. Both of the kidneys and the liver of each animal were homogenized, serially diluted and plated for cfu counts on day 5 post infection. Fungal burdens were compared in TLR2−/− and WT animals infected with C. albicans (Ca) or C. albicans plus S. oralis (CaSo); *P < 0.05 CaSo compared with Ca. Results of three independent mouse experiments, with 6–8 animals per group are shown. Bars indicate SEM.

References

    1. Aas JA, Paster BJ, Stokes LN, Olsen I. Dewhirst FE. Defining the normal bacterial flora of the oral cavity. J Clin Microbiol. 2005;43:5721–5732. - PMC - PubMed
    1. Aderem A. Ulevitch RJ. Toll-like receptors in the induction of the innate immune response. Nature. 2000;406:782–787. - PubMed
    1. Alam S, Brailsford SR, Adams S, Allison C, Sheehy E, Zoitopoulos L, et al. Genotypic heterogeneity of Streptococcus oralis and distinct aciduric subpopulations in human dental plaque. Appl Environ Microbiol. 2000;66:3330–3336. - PMC - PubMed
    1. Bamford CV, d'Mello A, Nobbs AH, Dutton LC, Vickerman MM. Jenkinson HF. Streptococcus gordonii modulates Candida albicans biofilm formation through intergeneric communication. Infect Immun. 2009;77:3696–3704. - PMC - PubMed
    1. Barrett AP. Recognition and management of invasive pharyngeal candidiasis in acute leukemia. Oral Surg Oral Med Oral Pathol. 1989;67:275–278. - PubMed

Publication types

MeSH terms