Comparative Study
. 2013 Sep 30;2(5):e000253.
doi: 10.1161/JAHA.113.000253.

The origin of human mesenchymal stromal cells dictates their reparative properties

Affiliations
Comparative Study

The origin of human mesenchymal stromal cells dictates their reparative properties

Nili Naftali-Shani et al. J Am Heart Assoc. .

Abstract

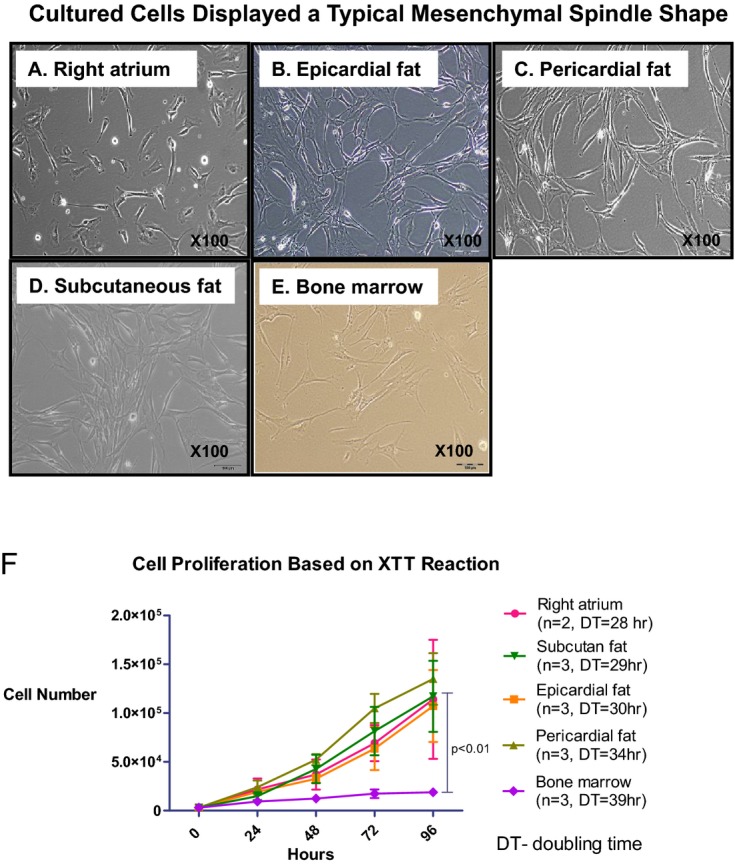
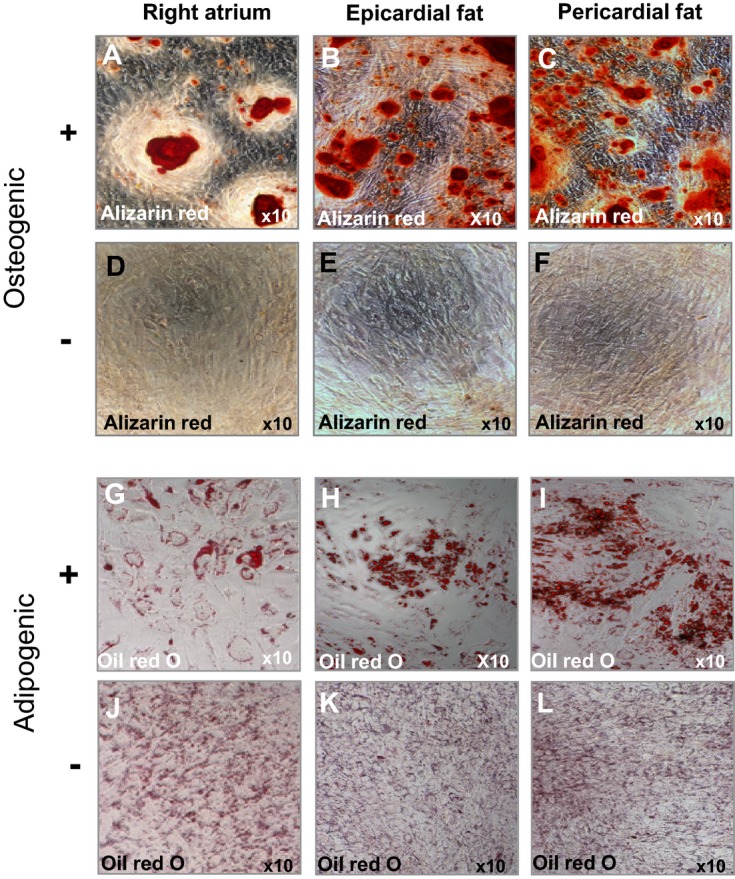
Background: Human mesenchymal stromal cells (hMSCs) from adipose cardiac tissue have attracted considerable interest in regard to cell-based therapies. We aimed to test the hypothesis that hMSCs from the heart and epicardial fat would be better cells for infarct repair.

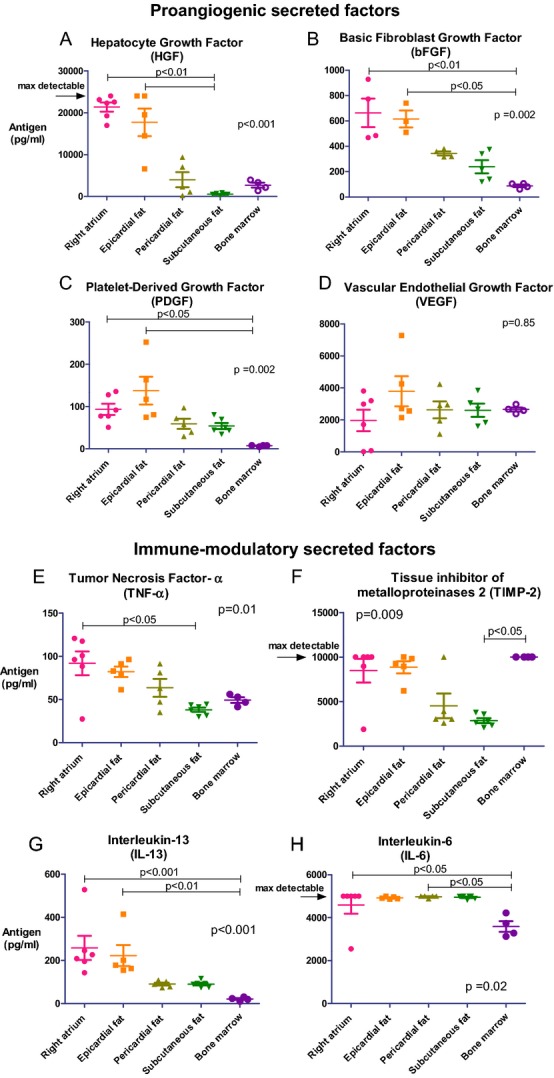
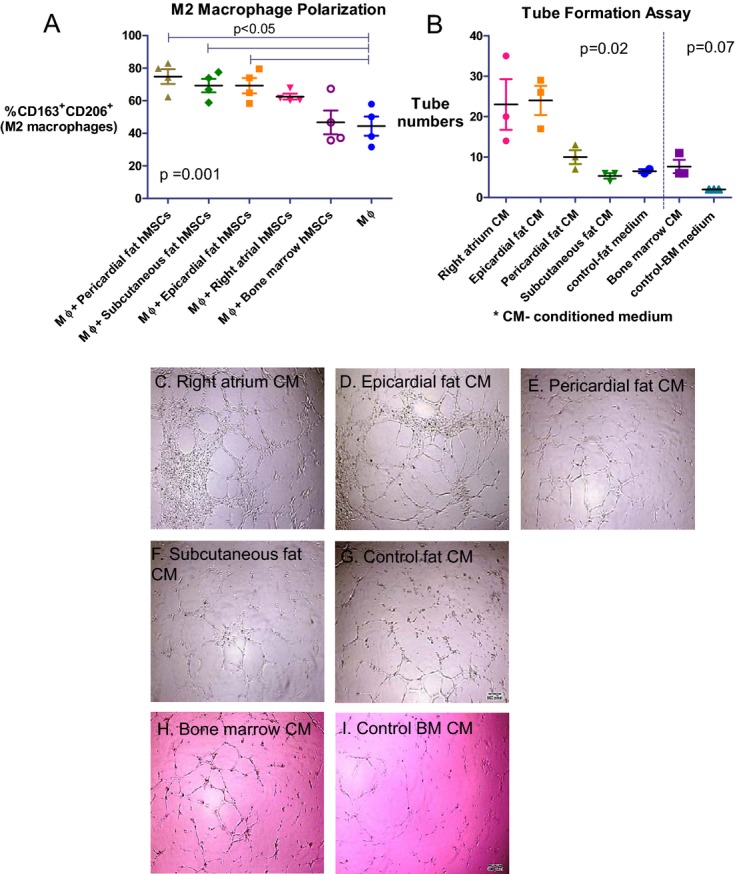
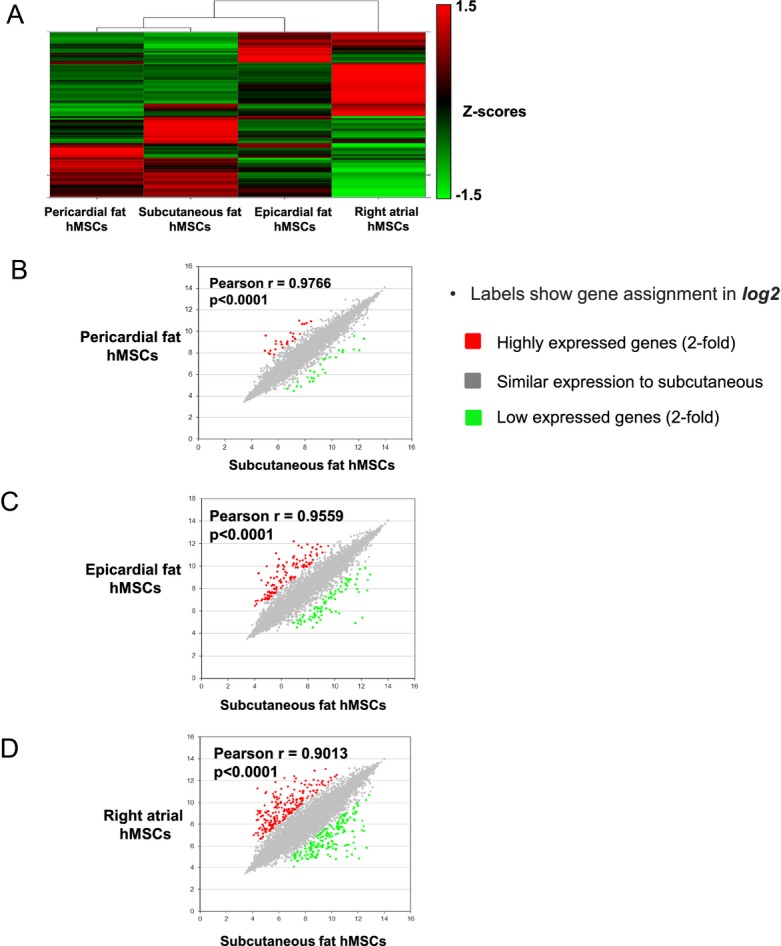
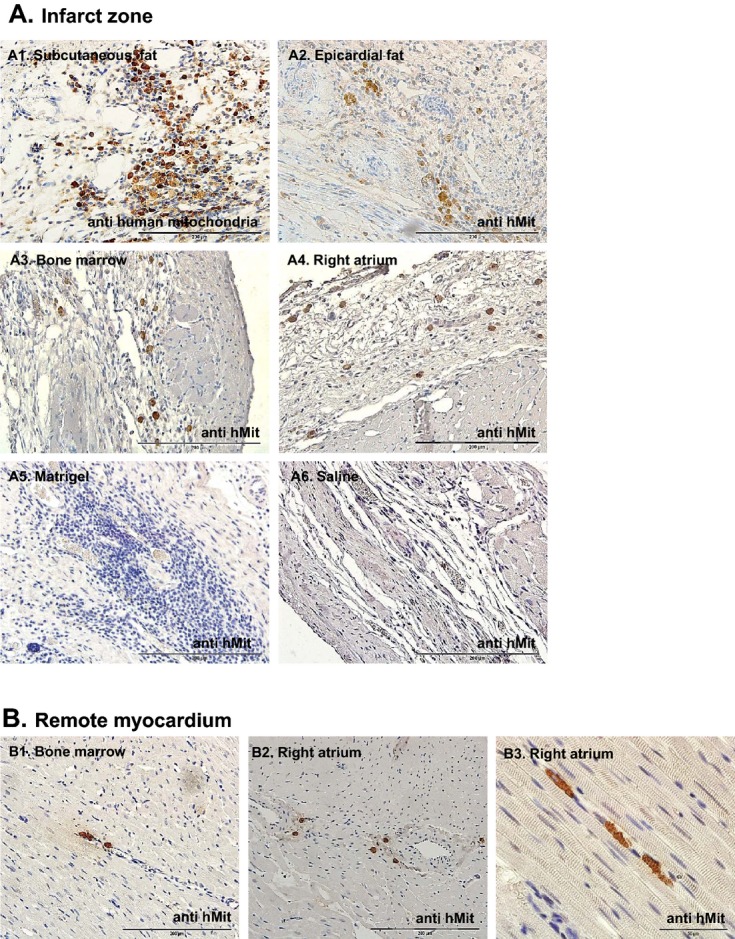
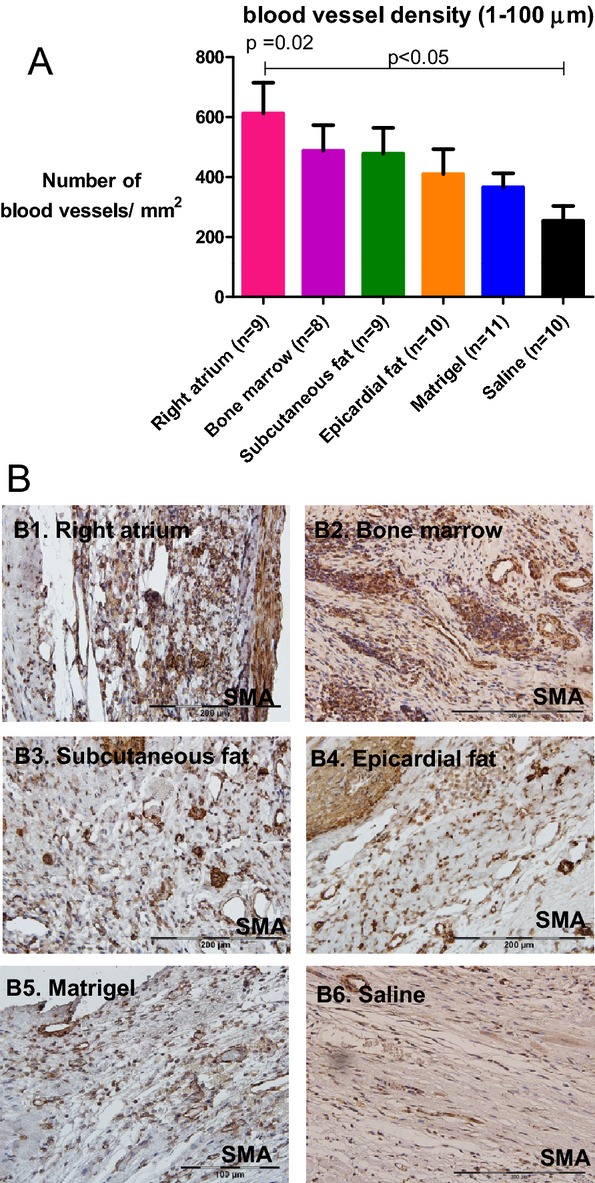
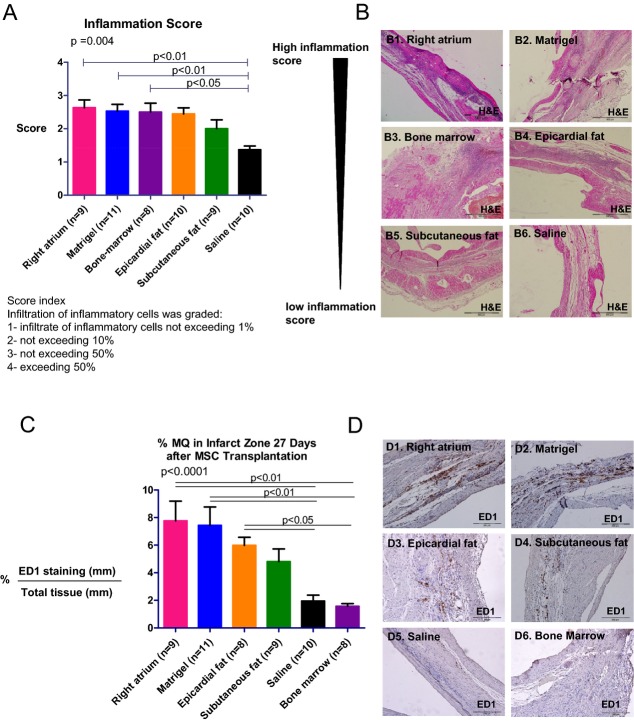
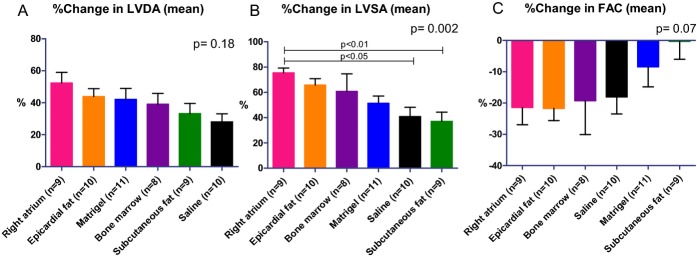
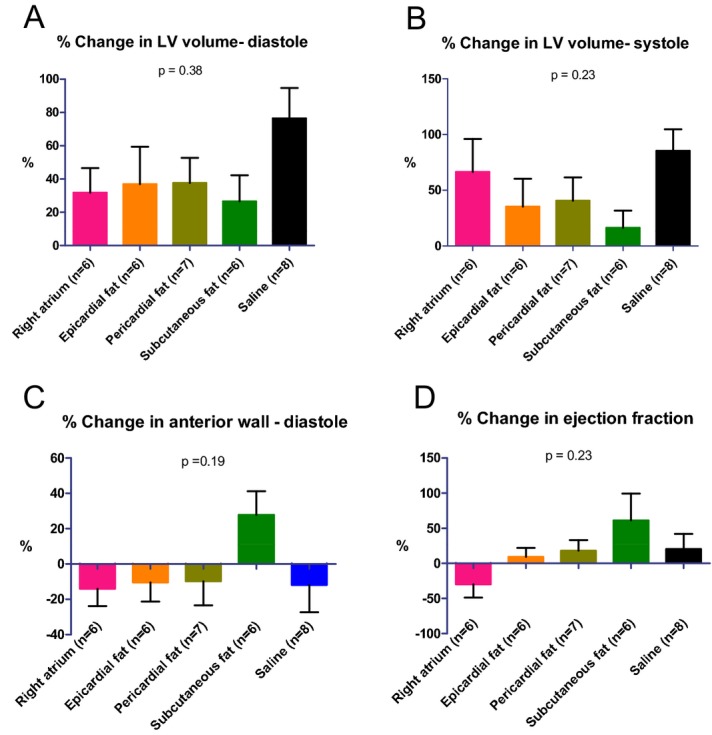
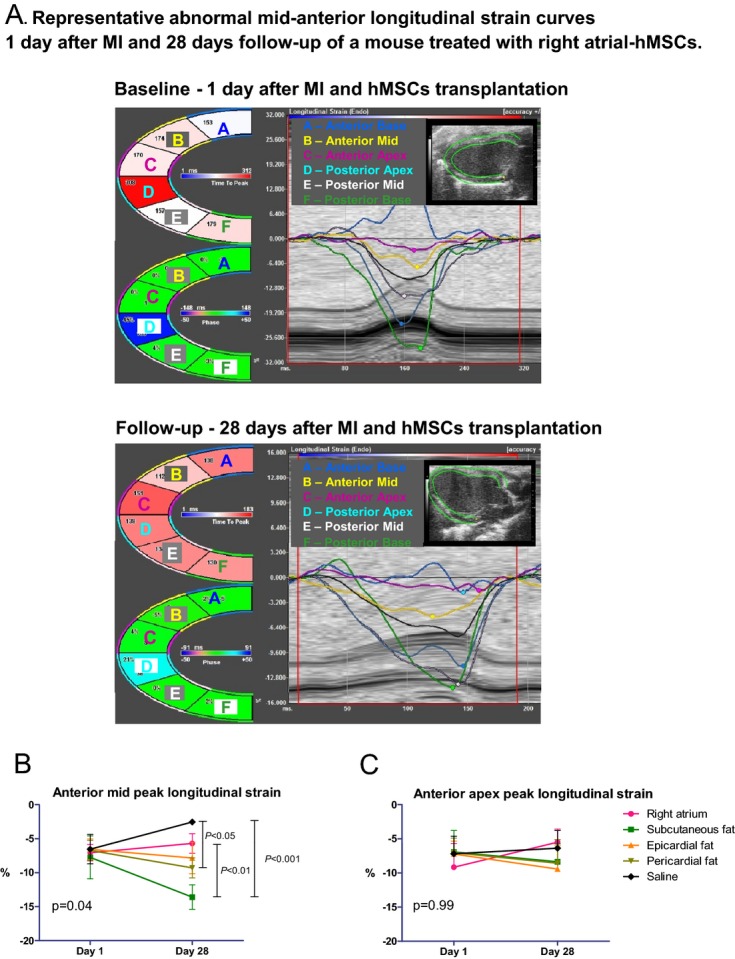
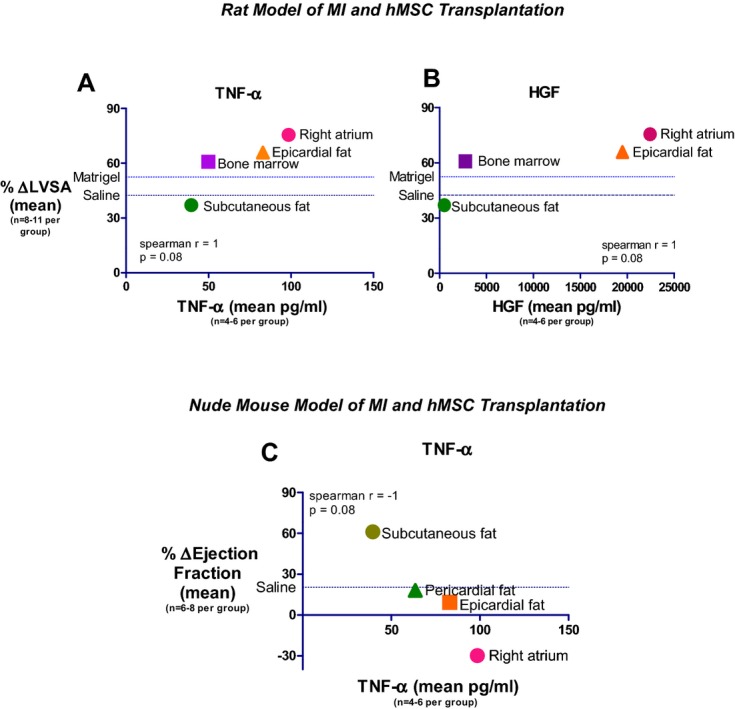
Methods and results: We isolated and grew hMSCs from patients with ischemic heart disease from 4 locations: epicardial fat, pericardial fat, subcutaneous fat, and the right atrium. Significantly, hMSCs from the right atrium and epicardial fat secreted the highest amounts of trophic and inflammatory cytokines, while hMSCs from pericardial and subcutaneous fat secreted the lowest. Relative expression of inflammation- and fibrosis-related genes was considerably higher in hMSCs from the right atrium and epicardial fat than in subcutaneous fat hMSCs. To determine the functional effects of hMSCs, we allocated rats to hMSC transplantation 7 days after myocardial infarction. Atrial hMSCs induced greatest infarct vascularization as well as highest inflammation score 27 days after transplantation. Surprisingly, cardiac dysfunction was worst after transplantation of hMSCs from atrium and epicardial fat and minimal after transplantation of hMSCs from subcutaneous fat. These findings were confirmed by using hMSC transplantation in immunocompromised mice after myocardial infarction. Notably, there was a correlation between tumor necrosis factor-α secretion from hMSCs and posttransplantation left ventricular remodeling and dysfunction.

Conclusions: Because of their proinflammatory properties, hMSCs from the right atrium and epicardial fat of cardiac patients could impair heart function after myocardial infarction. Our findings might be relevant to autologous mesenchymal stromal cell therapy and development and progression of ischemic heart disease.

Keywords: adipose tissue; epicardial fat; heart regeneration; inflammation; macrophages; mesenchymal stromal/stem cells; myocardial infarction.


Figures

Figure 1.
Figure 1.
Different growth rates of hMSCs from different locations. A through E, Morphology of adherent cells isolated from different locations. Cells were plastic‐adherent and displayed a mesenchymal spindle shape. Representative pictures of cells at passage 3 from the different locations: right atrium (A), epicardial fat (B), pericardial fat (C), subcutaneous fat (D), and bone marrow (E). Note that right atrium–derived cells appear to be rounder. F, Cells were isolated and cultured up to the third passage, and then the number of cells was calculated based on optical density measurement by XTT reaction for 5 consecutive days in each location. The graph displays growth curves of hMSCs and doubling time. BM hMSCs display the slowest growth rate. Results are expressed as the mean±SEM number of cells per hMSC location. Measures of cell proliferation over time and among groups were analyzed by a 2‐way repeated‐measures ANOVA. BM indicates bone marrow; DT, doubling time; hMSCs, human mesenchymal stromal cells.
Figure 2.
Figure 2.
Multilineage differentiation capacity of hMSCs from different locations by in vitro differentiation assays. Representative hMSCs from right atrium and pericardial fat (n=1) and epicardial fat (n=3) induced to differentiate into adipogenic and osteogenic lineages. Positive staining for alizarin red (A through C) indicates osteogenic differentiation, compared with untreated hMSCs (D through F, respectively). Positive staining for Oil‐red O (G through I) indicates adipogenic differentiation, compared with untreated hMSCs (J through L, respectively). Bone marrow–derived hMSCs were used as positive controls (data not shown). hMSCs indicate human mesenchymal stromal cells.
Figure 3.
Figure 3.
Different cytokine secretion by hMSCs from various locations. We measured the level of secreted cytokines in the conditioned medium collected from the cells at passage 3 by using multiplex ELISA. Overall, epicardial fat and right atrium hMSCs secreted higher levels of proangiogenic and immunomodulatory factors compared with pericardial fat, subcutaneous fat, and BM hMSCs (A through H; P values, calculated by Kruskal–Wallis test for all groups and by Dunn's post hoc test, are indicated in the graphs). Interleukin‐6 levels were high in all locations except for BM (H). BM indicates bone marrow; hMSCs, human mesenchymal stromal cells.
Figure 4.
Figure 4.
Diverse effects of hMSCs on macrophage polarization and angiogenesis. A, The effect of hMSCs on M2 macrophage polarization. hMSCs were co‐cultured with CD14+ macrophages, separated by a transwell membrane, and the macrophage phenotype was evaluated by immune‐staining for CD206+CD163+. The percentage of macrophages expressing M2 markers increased significantly after incubation with fat‐derived hMSCs but not with right atrial and BM hMSCs (P=0.001 for all groups; P<0.05 between the groups; n=4 in each location). B, The angiogenic effect of the conditioned medium from hMSCs was determined by quantification of the number of tubes with capillary‐like structures of HUVECs on Matrigel 8 hours after incubation with different conditioned media. The number of tubes was greater in the presence of conditioned medium from right atrial hMSCs and epicardial fat hMSCs compared with pericardial, subcutaneous fat, and control (P=0.02 for all groups, n=3 in each location). C through I, Representative microscopic images taken 8 hours after incubation of HUVECs with conditioned media from different hMSCs. BM indicates bone marrow; CM, conditioned medium; hMSCs, human mesenchymal stromal cells.; HUVECs, human umbilical vein endothelial cells; MΦ, macrophage.
Figure 5.
Figure 5.
Gene expression of hMSCs from different locations. A, Heat maps of microarray data: each column represents a different location of hMSCs, with columns arranged in clusters by similarity. Normalized data presented as Z scores. B through D, Pearson correlation analysis of gene expression profiles of hMSCs from subcutaneous fat (in horizontal axis) compared with B, pericardial fat hMSCs (vertical axis), C, epicardial fat hMSCs (vertical axis) and D, right atrium hMSCs (vertical axis). Labels show gene assignment (in log2). The colors indicate above and below 2‐fold change compared to subcutaneous fat hMSCs: red, upregulated genes; green, downregulated genes; gray, similar expression to subcutaneous. hMSCs indicate human mesenchymal stromal cells.
Figure 6.
Figure 6.
hMSC grafts in the infarcted myocardium 27 days after transplantation in rat. To determine the survival of implanted hMSCs in the infarcted myocardium, we stained heart sections with anti‐human mitochondria antibodies 27 days after transplantation. A1 through A6, Representative microscopic images of the infarct zone. Cell grafts were largest in the heart sections treated with subcutaneous fat hMSCs (A1) and smallest in BM and right atrial hMSC‐treated hearts (A3 and A4), while control groups (saline‐ and Matrigel‐treated hearts) were negative for human mitochondria staining (A5 and A6). B1 through B3, Representative microscopic images from the remote myocardium indicate cell migration (B1 and B2) and in some cases typical striation and early sarcomere formation (B3). BM indicates bone marrow; hMit, human mitochondria immunostaining; hMSCs, human mesenchymal stromal cells.
Figure 7.
Figure 7.
Diverse vascularization effect of hMSCs from different locations after transplantation in rats. A, Vessel density was determined by the number of smooth muscle actin positive vessels per mm2 in the infarct zone of the different groups (3 sequential pictures were taken per rat). B1 through B6, Representative microscopic images from each group. Vessel density was greater in rats treated with right atrial hMSCs 27 days after injection compared with saline‐treated rats (P=0.02 for all groups; P<0.05 for right atrium vs. saline). Data are means±SEM. hMSCs indicate human mesenchymal stromal cells.
Figure 8.
Figure 8.
Inflammation and macrophage infiltration to the infarct 27 days after transplantation in rats. To examine the degree of inflammatory cell infiltration, heart sections were stained with hematoxylin and eosin, and microscopic findings were graded according to the score index in the figure. Three sections were obtained per heart; the mean score of the 3 sections was recorded as the microscopic score for that rat. A, Microscopic score. B1 through B6, Representative microscopic images from each group. hMSCs from right atrium, BM, and Matrigel increased the extent of inflammatory cells in the infarct zone and their inflammation scores were significantly higher compared with the saline group (P<0.05), while subcutaneous fat hMSCs had the lowest inflammation score (P=0.004 for all groups). C, Macrophage infiltration was determined by the percentage of area stained for ED1 in the infarct zone in the different groups (3 sequential pictures were taken per rat). D1 through D6, Representative microscopic images from each group. Macrophage infiltration into the infarct zone of hearts treated with the right atrial hMSCs, epicardial hMSCs, and Matrigel groups was significantly higher compared with BM hMSCs and saline groups (P<0.0001 for all groups). While the subcutaneous fat group exhibited noticeable macrophage infiltration, it was not significant when compared with saline. BM indicates bone marrow; hMSCs, human mesenchymal stromal cells; MΦ, macrophage.
Figure 9.
Figure 9.
Diverse effects of hMSCs from different locations on LV remodeling and function in a rat model of MI. Percentage of changes in echocardiography measurements. hMSCs from different locations, mixed with Matrigel or Matrigel alone or saline, were injected into the infarcted heart 7 days after MI. Echocardiography studies were done 6 (baseline, before transplantation) and 34 days after MI. While subcutaneous fat hMSCs preserved LV diastolic (A) and systolic (B) area, right atrial hMSCs increased it (B, P<0.05). Significantly, hMSCs from subcutaneous fat attenuated LV dysfunction as indicated by change in FAC (C). P values for all groups by Kruskal–Wallis. FAC indicates fractional area change; hMSCs, human mesenchymal stromal cells.; LAD, left anterior descending coronary artery; LV, left ventricle; LVDD, left ventricular end‐diastolic dimension; LVSD, left ventricular end‐systolic dimension.
Figure 10.
Figure 10.
Diverse effects of hMSCs from different locations on LV remodeling and function in an immunocompromised nude mouse after MI. Percentage of changes in echocardiography measurements. hMSCs from different locations or saline were injected into the infarcted heart immediately after MI. Echocardiography studies were done 1 (baseline) and 28 days after MI. LV diastolic (A) and systolic (B) volumes were smallest, and scar thickness (C) and ejection fraction (D) were greatest in the animals treated with hMSCs from subcutaneous fat. P values for all groups by Kruskal–Wallis. hMSCs indicates human mesenchymal stromal cells; LV, left ventricle.
Figure 11.
Figure 11.
Diverse effects of hMSCs from different locations on LV function by speckle‐tracking–based strain analysis in a parasternal long‐axis view in immunocompromised nude mice. A, Regional strain curves are altered in a typical way at day 1 and 28 days after MI and right atrial hMSC transplantation. B, hMSCs from subcutaneous and pericardial fat improved regional function at the infarct‐related territory, compared with saline and hMSCs from the right atrium, by longitudinal peak strain analysis of the anterior mid segment. C, hMSCs did not significantly improve regional function at the anterior apical segment by peak longitudinal strain analysis. hMSCs indicates human mesenchymal stromal cells; LV, left ventricle.
Figure 12.
Figure 12.
Correlation between hMSC TNF‐α or HGF levels and echocardiography parameters. A and B, A high correlation between the secretion of MSC TNF‐α (A) and HGF (B) in vitro and LV end systolic area after MSC transplantation in a rat model of MI. C, Inverse correlation between the secretion of MSC TNF‐α in vitro and ejection fraction after MSC transplantation in nude mouse model of MI. HGF indicates hepatocyte growth factor; hMSCs, human mesenchymal stromal cells.; LV, left ventricular; LVSA, left ventricular end‐systolic area; MI, myocardial infarction; TNF‐α, tumor necrosis factor‐α.

References

    1. Gimble JM, Guilak F, Bunnell BA. Clinical and preclinical translation of cell‐based therapies using adipose tissue‐derived cells. Stem Cell Res Ther. 2010; 1:19. - PMC - PubMed
    1. Rehman J, Traktuev D, Li J, Merfeld‐Clauss S, Temm‐Grove CJ, Bovenkerk JE, Pell CL, Johnstone BH, Considine RV, March KL. Secretion of angiogenic and antiapoptotic factors by human adipose stromal cells. Circulation. 2004; 109:1292-1298. - PubMed
    1. Imanishi Y, Miyagawa S, Maeda N, Fukushima S, Kitagawa‐Sakakida S, Daimon T, Hirata A, Shimizu T, Okano T, Shimomura I, Sawa Y. Induced adipocyte cell‐sheet ameliorates cardiac dysfunction in a mouse myocardial infarction model: a novel drug delivery system for heart failure. Circulation. 2011; 124:S10-S17. - PubMed
    1. Prockop DJ. Repair of tissues by adult stem/progenitor cells (mscs): controversies, myths, and changing paradigms. Mol Ther. 2009; 17:939-946. - PMC - PubMed
    1. Nakanishi C, Nagaya N, Ohnishi S, Yamahara K, Takabatake S, Konno T, Hayashi K, Kawashiri MA, Tsubokawa T, Yamagishi M. Gene and protein expression analysis of mesenchymal stem cells derived from rat adipose tissue and bone marrow. Circ J. 2011; 75:2260-2268. - PubMed

Publication types

LinkOut - more resources