. 2013 Sep 30;2(5):e000343.
doi: 10.1161/JAHA.113.000343.

Repetitive myocardial ischemia promotes coronary growth in the adult mammalian heart

Affiliations

Repetitive myocardial ischemia promotes coronary growth in the adult mammalian heart

Kory J Lavine et al. J Am Heart Assoc. .

Abstract

Background: Coronary artery disease and ischemic cardiomyopathy represent the leading cause of heart failure and continue to grow at exponential rates. Despite widespread availability of coronary bypass surgery and percutaneous coronary intervention, subsequent ischemic events and progression to heart failure continue to be common occurrences. Previous studies have shown that a subgroup of patients develop collateral blood vessels that serve to connect patent and occluded arteries and restore perfusion to ischemic territories. The presence of coronary collaterals has been correlated with improved clinical outcomes; however, the molecular mechanisms governing this process remain largely unknown.

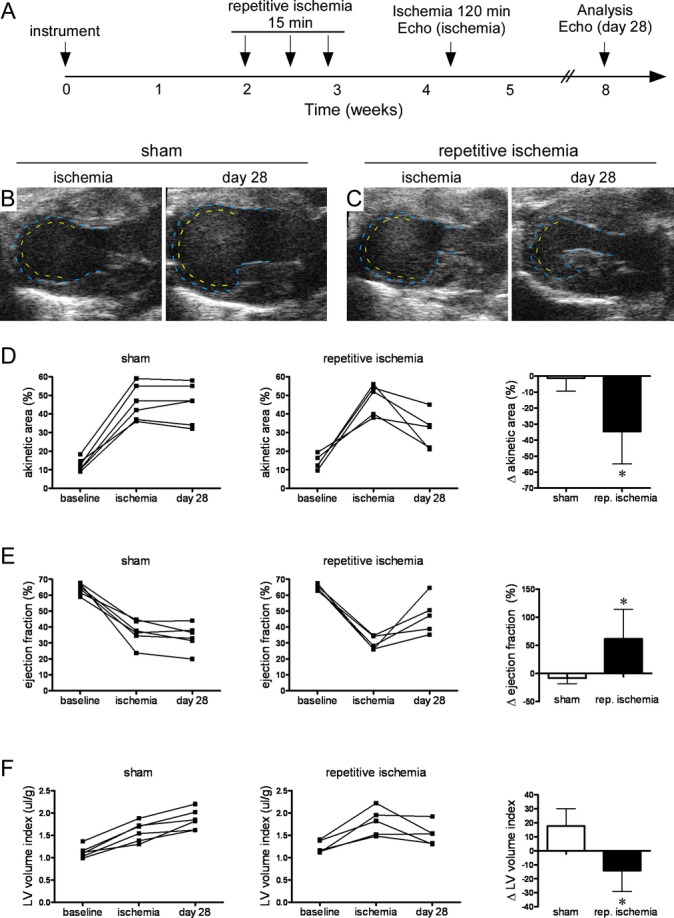
Methods and results: To date, no mouse models of coronary arterial growth have been described. Using a closed-chest model of myocardial ischemia, we have demonstrated that brief episodes of repetitive ischemia are sufficient to promote the growth of both large coronary arteries and the microvasculature. Induction of large coronary artery and microvascular growth resulted in improvements in myocardial perfusion after prolonged ischemia and protected from subsequent myocardial infarction. We further show that repetitive ischemia did not lead to increased expression of classic proangiogenic factors but instead resulted in activation of the innate immune system and recruitment of macrophages to growing blood vessels.

Conclusions: These studies describe a novel model of coronary angiogenesis and implicate the cardiac macrophage as a potential mediator of ischemia-driven coronary growth.

Keywords: collateral; coronary; coronary angiogenesis; macrophage; repetitive ischemia.


Figures

Figure 1.
Figure 1.
Mouse model of ischemia‐induced coronary angiogenesis. A, Diagram depicting the closed‐chest ischemia reperfusion model. An occluder is loosely placed around the LAD proximal to the major lateral branch. Ischemia is induced by placing tension on a suture threaded through the occluder. The yellow area indicates the ischemic territory and representative ECGs are shown before and during ischemia. B, Schematic describing the repetitive ischemia protocol. Mice were instrumented 2 weeks before the induction of ischemia. Ischemia was induced for 15 minutes every other day and animals were analyzed during the next 7 days. C through F, End‐systolic images after 15 minutes of ischemia. The dashed yellow line indicates the location of a wall motion abnormality, and the dashed blue line denotes the endocardial border. Prior to the inducing of ischemia (C), there is a small wall motion abnormality that corresponds to the site of occluder placement. Induction of a single episode of ischemia (D) results in a large wall motion abnormality extending from the anterior wall to the mid inferior wall. Immediately after reperfusion (E), there is a residual wall motion abnormality that resolves within 24 hours (F). G and H, Quantification of ejection fraction and akinetic region at baseline, during ischemia, 10 minutes after reperfusion, and 24 hours after reperfusion. *P<0.05 compared with baseline and 24 hours after reperfusion, **P<0.017 compared with all other time points. I, H&E–stained sections showing normal myocardial architecture after 3 episodes of repetitive ischemia. J, TUNEL staining demonstrating minimal cell death (white arrowheads) after 3 episodes of repetitive ischemia. K, Picrosirius red staining showing myocardial fibrosis in sham and mice that underwent 3 episodes of repetitive ischemia. L, Quantification of TUNEL and Picrosirius red staining. **P<0.025 compared with all other groups. Ao indicates aorta; ECG, echocardiography; H&E, hematoxylin and eosin; IR, ischemia and reperfusion; LAD, left anterior descending coronary artery; LCA, left coronary artery; LCX, left circumflex artery; LPL, lateral posterior lateral branch; LV, left ventricle; RCA, right coronary artery; RSC, right septal conal branch; RV, right ventricle; TUNEL, terminal deoxynucleotidyl transferase dUTP nick end labeling.
Figure 2.
Figure 2.
Induction of coronary growth after repetitive ischemia. A–H, Microfil perfusion casts demonstrating enlargement of the RCA after repetitive LCA ischemia. Sham animals (A–D) display a large LCA (A) and rudimentary RCA (B). The lateral wall is perfused through diagonal branches of the LAD (C and D). Following repetitive ischemia, the LAD (E) appears unchanged compared with sham‐operated animals, while the RCA undergoes significant enlargement (F). In these animals, the lateral wall is perfused by both the RCA (white arrow) and diagonal branches arising from the LAD (G and H). The white rectangle denotes the area enlarged in (D and H). I, Quantification of the area covered by the LAD and RCA. *P<0.05 compared with sham. LAD indicates left anterior descending coroney artery; LCA, left coronary artery; RCA, right coronary artery.
Figure 3.
Figure 3.
Microvascular expansion after repetitive ischemia. A and B, CD31/PECAM immunohistochemistry revealing expansion of the microvasculature in both the ischemic area (A) and border zone (B) after repetitive ischemia. C, Smooth muscle (SM) actin immunohistochemistry showing increased numbers of intramyocardial coronary arterioles in mice that underwent repetitive ischemia. D and E, Quantification of microvascular area stained in the ischemic area (D) and border zone (E) showing significant increases in capillary density peaking day 3 after repetitive ischemia. F, Quantification of the number of SM actin–containing blood vessels per ×10 field demonstrating increased intramyocardial arteriole number in mice that underwent repetitive ischemia at all time points examined. *P<0.05 compared with sham and day 3 after repetitive ischemia, **P<0.017 compared with all other time points. A and B, ×20 and C, ×10. PECAM indicates platelet endothelial cell adhesion molecule.
Figure 4.
Figure 4.
Ischemia‐induced coronary angiogenesis protects from myocardial infarction. A, Schematic depicting the experimental protocol used to test whether repetitive ischemia‐induced coronary growth protects from myocardial infarction. Echocardiograms were performed at baseline, during ischemia before myocardial infarction (ischemia) to control for variations in ischemic area, and 28 days after myocardial infarction (day 28). B and C, End‐systolic images during LAD ischemia at baseline and 28 days after myocardial infarction demonstrating that compared with sham‐operated animals (B), animals that underwent repetitive ischemia (C) have a smaller wall motion abnormality after myocardial infarction. D, Pairwise quantification of akinetic area revealing that sham animals have no change in akinetic area between ischemia and 28 days after myocardial infarction. In contrast, animals that underwent repetitive ischemia have a smaller akinetic area after myocardial infarction. E, Pairwise quantification of EF revealing that sham animals have no improvement in EF between ischemia and 28 days after myocardial infarction. In contrast, animals that underwent repetitive ischemia have improved EF after myocardial infarction. F, Pairwise quantification of LV remodeling as assessed by LV diastolic dimension indexed to body weight revealing that sham animals undergo increased LV size between ischemia and 28 days after myocardial infarction. In contrast, animals that underwent repetitive ischemia have a slight reduction in LV dimension. Also, ∆ akinetic area, EF and LV volume index indicate change between ischemia and 28 days after MI. *P<0.05 compared with sham. EF indicates ejection fraction; LAD, left anterior descending coronary artery; LV, left ventricle; MI, myocardial infarction.
Figure 5.
Figure 5.
Reduced infarct size and decreased area at risk after ischemia induced angiogenesis. A and C, Compared with sham‐treated animals, repetitive ischemia resulted in decreased infarct size after myocardial infarction. Whole mount (A) and trichrome‐stained sections (B) reveal decreased scar size in animals that underwent repetitive ischemia compared with shams. The black arrow indicates that position of the left anterior descending coronary artery (LAD) occluder and the blue dashed lines mark the border between scar and viable muscle. Quantification of infarct size (C) demonstrates smaller infarcts after repetitive ischemia. *P<0.05 compared with sham. D and F, Evans blue perfusion staining (D) and respective threshold images (E) during LAD ischemia demonstrating a dose‐dependent decrease in area at risk in animals that underwent repetitive ischemia. The dashed yellow line (D) and solid blue lines (E) outline the area at risk. Quantification of area at risk (F) showing a dose dependent decrease after repetitive ischemia. **P<0.025 compared with all other time points.
Figure 6.
Figure 6.
Microarray gene expression profiling during ischemia‐induced coronary angiogenesis. A, Venn diagram describing the distribution of upregulated and downregulated genes at day 1, 3, and 5 after repetitive ischemia compared with sham controls. B, Hierarchical cluster analysis revealing that the largest changes in gene expression occurs at days 1 and 3 after repetitive ischemia. C, Bar graphs depicting the number of genes regulated for each pathway identified through GO pathway analysis. ECM indicates extracellular matrix; GO, Gene Ontology.
Figure 7.
Figure 7.
Classic proangiogenic growth factor expression after repetitive coronary ischemia. A, Quantitative RT‐PCR assays showing expression of classic proangiogenic growth factors in hearts 1 day after repetitive ischemia relative to sham controls. Only Angpt2 and Fgf2 were upregulated after repetitive ischemia. *P<0.05 compared with sham. B, Immunostaining revealing unchanged VEGF‐A expression (red) in mice that underwent repetitive ischemia compared with sham controls. In contrast, VEGF‐A expression is increased in the border zone after myocardial infarction. DAPI (blue) and cardiac actin (cActin, green) demarcate the border zone. C, Western blot demonstrating no change in VEGF‐A protein levels between sham control and hearts that underwent repetitive ischemia. DAPI indicates 4′,6‐diamidino‐2‐phenylindole; FGF, fibroblast growth factor; VEGF, vascular endothelial growth factor.
Figure 8.
Figure 8.
Macrophages surround the coronary vasculature during ischemia induced coronary angiogenesis. A, H&E staining (×20) showing a cellular infiltrate in the adventitia of intramyocardial coronary blood vessels (arrows) after repetitive ischemia. The infiltrate resolves by day 5 after repetitive ischemia. B, Immunostaining for MAC3 (×40) demonstrating that the cellular infiltrate is primarily composed of macrophages. C and D, Immunostaining for CD11b (magenta) and smooth muscle actin (SMA, green) demonstrating that compared with sham controls (C), there is an enrichment of macrophages surrounding intramyocardial blood vessels after repetitive ischemia (D). (Original magnification ×63, scale bar indicates 20 μm.) E and F, Quantification of MAC3‐ and CD11b‐positive cells in sham controls and mice that underwent repetitive ischemia. G, CD68 immunostaining (×40) of endomyocardial biopsy specimens from controls and patients with CAV according to the presence of collaterals showing increased numbers of perivascular macrophages in patients with CAV who have collateral vasculature. Scale bar indicates 40 μm. H, Quantification of perivascular macrophages displayed as the number of macrophages per blood vessel (BV). *P<0.05 compared with sham. **P<0.017 (E) and P<0.025 (H) compared with all other groups. CAV indicates coronary allograft vasculopathy; H&E, hematoxylin and eosin; MAC3, CD107b.

Similar articles

Cited by

References

    1. Go AS, Mozaffarian D, Roger VL, Benjamin EJ, Berry JD, Borden WB, Bravata DM, Dai S, Ford ES, Fox CS, Franco S, Fullerton HJ, Gillespie C, Hailpern SM, Heit JA, Howard VJ, Huffman MD, Kissela BM, Kittner SJ, Lackland DT, Lichtman JH, Lisabeth LD, Magid D, Marcus GM, Marelli A, Matchar DB, McGuire DK, Mohler ER, Moy CS, Mussolino ME, Nichol G, Paynter NP, Schreiner PJ, Sorlie PD, Stein J, Turan TN, Virani SS, Wong ND, Woo D, Turner MB. Heart disease and stroke statistics—2013 update: a report from the American Heart Association. Circulation. 2013; 127:e6-e245 - PMC - PubMed
    1. Reitsma JB, Dalstra JA, Bonsel GJ, van der Meulen JH, Koster RW, Gunning‐Schepers LJ, Tijssen JG. Cardiovascular disease in the Netherlands, 1975 to 1995: decline in mortality, but increasing numbers of patients with chronic conditions. Heart. 1999; 82:52-56 - PMC - PubMed
    1. Mukherjee D, Comella K, Bhatt DL, Roe MT, Patel V, Ellis SG. Clinical outcome of a cohort of patients eligible for therapeutic angiogenesis or transmyocardial revascularization. Am Heart J. 2001; 142:72-74 - PubMed
    1. Williams B, Menon M, Satran D, Hayward D, Hodges JS, Burke MN, Johnson RK, Poulose AK, Traverse JH, Henry TD. Patients with coronary artery disease not amenable to traditional revascularization: prevalence and 3‐year mortality. Catheter Cardiovasc Interv. 2010; 75:886-891 - PubMed
    1. Billinger M, Kloos P, Eberli FR, Windecker S, Meier B, Seiler C. Physiologically assessed coronary collateral flow and adverse cardiac ischemic events: a follow‐up study in 403 patients with coronary artery disease. J Am Coll Cardiol. 2002; 40:1545-1550 - PubMed

Publication types