

The Hippo signaling pathway is required for salivary gland development and its dysregulation is associated with Sjogren's syndrome
- PMID: 24080911
- PMCID: PMC3864807
- DOI: 10.1038/labinvest.2013.114
The Hippo signaling pathway is required for salivary gland development and its dysregulation is associated with Sjogren's syndrome
Abstract
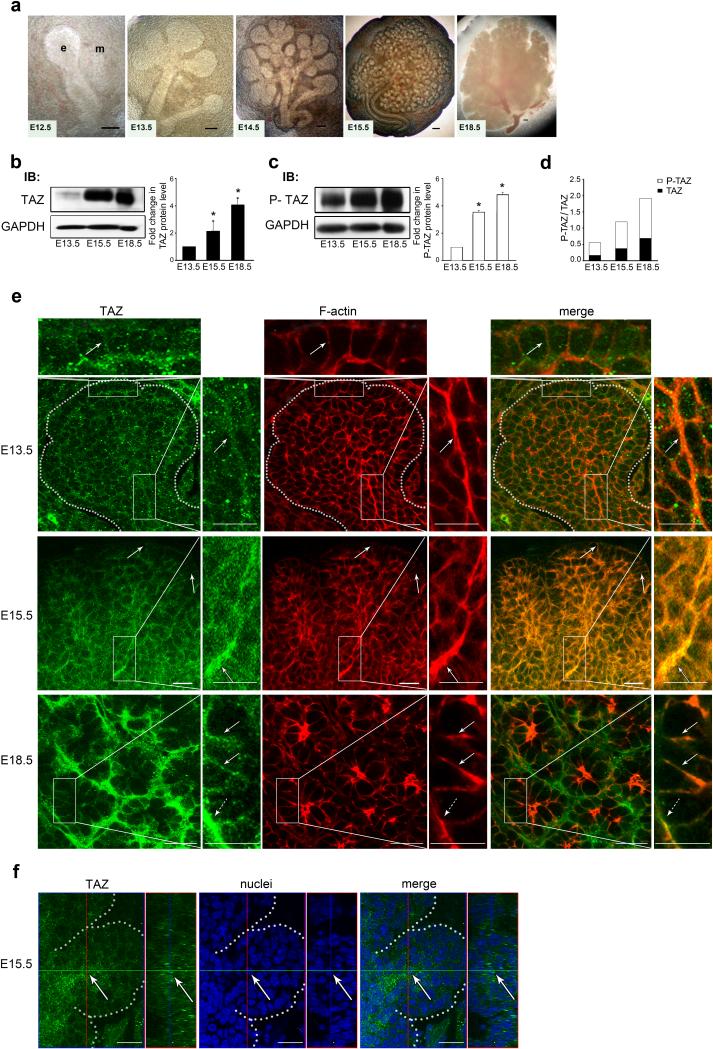
Sjogren's syndrome (SS) is a complex autoimmune disease that primarily affects salivary and lacrimal glands and is associated with high morbidity. Although the prevailing dogma is that immune system pathology drives SS, increasing evidence points to structural defects, including defective E-cadherin adhesion, to be involved in its etiology. We have shown that E-cadherin has pivotal roles in the development of the mouse salivary submandibular gland (SMG) by organizing apical-basal polarity in acinar and ductal progenitors and by signaling survival for differentiating duct cells. Recently, E-cadherin junctions have been shown to interact with effectors of the Hippo signaling pathway, a core pathway regulating the organ size, cell proliferation, and differentiation. We now show that Hippo signaling is required for SMG-branching morphogenesis and is involved in the pathophysiology of SS. During SMG development, a Hippo pathway effector, TAZ, becomes increasingly phosphorylated and associated with E-cadherin and α-catenin, consistent with the activation of Hippo signaling. Inhibition of Lats2, an upstream kinase that promotes TAZ phosphorylation, results in dysmorphogenesis of the SMG and impaired duct formation. SMGs from non-obese diabetic mice, a mouse model for SS, phenocopy the Lats2-inhibited SMGs and exhibit a reduction in E-cadherin junctional components, including TAZ. Importantly, labial specimens from human SS patients display mislocalization of TAZ from junctional regions to the nucleus, coincident with accumulation of extracellular matrix components, fibronectin and connective tissue growth factor, known downstream targets of TAZ. Our studies show that Hippo signaling has a crucial role in SMG-branching morphogenesis and provide evidence that defects in this pathway are associated with SS in humans.
Figures


Similar articles
-
P2Y2 nucleotide receptor up-regulation in submandibular gland cells from the NOD.B10 mouse model of Sjögren's syndrome.Arch Oral Biol. 2005 Jun;50(6):533-40. doi: 10.1016/j.archoralbio.2004.11.005. Epub 2004 Dec 15. Arch Oral Biol. 2005. PMID: 15848146
-
Plasmacytoid dendritic cells promote the pathogenesis of Sjögren's syndrome.Biochim Biophys Acta Mol Basis Dis. 2022 Feb 1;1868(2):166302. doi: 10.1016/j.bbadis.2021.166302. Epub 2021 Nov 12. Biochim Biophys Acta Mol Basis Dis. 2022. PMID: 34780913 Free PMC article.
-
The Hippo pathway effector YAP is an essential regulator of ductal progenitor patterning in the mouse submandibular gland.Elife. 2017 May 11;6:e23499. doi: 10.7554/eLife.23499. Elife. 2017. PMID: 28492365 Free PMC article.
-
Research progress on Hippo signaling pathway effector molecules in rheumatic immune system diseases.Zhejiang Da Xue Xue Bao Yi Xue Ban. 2024 Jun 19;53(3):376-381. doi: 10.3724/zdxbyxb-2023-0567. Zhejiang Da Xue Xue Bao Yi Xue Ban. 2024. PMID: 38899353 Free PMC article. Review. Chinese, English.
-
Sjogren's Syndrome and TAM Receptors: A Possible Contribution to Disease Onset.J Immunol Res. 2019 May 13;2019:4813795. doi: 10.1155/2019/4813795. eCollection 2019. J Immunol Res. 2019. PMID: 31214622 Free PMC article. Review.
Cited by
-
Epithelial Cell Lineage and Signaling in Murine Salivary Glands.J Dent Res. 2019 Oct;98(11):1186-1194. doi: 10.1177/0022034519864592. Epub 2019 Jul 22. J Dent Res. 2019. PMID: 31331226 Free PMC article. Review.
-
Regulation of myoepithelial differentiation.PLoS One. 2022 May 26;17(5):e0268668. doi: 10.1371/journal.pone.0268668. eCollection 2022. PLoS One. 2022. PMID: 35617216 Free PMC article.
-
Primary Sjögren's syndrome: new perspectives on salivary gland epithelial cells.Eur J Med Res. 2024 Jul 17;29(1):371. doi: 10.1186/s40001-024-01967-5. Eur J Med Res. 2024. PMID: 39014509 Free PMC article. Review.
-
The contribution of specific cell subpopulations to submandibular salivary gland branching morphogenesis.Curr Opin Genet Dev. 2015 Jun;32:47-54. doi: 10.1016/j.gde.2015.01.007. Epub 2015 Feb 20. Curr Opin Genet Dev. 2015. PMID: 25706196 Free PMC article. Review.
-
Relation Between Immunohistochemical Expression of Hippo Pathway Effectors and Chronic Hepatitis Induced Fibrosis in Egyptian Patients.Turk Patoloji Derg. 2020;36(1):48-63. doi: 10.5146/tjpath.2019.01463. Turk Patoloji Derg. 2020. PMID: 31282549 Free PMC article.
References
-
- Jonsson R, Bolstad AI, Brokstad KA, et al. Sjogren's syndrome--a plethora of clinical and immunological phenotypes with a complex genetic background. Ann N Y Acad Sci. 2007 Jun;1108:433–47. - PubMed
-
- Hatzopoulos S, Amoroso C, Aimoni C, et al. Hearing loss evaluation of Sjogren's syndrome using distortion product otoacoustic emissions. Acta Otolaryngol Suppl. 2002;(548):20–5. - PubMed
-
- Boki KA, Ioannidis JP, Segas JV, et al. How significant is sensorineural hearing loss in primary Sjogren's syndrome? An individually matched case-control study. J Rheumatol. 2001 Apr;28(4):798–801. - PubMed
-
- Ferrer JP, Biurrun O, Lorente J, et al. Auditory function in young patients with type 1 diabetes mellitus. Diabetes Res Clin Pract. 1991 Jan;11(1):17–22. - PubMed
-
- Fukushima H, Cureoglu S, Schachern PA, et al. Cochlear changes in patients with type 1 diabetes mellitus. Otolaryngol Head Neck Surg. 2005 Jul;133(1):100–6. - PubMed
Publication types
MeSH terms
Substances
Grants and funding
LinkOut - more resources
Full Text Sources
Other Literature Sources
Medical
Molecular Biology Databases
