. 2013 Oct 21;58(20):7391-418.
doi: 10.1088/0031-9155/58/20/7391. Epub 2013 Sep 30.

Dynamic whole-body PET parametric imaging: I. Concept, acquisition protocol optimization and clinical application

Affiliations

Dynamic whole-body PET parametric imaging: I. Concept, acquisition protocol optimization and clinical application

Nicolas A Karakatsanis et al. Phys Med Biol. .

Abstract

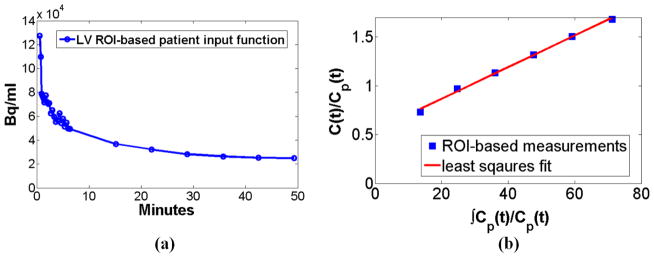
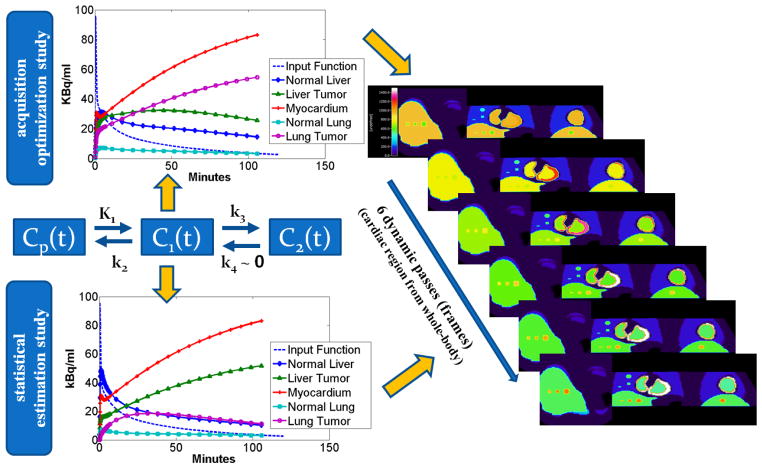
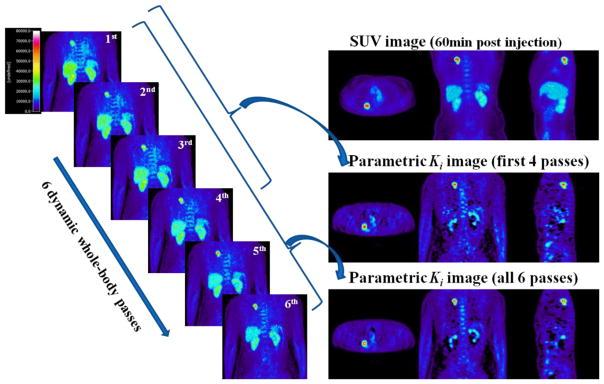
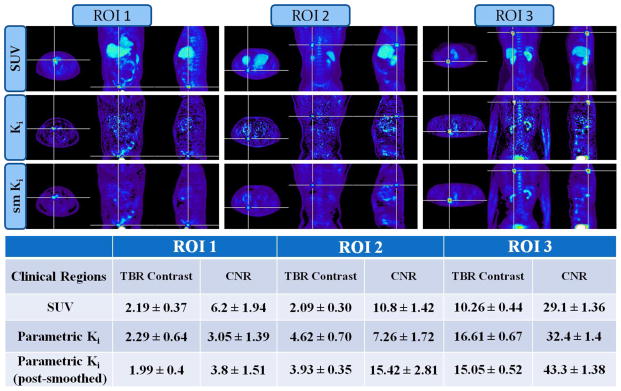
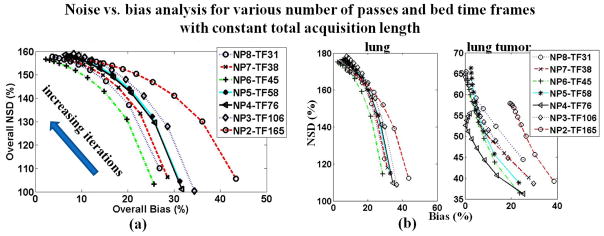
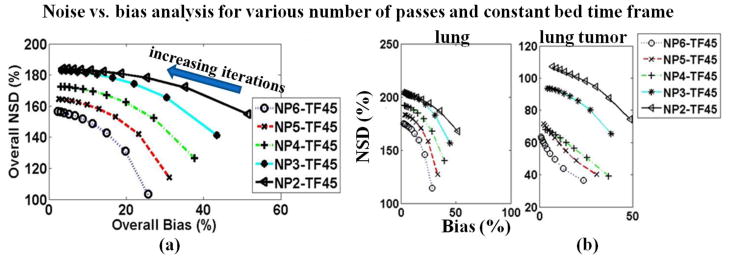
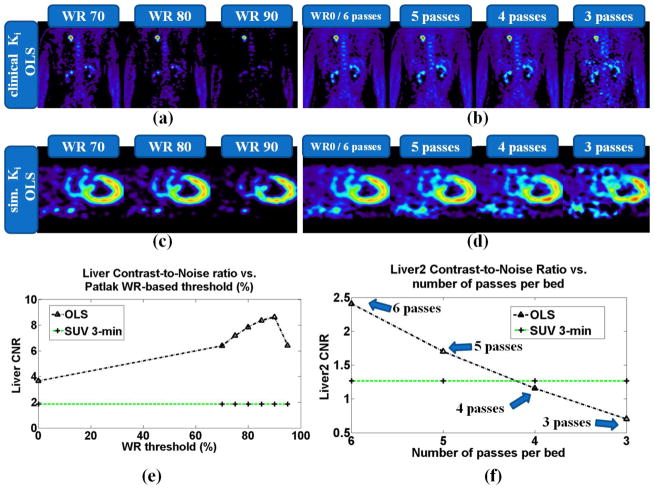
Static whole-body PET/CT, employing the standardized uptake value (SUV), is considered the standard clinical approach to diagnosis and treatment response monitoring for a wide range of oncologic malignancies. Alternative PET protocols involving dynamic acquisition of temporal images have been implemented in the research setting, allowing quantification of tracer dynamics, an important capability for tumor characterization and treatment response monitoring. Nonetheless, dynamic protocols have been confined to single-bed-coverage limiting the axial field-of-view to ~15-20 cm, and have not been translated to the routine clinical context of whole-body PET imaging for the inspection of disseminated disease. Here, we pursue a transition to dynamic whole-body PET parametric imaging, by presenting, within a unified framework, clinically feasible multi-bed dynamic PET acquisition protocols and parametric imaging methods. We investigate solutions to address the challenges of: (i) long acquisitions, (ii) small number of dynamic frames per bed, and (iii) non-invasive quantification of kinetics in the plasma. In the present study, a novel dynamic (4D) whole-body PET acquisition protocol of ~45 min total length is presented, composed of (i) an initial 6 min dynamic PET scan (24 frames) over the heart, followed by (ii) a sequence of multi-pass multi-bed PET scans (six passes × seven bed positions, each scanned for 45 s). Standard Patlak linear graphical analysis modeling was employed, coupled with image-derived plasma input function measurements. Ordinary least squares Patlak estimation was used as the baseline regression method to quantify the physiological parameters of tracer uptake rate Ki and total blood distribution volume V on an individual voxel basis. Extensive Monte Carlo simulation studies, using a wide set of published kinetic FDG parameters and GATE and XCAT platforms, were conducted to optimize the acquisition protocol from a range of ten different clinically acceptable sampling schedules examined. The framework was also applied to six FDG PET patient studies, demonstrating clinical feasibility. Both simulated and clinical results indicated enhanced contrast-to-noise ratios (CNRs) for Ki images in tumor regions with notable background FDG concentration, such as the liver, where SUV performed relatively poorly. Overall, the proposed framework enables enhanced quantification of physiological parameters across the whole body. In addition, the total acquisition length can be reduced from 45 to ~35 min and still achieve improved or equivalent CNR compared to SUV, provided the true Ki contrast is sufficiently high. In the follow-up companion paper, a set of advanced linear regression schemes is presented to particularly address the presence of noise, and attempt to achieve a better trade-off between the mean-squared error and the CNR metrics, resulting in enhanced task-based imaging.


Figures

Figure 1
Figure 1
A graph for the compartment model of 18F-FDG tracer uptake. Cp(t), C1(t) and C2(t) are the tracer concentration in plasma, free (reversible) and metabolized (irreversible, k4 ~ 0) compartments respectively.
Figure 2
Figure 2
Illustration of the acquisition time sequence for the later 6 whole-body passes (second phase of the protocol). Each row describes the acquisition of a particular whole-body pass over time (only 3 of the 6 passes are shown). The time is running row-wise. Note that every pass consists of 7 bed positions. Each column corresponds to one bed position. The earlier dynamic scan is performed on bed 3, for the first 6min after injection, and is not shown here.
Figure 3
Figure 3
(a) A patient input function as extracted from LV ROIs drawn on the 30 dynamic cardiac frames of our proposed optimized whole-body acquisition protocol. (b) Patlak plot obtained from the previous input functions measurements and a patient tumor ROI drawn on the last 6 frames of a bed.
Figure 4
Figure 4
A flow chart demonstrating application of Patlak correlation-coefficient(WR)-based thresholding on the clinical whole-body parametric images. Initially the WR image is calculated and WR clustering is performed. Subsequently, WR at each voxel is compared against a user-defined threshold and, if it is higher, the original parameter value is retained in the thresholded image, otherwise the zero value is assigned to the voxel. The resulting WR-based thresholded Ki image, is compared against standard Ki image. A WR reference value (WR_threshold) of 0.85 has been used for the particular patient data.
Figure 5
Figure 5
An example of a whole-body 4D XCAT phantom in standalone view (left and center) and visualized inside a GATE simulated gantry
Figure 6
Figure 6
(middle left) The 2-compartment PET tracer kinetic model and the resulting true time activity curves (TACs) for a collection of tumor and background regions for (upper left) acquisition optimization study and (bottom left) the statistical estimation study. (right) The true activity distribution for the last 6 dynamic frames of the cardiac bed position at times specific to NP6_TF45 protocol.
Figure 7
Figure 7
(left) the last 6 whole body dynamic frames as acquired with NP6_TF45 protocol, (right): The SUV image, the Ki parametric image derived from all 6 last frames and the Ki image after omitting the last 2 frames. Note that the patient tumor region here (lung tumor) corresponds to the third class of contrast environments, as discussed in section 6.2, and is expected to exhibit similar CNR levels both in SUV and Ki imaging.
Figure 8
Figure 8
(top) Clinical whole-body SUV, Ki and post-smoothed Ki (sm Ki) images of three suspected tumor regions (bottom): tumor-to-background contrast values measured from extracted ROI mean values drawn on the previous images
Figure 9
Figure 9
True (noise-free) and simulated PET cardiac bed frames acquired with protocol NP6_TF45: (1st row from left to right) The true activity map of the last frame (30th after including the first 24 cardiac frames), the true parametric Ki image and a simulated 3min SUV frame acquired from simulated data 60min post injection. (2nd and 3rd row from left to right) The last 6 simulated dynamic frames reconstructed with OS-MAP-OSL algorithm (21 subsets, 5 iterations)
Figure 10
Figure 10
Parametric Ki images produced by acquisition schemes of (a) From left to right, row by row: constant 45min total scan time and variable number of passes starting from 8 and decreasing to 2. (b) From left to right, row by row: constant 45sec bed time frames and variable number of passes starting from 6 and decreasing to 2.
Figure 11
Figure 11
(a) Overall and (b) ROI-based noise vs. bias plots for parametric Ki images acquired according to protocols with a constant 50min total scan time post injection and variable number of passes and time frames. For all diagrams, proximity to the origin (i.e. low NSD and Bias) of a point or curve is a metric of good performance. The NSD values are increasing with increasing number of iterations (1 to 10).
Figure 12
Figure 12
(a) Overall and (b) ROI-based noise vs. bias plots for parametric Ki images acquired with protocols of constant bed frame (45sec) and various number of passes ranging from 2 to 6. For all diagrams, proximity to the origin (i.e. low NSD and Bias) of a point or curve is a metric of good performance. The NSD values are increasing with increasing number of iterations.
Figure 13
Figure 13
(top row) Clinical whole-body Ki images, acquired with NP6_TF45 protocol, after (a) thresholding based on a range of different WR reference values and (b) gradually omitting the last dynamic frames of each bed. (middle row): (c) and (d) Same type of Ki images with top row, but for a simulated cardiac bed frame. (bottom row): Liver tumor CNR quantitative analysis for (e) large size tumor (liver) vs. WR threshold and (f) medium-sized tumor (liver2) vs. number of passes per bed. For the latter plot, the liver tumor CNR performance for protocols NP6_TF45, NP5_TF45 and NP3_TF45 was compared. The equivalent SUV images for the simulated and clinical data can be found at figures 9 and 7 respectively.

References

    1. Adams M, Turkington T, Wilson J, Wong T. A systematic review of the factors affecting accuracy of SUV measurements. American Journal of Roentgenology. 2010;195(2):310–320. - PubMed
    1. Allen D. Mean Square Error of Prediction as a Criterion for Selecting Variables. Technometrics. 1971;13(3):469–475.
    1. Bergstorm M, Eriksson L, Bohn C, Blomqvist G, Litton J. Correction for scattered radiation in a ring detector positron camera by integral transformation of the projections. J Comput Assist Tomogr. 1983;7:42–50. - PubMed
    1. Burger I, Burger C, Berthold T, Buck A. Simplified quantification of FDG metabolism in tumors using the autoradiographic method is less dependent on the acquisition time than SUV. Nuclear Medicine and Biology. 2011;38:835–841. - PubMed
    1. Castell F, Cook G. Quantitative techniques in 18-FDG PET scanning in oncology. British Journal of Cancer. 2008;98(10):1597–1601. - PMC - PubMed

Publication types

MeSH terms