. 2013 Oct 21;58(20):7419-45.
doi: 10.1088/0031-9155/58/20/7419. Epub 2013 Sep 30.

Dynamic whole-body PET parametric imaging: II. Task-oriented statistical estimation

Affiliations

Dynamic whole-body PET parametric imaging: II. Task-oriented statistical estimation

Nicolas A Karakatsanis et al. Phys Med Biol. .

Abstract

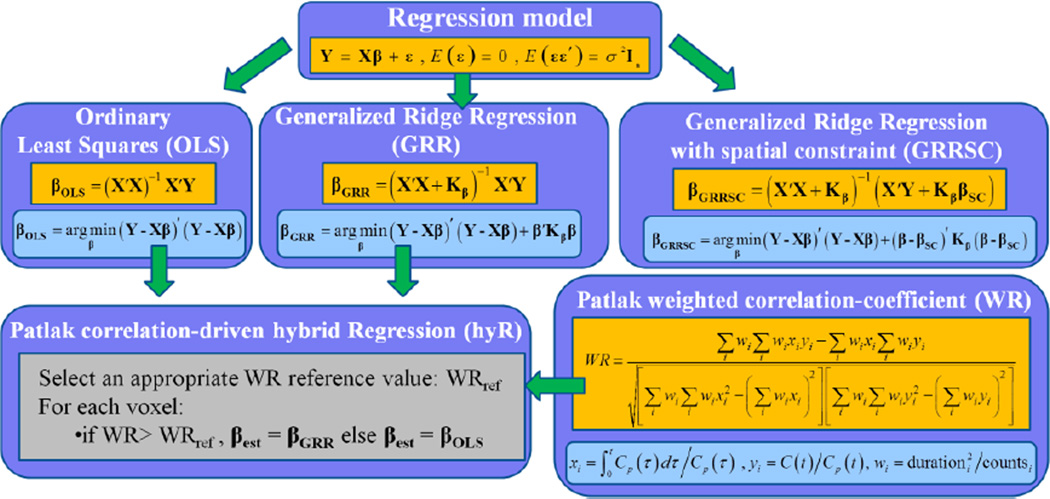
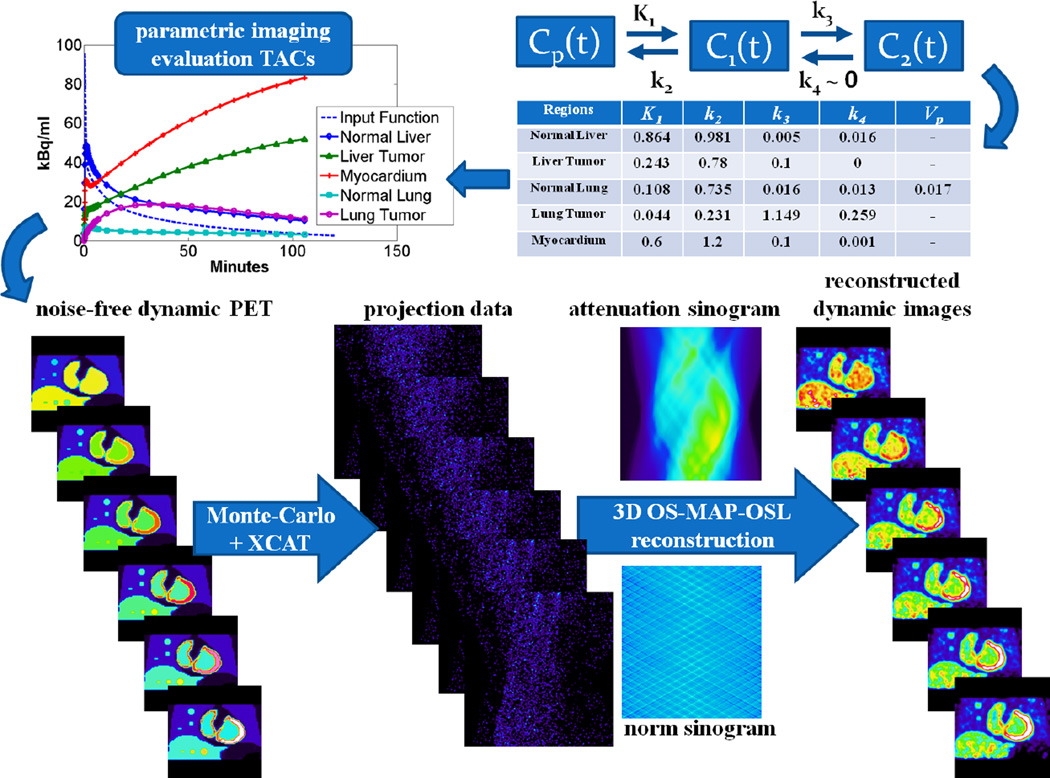
In the context of oncology, dynamic PET imaging coupled with standard graphical linear analysis has been previously employed to enable quantitative estimation of tracer kinetic parameters of physiological interest at the voxel level, thus, enabling quantitative PET parametric imaging. However, dynamic PET acquisition protocols have been confined to the limited axial field-of-view (~15-20 cm) of a single-bed position and have not been translated to the whole-body clinical imaging domain. On the contrary, standardized uptake value (SUV) PET imaging, considered as the routine approach in clinical oncology, commonly involves multi-bed acquisitions, but is performed statically, thus not allowing for dynamic tracking of the tracer distribution. Here, we pursue a transition to dynamic whole-body PET parametric imaging, by presenting, within a unified framework, clinically feasible multi-bed dynamic PET acquisition protocols and parametric imaging methods. In a companion study, we presented a novel clinically feasible dynamic (4D) multi-bed PET acquisition protocol as well as the concept of whole-body PET parametric imaging employing Patlak ordinary least squares (OLS) regression to estimate the quantitative parameters of tracer uptake rate Ki and total blood distribution volume V. In the present study, we propose an advanced hybrid linear regression framework, driven by Patlak kinetic voxel correlations, to achieve superior trade-off between contrast-to-noise ratio (CNR) and mean squared error (MSE) than provided by OLS for the final Ki parametric images, enabling task-based performance optimization. Overall, whether the observer's task is to detect a tumor or quantitatively assess treatment response, the proposed statistical estimation framework can be adapted to satisfy the specific task performance criteria, by adjusting the Patlak correlation-coefficient (WR) reference value. The multi-bed dynamic acquisition protocol, as optimized in the preceding companion study, was employed along with extensive Monte Carlo simulations and an initial clinical (18)F-deoxyglucose patient dataset to validate and demonstrate the potential of the proposed statistical estimation methods. Both simulated and clinical results suggest that hybrid regression in the context of whole-body Patlak Ki imaging considerably reduces MSE without compromising high CNR. Alternatively, for a given CNR, hybrid regression enables larger reductions than OLS in the number of dynamic frames per bed, allowing for even shorter acquisitions of ~30 min, thus further contributing to the clinical adoption of the proposed framework. Compared to the SUV approach, whole-body parametric imaging can provide better tumor quantification, and can act as a complement to SUV, for the task of tumor detection.


Figures

Figure 1
Figure 1
A graph for the compartment model of 18F-FDG tracer uptake. Cp(t), C1(t) and C2(t) are the tracer concentration in plasma, free (reversible) and metabolized (irreversible, k4 ~ 0) compartments respectively.
Figure 2
Figure 2
Illustration of the acquisition time sequence for the later 6 whole-body passes (second phase of the protocol). Each row describes the acquisition of a particular whole-body pass over time (only 3 of the 6 passes are shown). The time is running row-wise. Note that every pass consists of 7 bed frames. Each column corresponds to one bed position. The earlier dynamic scan is performed on bed 3, for the first 6min after injection, and is not shown here.
Figure 3
Figure 3
An overview of the Patlak linear regression model and the relevant parameter estimation methods examined in this study. Hybrid regression is implemented by efficiently selecting between OLS and GRR regression techniques based on weighted Patlak correlation-coefficient WR at each voxel.
Figure 4
Figure 4
A flow chart describing the proposed algorithm of hybrid regression. Initially the kinetic correlation-coefficient WR image is calculated and WR clustering is performed. Subsequently, the WR at each voxel is compared against a user-defined threshold and, if it is higher, GRR is applied at the particular voxel TAC, otherwise OLS followed by post-smoothing. The result, hybrid regression is compared against standalone smoothed OLS or GRR. In this flow-chart WR reference was 0.85.
Figure 5
Figure 5
A flow chart illustrating the process to generate realistic 4D simulation data.
Figure 6
Figure 6
Image comparison between our proposed parametric Ki imaging methods, the true Ki image and the SUV (GATE simulation data reconstructed with STIR OSEM algorithm, 21 subsets, 5 iterations).
Figure 7
Figure 7
Quantitative analysis for a major subset of proposed parametric imaging methods: Plots of CNR vs iterations for a large (15mm diameter) (a) liver tumor and (b) lung tumor. WR driven post-smoothed OLS is not shown, because it exhibits same performance as GRRSC.
Figure 8
Figure 8
(a) Simulated images illustrating the effect of kinetic WR driven thresholding on PET parametric imaging and (b) quantitative analysis of a large (15mm diameter) liver tumor (liver1) CNR in parametric images produced by OLS, GRR and GRRSC estimation methods for various WR reference (threshold) levels, against CNR in SUV. The latter CNR is independent of the threshold, but is plotted for comparisons.
Figure 9
Figure 9
(a) The effect of utilizing 6, 5, 4 or just 3 dynamic frames per bed for three different estimation methods in whole body PET parametric imaging (simulated data) and (b): Quantitative analysis of this effect on a medium-sized (10mm diameter) liver tumor (liver2) CNR in parametric imaging, against SUV. SUV CNR is independent of the number of dynamic frames and is plotted only for comparisons. Note that OLS, GRR and GRRSC GRR plots almost coincide with each other implying very similar CNR performance with respect to number of frames.
Figure 10
Figure 10
(a) Quantitative analysis of 1/CNR vs. ensemble RMSE for the 15mm diameter liver tumor for a range of full OSEM iterations and (b) for a range of passes per bed for different parametric images. WR-driven post-smoothing of OLS performance is not shown, because it is very similar with GRRSC in all cases. For both diagrams, proximity to the origin (i.e. high CNR and low RMSE) of a point or curve is a metric of good performance. In (a) the 1/CNR values increase with increasing number of iterations, while in (b) it decreases with increasing number of passes.
Figure 11
Figure 11
(a): A collection of clinical whole body PET parametric Ki images, as obtained with GE Discovery RX scanner from one of the patients examined, compared against SUV image. The lung tumor is visible in the upper left part of all images. (b): Lung tumor ROI contrast-to-noise (CNR) analysis for a collection of patient Patlak methods against SUV, as measured from the patient images presented in right section
Figure 12
Figure 12
Clinical demonstration of the effect of (a) kinetic correlation driven thresholding and (b) reduction of later dynamic frames on clinical whole body PET parametric imaging

References

    1. Adams M, Turkington T, Wilson J, Wong T. A systematic review of the factors affecting accuracy of SUV measurements. American Journal of Roentgenology. 2010;vol. 195(no. 2):310–320. - PubMed
    1. Allen D. Mean Square Error of Prediction as a Criterion for Selecting Variables Technometrics. 1971;Vol. 13(No. 3):469–475.
    1. Burger I, Burger C, Berthold T, Buck A. Simplified quantification of FDG metabolism in tumors using the autoradiographic method is less dependent on the acquisition time than SUV. Nuclear Medicine and Biology. 2011;38:835–841. - PubMed
    1. Byrtek M, O'Sullivan F, Muzi M, Spence AM. An Adaptation of Ridge Regression for Improved Estimation of Kinetic Model Parameters From PET Studies. IEEE Trans. on Nucl. Science. 2005;Vol. 52(No. 1)
    1. Castell F, Cook G. Quantitative techniques in 18-FDG PET scanning in oncology. British Journal of Cancer. 2008;vol. 98(no. 10):1597–1601. - PMC - PubMed

Publication types

Substances