

Measuring cerebrovascular reactivity: what stimulus to use?
- PMID: 24081155
- PMCID: PMC3872753
- DOI: 10.1113/jphysiol.2013.259150
Measuring cerebrovascular reactivity: what stimulus to use?
Abstract
Cerebrovascular reactivity is the change in cerebral blood flow in response to a vasodilatory or vasoconstrictive stimulus. Measuring variations of cerebrovascular reactivity between different regions of the brain has the potential to not only advance understanding of how the cerebral vasculature controls the distribution of blood flow but also to detect cerebrovascular pathophysiology. While there are standardized and repeatable methods for estimating the changes in cerebral blood flow in response to a vasoactive stimulus, the same cannot be said for the stimulus itself. Indeed, the wide variety of vasoactive challenges currently employed in these studies impedes comparisons between them. This review therefore critically examines the vasoactive stimuli in current use for their ability to provide a standard repeatable challenge and for the practicality of their implementation. Such challenges include induced reductions in systemic blood pressure, and the administration of vasoactive substances such as acetazolamide and carbon dioxide. We conclude that many of the stimuli in current use do not provide a standard stimulus comparable between individuals and in the same individual over time. We suggest that carbon dioxide is the most suitable vasoactive stimulus. We describe recently developed computer-controlled MRI compatible gas delivery systems which are capable of administering reliable and repeatable vasoactive CO2 stimuli.
Figures
 (blue upper) and
  (red lower). End-tidal values are
  (red filled squares) and
  (green filled circles), each representing a single breath. A, sinusoidal changes of
  and
and  are implemented in phase until the blue arrow, when the phase of the
  is changed 180 deg. B, sinusoidal changes of
  and
and  are implemented with the period of
  twice that of
  . C, simultaneous square wave changes in
  and
and  are implemented independently of each other. In the sinusoidal patterns, the target
  and
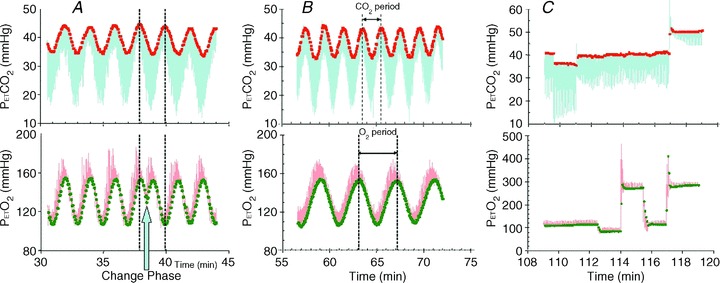
and  change with each breath. The algorithm used to reach these targets is context sensitive, that is, it takes into account the current gas concentrations in the lung as well as the target history. This means that the set of flows and inspired gas concentrations differ – even for the same recurrent end-tidal target values, whether they be in a sinusoidal sequence or steady target level. The algorithm uses the baseline
  , and resting CO2 production and O2 consumption to calculate inspired gas parameters. Baseline
  is based on the
  during rest. Resting CO2 production and O2 consumption are calculated from a nomogram based on sex, height and weight. Errors in presumption of CO2 production or O2 consumption, or changes in these due to changes in activity or muscle tone, result in target values drifting over time, as can be seen in A and C.
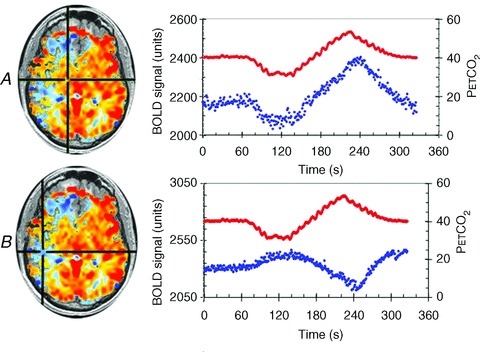
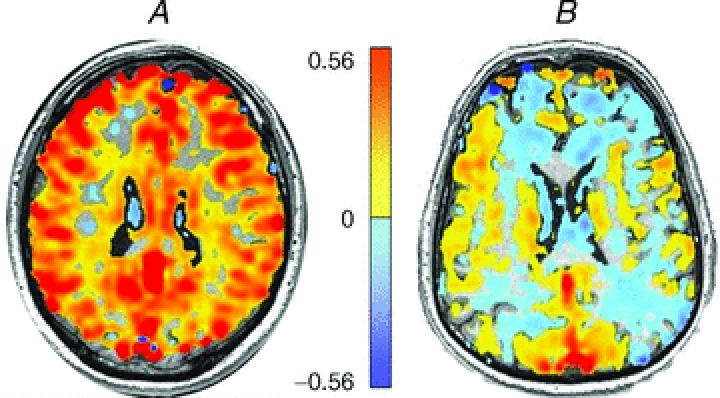
 (red dots). A, a voxel with positive CVR. B, a voxel with negative CVR (vascular steal). In each case the BOLD signals track the
  stimulus, indicating that a precise and accurate measurement of CVR requires accuracy and precision of the
  stimulus as well as the surrogate measure of cerebral blood flow.
References
-
- Aaslid R, Lindegaard KF, Sorteberg W, Nornes H. Cerebral autoregulation dynamics in humans. Stroke. 1989;20:45–52. - PubMed
-
- Ainslie PN, Duffin J. Integration of cerebrovascular CO2 reactivity and chemoreflex control of breathing: mechanisms of regulation, measurement, and interpretation. Am J Physiol Regul Integr Comp Physiol. 2009;296:R1473–R1495. - PubMed
-
- Artru a A, Colley PS. Cerebral blood flow responses to hypocapnia during hypotension. Stroke. 1984;15:878–883. - PubMed
-
- Asghar MS, Hansen a E, Pedersen S, Larsson HB, Ashina M. Pharmacological modulation of the BOLD response: a study of acetazolamide and glyceryl trinitrate in humans. J Magn Reson Imaging. 2011;34:921–927. - PubMed
Publication types
MeSH terms
LinkOut - more resources
Full Text Sources
Other Literature Sources