. 2013 Dec;33(23):4701-17.
doi: 10.1128/MCB.00198-13. Epub 2013 Sep 30.

The yeast AMPK homolog SNF1 regulates acetyl coenzyme A homeostasis and histone acetylation

Affiliations

The yeast AMPK homolog SNF1 regulates acetyl coenzyme A homeostasis and histone acetylation

Man Zhang et al. Mol Cell Biol. 2013 Dec.

Abstract

Acetyl coenzyme A (acetyl-CoA) is a key metabolite at the crossroads of metabolism, signaling, chromatin structure, and transcription. Concentration of acetyl-CoA affects histone acetylation and links intermediary metabolism and transcriptional regulation. Here we show that SNF1, the budding yeast ortholog of the mammalian AMP-activated protein kinase (AMPK), plays a role in the regulation of acetyl-CoA homeostasis and global histone acetylation. SNF1 phosphorylates and inhibits acetyl-CoA carboxylase, which catalyzes the carboxylation of acetyl-CoA to malonyl-CoA, the first and rate-limiting reaction in the de novo synthesis of fatty acids. Inactivation of SNF1 results in a reduced pool of cellular acetyl-CoA, globally decreased histone acetylation, and reduced fitness and stress resistance. The histone acetylation and transcriptional defects can be partially suppressed and the overall fitness improved in snf1Δ mutant cells by increasing the cellular concentration of acetyl-CoA, indicating that the regulation of acetyl-CoA homeostasis represents another mechanism in the SNF1 regulatory repertoire.


Figures

Fig 1
Fig 1
Inactivation of SNF1 affects acetyl-CoA homeostasis and results in hypoacetylation of histones H3 and H4. Acetyl-CoA (A) and malonyl-CoA (B) were assayed in cell lysates of the indicated strains by ELISA. The concentrations of acetyl-CoA and malonyl-CoA in wild-type (WT) cells were 1.8 nmol/107 cells and 21.3 pmol/107 cells, respectively. (C) snf1Δ mutant cells display lower levels of acH3 and acH4. The indicated strains were grown in YPD medium to an A600 of 1.0 at 30°C and analyzed by Western blotting with antibodies against histone H3 acetylated at lysine 14 (acH3), hyperacetylated histone H4 (acH4), and total histone H3. The experiment was performed three times, and representative results are shown. The intensity of each acH3 and acH4 band was quantified by densitometry and normalized with H3 as a loading control of each lane. (D) Phosphorylation of serine 10 of histone H3 does not affect the acetylation of bulk histones. Wild-type and H3S10A mutant cells were grown and analyzed as described above. (A to D) The experiments were repeated three times, and the results are shown as means ± standard deviations. Values that are statistically significantly different (P < 0.05) from the wild-type values are indicated by an asterisk. Values that are statistically significantly different (P < 0.05) from each other are indicated by a bracket and an asterisk. (E) Mutations that affect the activity of the SNF1 complex result in the hypoacetylation of histones H3 and H4. The indicated strains were grown in YPD medium to an A600 of 1.0 at 30°C and analyzed by Western blotting with antibodies against histone H3 acetylated at lysine 14 (acH3), hyperacetylated histone H4 (acH4), and total histone H3. The experiment was performed three times, and representative results are shown.
Fig 2
Fig 2
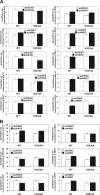
snf1Δ mutant cells display decreased untargeted acetylation of chromatin histones. The indicated strains were grown at 30°C in YPD medium to an A600 of 1.0. ChIP experiments were performed with antibodies against total histone H3 (H3), histone H3 acetylated at lysine 14 (acH3), and hyperacetylated histone H4 (acH4). Occupancies of H3, acH3, and acH4 were determined in the promoter regions of SNF1-dependent genes (A) and SNF1-independent loci (B). Acetylation per nucleosome was calculated as ratios of acH3 to total H3 and acH4 to total H3. The experiments were repeated three times, and the results are shown as means ± standard deviations. Values that are statistically significantly different (P < 0.05) from the wild-type (WT) values are indicated by an asterisk. Values that are statistically significantly different (P < 0.05) from each other are indicated by a bracket and an asterisk.
Fig 3
Fig 3
Phosphorylation of histone H3 at serine 10 does not affect the acetylation of chromatin histones. The indicated strains were grown at 30°C in YPD medium to an A600 of 1.0. ChIP experiments were performed with antibodies against total histone H3 (H3), histone H3 acetylated at lysine 14 (acH3), and hyperacetylated histone H4 (acH4). Occupancies of H3, acH3, and acH4 were determined in the promoter regions of SNF1-dependent genes (A) and SNF1-independent loci (B). Acetylation per nucleosome was calculated as ratios of AcH3 to total H3 and acH4 to total H3. The experiments were repeated three times, and the results are shown as means ± standard deviations. The acetylation per nucleosome in wild-type (WT) and H3S10A cells was not statistically significantly different at any of the loci tested.
Fig 4
Fig 4
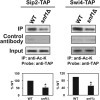
snf1Δ mutant cells display reduced acetylation of nonchromatin proteins. Wild-type (WT) and snf1Δ mutant cells were grown in YPD medium at 30°C to an A600 of 1.0. Acetylated proteins were immunoprecipitated (IP) with anti-acetyllysine antibody or control antibody (normal mouse IgG) and analyzed by Western blotting with antibodies against the tandem affinity purification (TAP) tag. Typical results from three independent experiments are shown. The intensity of each immunoprecipitated band was quantified by densitometry and expressed as a percentage of the wild-type value ± the standard deviation. The asterisks indicate that the values were statistically significantly different (P < 0.05) from the wild-type value.
Fig 5
Fig 5
The snf1Δ mutation displays genetic interactions with mutations in HATs and HDACs. (A) Inactivation of HDA1 or RPD3 partially suppresses the temperature sensitivity of snf1Δ mutant cells. Tenfold serial dilutions of the indicated strains were spotted onto YPD plates and grown for 3 days at 30 or 35°C. (B) Strains with YNG2 or GCN5 deleted display a synthetic growth defect with the snf1Δ mutation. Tenfold serial dilutions of the indicated strains were spotted onto YPD plates and grown for 3 days at 30°C. Typical results from three independent experiments are shown. WT, wild type.
Fig 6
Fig 6
Reduced ACC1 expression partially suppresses the stress sensitivity of snf1Δ mutant cells in a HAT-dependent manner. Tenfold serial dilutions of the indicated strains were spotted onto YPD plates and grown for 2 days at 30 or 35°C, grown for 6 days on YPD plates at pH 7.5, or grown for 3 days on YPD plates containing 50 mM hydroxyurea. Typical results from three independent experiments are shown. WT, wild type.
Fig 7
Fig 7
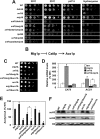
Inactivation of MIG1 requires ACS1 to partially suppress the stress sensitivity and histone hypoacetylation of snf1Δ mutant cells. (A) The hda1Δ or rpd3Δ mutation does not synergize with the mig1Δ mutation in the suppression of the snf1Δ mutation. Tenfold serial dilutions of the indicated strains were spotted onto YPD plates and grown for 2 days at 30 or 35°C, grown for 6 days on YPD plates at pH 7.5, or grown for 3 days on YPD plates containing 50 mM hydroxyurea. Typical results from three independent experiments are shown. (B) Diagram indicating regulation of Acs1p by Mig1p and Cat8p. (C) Suppression of the snf1Δ mutant's slow-growth phenotype by the mig1Δ mutation requires ACS1. Tenfold serial dilutions of the indicated strains were spotted onto YPD plates and grown for 2 days at 30°C. Typical results from three independent experiments are shown. (D) Inactivation of MIG1 increases the expression of CAT8 and ACS1 in snf1Δ mutant cells. The indicated strains were grown in YPD medium to an A600 of 1.0 at 30°C. Total RNA was isolated and assayed for CAT8 and ACS1 transcripts by real-time RT-PCR. The results were normalized to ACT1 RNA and expressed relative to the value for the wild-type (WT) strain. (E) Inactivation of MIG1 increases acetyl-CoA levels in snf1Δ mutant cells in an ACS1-dependent manner. Acetyl-CoA was assayed in cell lysates of the indicated strains by ELISA. The concentration of acetyl-CoA in wild-type cells is 1.8 nmol/107 cells. (F) Inactivation of MIG1 increases the acetylation of histones in snf1Δ mutant cells in an ACS1-dependent manner. The indicated strains were grown in YPD medium to an A600 of 1.0 at 30°C and analyzed by Western blotting with antibodies against histone H3 acetylated at lysine 14 (acH3), hyperacetylated histone H4 (acH4), and total histone H3. The experiment was performed three times, and representative results are shown. (D and E) The experiments were repeated three times, and the results are shown as means ± standard deviations. Values that are statistically significantly different (P < 0.05) from the wild-type values are indicated by an asterisk. Values that are statistically significantly different (P < 0.05) from each other are indicated by a bracket and an asterisk.
Fig 8
Fig 8
Acetyl-CoA homeostasis and histone acetylation contribute to the regulation of SNF1-dependent genes. (A) Inactivation of SNF1 results in the increased expression of genes that are also upregulated in a nonacetylatable histone H4 mutant (H4-K5R/K8R/K12R/K16R). The Venn diagram is based on previously published data sets (62, 63) and shows the extent of overlap between genes upregulated at least 2-fold upon the inactivation of Snf1p in the snf1as mutant strain and genes upregulated at least 2-fold in the H4-K5R/K8R/K12R/K16R strain. The values in parentheses are theoretical values calculated for the chance overlap of two random data sets of the corresponding sizes. (B to F) The indicated strains were grown in YPD medium to an A600 of 1.0 at 30°C. Total RNA was isolated and assayed for ACT1, REG2, GAL4, SUC2, MAL33, HHT1/2, HHF1/2, HTA1/2, and HTB1/2 transcripts by real-time RT-PCR. The results were normalized to ACT1 RNA and expressed relative to the value for the wild-type (WT) strain. (G) The snf1Δ mutant displays a synthetic growth defect with the SWI4-RR mutation. Tenfold serial dilutions of the indicated strains were spotted onto YPD plates and grown for 2 days at 30°C. Typical results from three independent experiments are shown. (B to F) The experiments were repeated three times, and the results are shown as means ± standard deviations. Values that are statistically significantly different (P < 0.05) from the wild-type values are indicated by an asterisk. Values that are statistically significantly different (P < 0.05) from each other are indicated by a bracket and an asterisk.
Fig 9
Fig 9
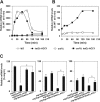
Loss of SUC2 expression in snf1Δ mutant cells is partially suppressed by the tetO7-ACC1 allele. (A) The indicated strains were grown in YPD medium to an A600 of 1.0 at 30°C. The cells were harvested, washed, and resuspended and grown in YEP medium containing 0.05% glucose. Total RNA was isolated and assayed for ACT1 and SUC2 transcripts by real-time RT-PCR. The results were normalized to ACT1 RNA and expressed relative to the value for the wild-type (WT) strain at 0 min. The experiments were repeated three times, and a typical time course is shown. (B) Closeup view of the values for the snf1Δ and snf1Δ tetO7-ACC1 mutants. (C) The indicated strains were grown in YPD medium to an A600 of 1.0 at 30°C. Total RNA was isolated and assayed for ACT1 and SUC2 transcripts by real-time RT-PCR. The results were normalized to ACT1 RNA and expressed relative to the value for the mig1Δ mutant strain. The experiments were repeated three times, and the results are shown as means ± standard deviations. Values that are statistically significantly different (P < 0.05) from those of the mig1Δ mutant strain are indicated by an asterisk, and values that are statistically significantly different (P < 0.05) from each other are indicated by a bracket and an asterisk.
Fig 10
Fig 10
Glucose starvation and refeeding result in an SNF1-dependent increase in the acetyl-CoA level and increased histone acetylation in the promoters of the activated genes. (A, B, and C) Glucose starvation. (A) snf1Δ mutant cells fail to elevate the acetyl-CoA level during glucose starvation. The indicated strains were grown in YPD medium to an A600 of 1.0 at 30°C. The cells were harvested, washed, and resuspended in YEP medium containing 0.05% glucose. Samples were taken at the indicated time points, and acetyl-CoA was assayed in cell lysates. The concentration of acetyl-CoA in wild-type (WT) cells at 0 min was 1.8 nmol/107 cells. The experiments were repeated three times, and the results are shown as means ± standard deviations. (B) ChIP experiments were performed with antibodies against total histone H3 (H3), histone H3 acetylated at lysine 14 (acH3), and hyperacetylated histone H4 (acH4). Occupancies of H3, acH3, and acH4 were determined in the promoter regions of REG2 and GAL4. Acetylation per nucleosome was calculated as ratios of acH3 to total H3 and acH4 to total H3. (C) Total RNA was isolated and assayed for REG2 and GAL4 transcripts by real-time RT-PCR. The results were normalized to ACT1 RNA and expressed relative to the value for the wild-type strain at 0 min. The experiments were repeated three times, and the results are shown as means ± standard deviations. (D, E, and F) Glucose repletion. (D) The increase in the acetyl-CoA level upon glucose addition is attenuated in snf1Δ mutant cells. The indicated strains were grown in YPD medium to an A600 of 0.5 at 30°C. The cells were harvested, washed, and grown in YEP medium containing 0.05% glucose for 2 h. Glucose was added to 2%, and the cells were harvested at the indicated time points for acetyl-CoA assay. The concentration of acetyl-CoA in wild-type cells was 0.9 nmol/107 cells at 0 min. The experiments were repeated three times, and the results are shown as means ± standard deviations. (E) ChIP experiments were performed with antibodies against total histone H3 (H3), histone H3 acetylated at lysine 14 (acH3), and hyperacetylated histone H4 (acH4). Occupancies of H3, acH3, and acH4 were determined in the promoter regions of RPS22B and RPS11B. Acetylation per nucleosome was calculated as ratios of acH3 to total H3 and acH4 to total H3. (F) Total RNA was isolated and assayed for RPS22B and RPS11B transcripts by real-time RT-PCR. The results were normalized to ACT1 RNA and expressed relative to the value for the wild-type strain at 0 min. The experiments were repeated three times, and the results are shown as means ± standard deviations. (B and E) The experiments were repeated three times, and the results are shown as means ± standard deviations. Values that were statistically significantly different (P < 0.05) from each other are indicated by a bracket and an asterisk.
Fig 11
Fig 11
Model of the role of SNF1 in the regulation of acetyl-CoA homeostasis and histone acetylation.

Similar articles

Cited by

References

    1. Hardie DG, Carling D, Carlson M. 1998. The AMP-activated/SNF1 protein kinase subfamily: metabolic sensors of the eukaryotic cell? Annu. Rev. Biochem. 67:821–855 - PubMed
    1. Hardie DG. 2007. AMP-activated/SNF1 protein kinases: conserved guardians of cellular energy. Nat. Rev. Mol. Cell Biol. 8:774–785 - PubMed
    1. Hedbacker K, Carlson M. 2008. SNF1/AMPK pathways in yeast. Front. Biosci. 13:2408–2420 - PMC - PubMed
    1. Jiang R, Carlson M. 1997. The Snf1 protein kinase and its activating subunit, Snf4, interact with distinct domains of the Sip1/Sip2/Gal83 component in the kinase complex. Mol. Cell. Biol. 17:2099–2106 - PMC - PubMed
    1. Hong SP, Leiper FC, Woods A, Carling D, Carlson M. 2003. Activation of yeast Snf1 and mammalian AMP-activated protein kinase by upstream kinases. Proc. Natl. Acad. Sci. U. S. A. 100:8839–8843 - PMC - PubMed

Publication types

MeSH terms